
转型期广州市居民职住模式的群体差异及其影响因素
作者简介:张济婷(1993- ),女,广东韶关人,硕士,研究方向为城市地理学。E-mail:429833178@qq.com
收稿日期: 2017-09-04
要求修回日期: 2017-12-07
网络出版日期: 2018-03-15
基金资助
国家自然科学基金项目(41522104)
广东省自然科学基金项目(2017A030313228,2014A030312010)
The diversity of different groups' job-housing patterns and their impact factors under the background of institutional transformation: A case study of Guangzhou, China
Received date: 2017-09-04
Request revised date: 2017-12-07
Online published: 2018-03-15
Copyright
职住关系是城市研究领域重要的议题之一。体制改革后中国社会分层结构特殊,检验不同阶层居民在职住地选择偏好的差异,有助于理解居民职住格局形成的内部机制。利用广州市入户问卷调查、建成环境和人口普查等数据,采用两步聚类和多项logistic回归,对广州市居民进行阶层划分,对比居民职住模式的群体差异及其影响因素。结果表明:职住决策时,体制外工薪阶层追求低生活成本,受职住地建成环境影响显著;体制内阶层习惯于传统单位制下社会关系密切的社区,受邻里环境影响显著,还受个人属性影响;无固定工作者决策自由和平衡程度高,受少量建成环境因素影响。研究有助于了解居民职住格局形成的制度性机制,为优化居民职住格局提供思路。
关键词: 就业—居住平衡;; 职住模式; 社会阶层; 多项logistic回归; 广州
张济婷 , 周素红 . 转型期广州市居民职住模式的群体差异及其影响因素[J]. 地理研究, 2018 , 37(3) : 564 -576 . DOI: 10.11821/dlyj201803009
Job-housing relationship is one of the most important topics in urban studies. Because of the institutional transformation in China, people who work inside-system or live in urban areas may enjoy more welfare than those who work outside-system or live in rural areas, which makes the social differentiation unique. Dividing people into groups based on attributes related to institutional transformation and investigating what influences different groups' different job-housing situations can help to understand the internal mechanism of how the job-housing situations form in urban China. Mainly according to the result data of a questionnaire with a sample size of 1029, which was finished in Guangzhou in 2016, with the help of the point of interest and the road distribution data of Guangzhou in 2014, as well as the sixth census data of Guangzhou, two-step cluster and multinomial logistic regression are employed to figure out the mechanism. After clustering, three typical job-housing models were defined according to job-housing distance as well as the location of working and living place, and three social groups were defined according to residents' socioeconomic status. And then multinomial logistic regression was employed to compare the different reasons that influence different groups' job-housing situation. The results show that compared to the job-housing balance group, the outside-system group who have steady jobs try to achieve the highest comfort and convenience with the lowest living cost and they are willing to bear long commute for better living condition, so their job-housing models are influenced by the built environment mostly. When it comes to inside-system group, different from the outside-system group, on the one hand, they live in the unit community in the past, so they are used to the close-knit communities, and influenced by community environment obviously, on the other hand, they are influenced by social characters obviously, including marital status and the number of students in the family. The group of people without steady jobs are those who engage in business or have retired and get an informal job again. They have the highest freedom while deciding where to work and where to live, so their decisions about job-housing location are only slightly influenced by some factors about built environment, and the job-housing balance ratio of this group is the highest. This research tries to figure out the mechanism of how different social groups determine their job-housing location in the context of China's unique institutional transformation, and act as references to urban planners and policy makers while putting forward some advice to optimize it.
Tab.1 Index system of the independent variables表1 自变量指标体系 |
| 类别 | 指标 |
|---|---|
| 建成环境 | 混合度(POI种类) |
| 设计(交叉口密度) | |
| 目的地可达性(道路密度) | |
| 交通设施可达性(公交站密度) | |
| 房屋属性 | 房屋新旧程度(住房年代和搬入时间) |
| 房屋规模(房屋面积和房屋产权数量) | |
| 邻里环境 | 邻里关系密切度(邻里融合程度、熟人数量) |
| 稳定性(换工作次数和搬家次数) | |
| 个人属性 | 社会属性(年龄、婚姻状况、是否户主、家庭学生人数) |
| 个人偏好(择居原因) |
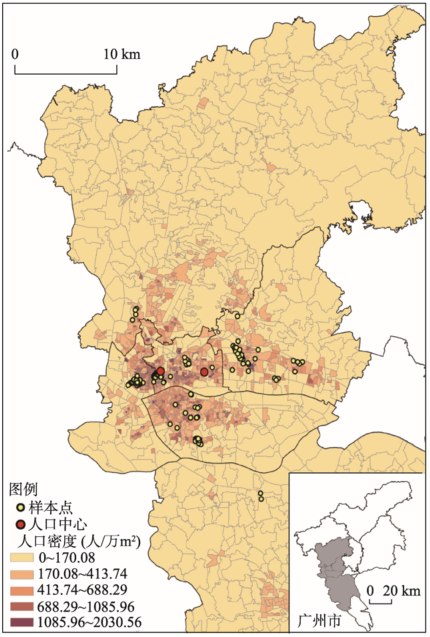
Fig. 1 Research area and sample distribution图1 调研范围及样本分布 |
Tab.2 Characteristics of each social class表2 各阶层人群属性特征 |
| 人群 分类 | 无固定 工作者 | 体制外 工薪 | 体制内 | 合计 | 人群 分类 | 无固定 工作者 | 体制外 工薪 | 体制内 | 合计 | ||
|---|---|---|---|---|---|---|---|---|---|---|---|
| 受教育 程度 | 初中及以下 | 112 | 12 | 13 | 137 | 房屋性质 | 商品房 | 106 | 342 | 111 | 559 |
| 高中 | 73 | 435 | 163 | 671 | 经济适用房 | 13 | 33 | 35 | 81 | ||
| 本科及以上 | 13 | 99 | 67 | 179 | 廉租房 | 0 | 15 | 3 | 18 | ||
| 户籍 | 本地非农 | 149 | 409 | 178 | 736 | 公租房 | 1 | 16 | 4 | 21 | |
| 本地农业 | 5 | 16 | 9 | 30 | 员工宿舍 | 17 | 58 | 48 | 123 | ||
| 外地非农 | 20 | 74 | 35 | 129 | 已购公房 | 15 | 54 | 21 | 90 | ||
| 外地农业 | 24 | 47 | 21 | 92 | 拆迁安置房 | 5 | 8 | 7 | 20 | ||
| 单位种类 | 公有 | 40 | 33 | 240 | 313 | 自建住房 | 40 | 16 | 14 | 70 | |
| 非共有 | 158 | 513 | 3 | 674 | 其他 | 1 | 4 | 0 | 5 | ||
| 1000~1499 | 5 | 1 | 0 | 6 | 职业 | 白领 | 11 | 307 | 0 | 318 | |
| 个人月 收入(元) | 1500~2999 | 33 | 17 | 11 | 61 | 技术工人 | 2 | 84 | 14 | 100 | |
| 3000~4999 | 97 | 208 | 81 | 386 | 体力劳动者 | 9 | 139 | 26 | 174 | ||
| 5000~6999 | 7 | 224 | 96 | 327 | 非固定工作 | 176 | 16 | 0 | 192 | ||
| 7000~8999 | 14 | 72 | 37 | 123 | 机关人员 | 0 | 0 | 203 | 203 | ||
| 9000~12000 | 0 | 20 | 12 | 32 | |||||||
| 12000以上 | 42 | 4 | 6 | 52 | 合计 | 198 | 546 | 243 | 987 | ||
Tab.3 Characteristics of the three job-housing models表3 三类职住模式特征 |
| 变量 | 职住模式 | |||
|---|---|---|---|---|
| 中心平衡模式 | 职住近郊模式 | 职内住外模式 | 所有样本 | |
| 职住距离(km) | 2.28 | 8.43 | 8.38 | 4.76 |
| 就业地到人口中心距离(km) | 2.90 | 15.78 | 3.54 | 3.87 |
| 居住地到人口中心距离(km) | 3.86 | 8.78 | 7.54 | 5.43 |
| 样本数量(个) | 586 | 57 | 344 | 987 |
| 样本占比(%) | 59.37 | 5.78 | 34.85 | 100.00 |
Tab.4 Distribution in job-housing models of each social class表4 不同阶层人群职住模式分布 |
| 职住模式 | 社会阶层 | ||||||||||||||
|---|---|---|---|---|---|---|---|---|---|---|---|---|---|---|---|
| 无固定工作者 | 体制外工薪 | 体制内 | 合计 | ||||||||||||
| A | B | C | A | B | C | A | B | C | A | B | C | ||||
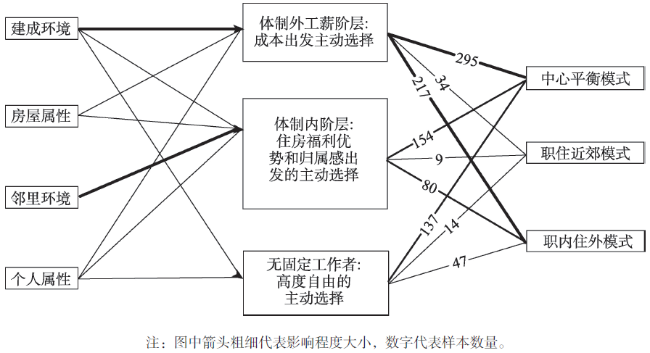
| 中心平衡 | 137 | 69 | 24 | 295 | 54 | 50 | 154 | 63 | 26 | 586 | 59 | 100 | |||
| 职住近郊 | 14 | 7 | 24 | 34 | 6 | 60 | 9 | 4 | 16 | 57 | 6 | 100 | |||
| 职内住外 | 47 | 24 | 14 | 217 | 40 | 63 | 80 | 33 | 23 | 344 | 35 | 100 | |||
| 合计 | 198 | 100 | 20 | 546 | 100 | 55 | 243 | 100 | 25 | 987 | 100 | 100 | |||
注:A为样本数量(人),B为该模式占该阶层所有样本的比例(%),C为该阶层占该模式所有样本的比例(%)。 |
Tab.5 Results of Logistic regression表5 Logistic回归结果汇总表 |
| 样本类型 | 自变量 | 职住近郊 | 职内住外 | |||||||||||||
|---|---|---|---|---|---|---|---|---|---|---|---|---|---|---|---|---|
| B | Sig. | B | Sig. | |||||||||||||
| 所有样本(参考类别为“中心平衡模式”,伪R2 Cox和Snell=0.350, Sig.=0.000) | 建成环境 | 就业地 | 交叉口密度 | -0.13 | 0.01** | -0.01 | 0.00** | |||||||||
| 公交站密度 | -0.36 | 0.03** | -0.07 | 0.07* | ||||||||||||
| POI种类 | -0.01 | 0.02** | 0.00 | 0.12 | ||||||||||||
| 居住地 | 道路密度 | 0.49 | 0.12 | 0.48 | 0.00** | |||||||||||
| 公交站密度 | -0.34 | 0.08* | -0.17 | 0.02** | ||||||||||||
| POI种类 | -0.02 | 0.03** | -0.01 | 0.00** | ||||||||||||
| 房屋属性 | 房屋年代 | 0.15 | 0.57 | 0.18 | 0.11 | |||||||||||
| 房屋规模 | 0.29 | 0.20 | 0.34 | 0.00** | ||||||||||||
| 邻里环境 | 邻里(成分1) | 0.04 | 0.82 | -0.10 | 0.24 | |||||||||||
| 邻里(成分2) | 0.06 | 0.74 | 0.17 | 0.03** | ||||||||||||
| 稳定性 | -0.09 | 0.67 | 0.04 | 0.66 | ||||||||||||
| 个人属性 | 社会属性 | 出生年份 | 0.00 | 0.87 | 0.00 | 0.38 | ||||||||||
| 学生人数 | 0.27 | 0.33 | 0.05 | 0.75 | ||||||||||||
| [户主] | -0.20 | 0.62 | -0.06 | 0.72 | ||||||||||||
| [非户主] | 0.00b | . | 0.00b | . | ||||||||||||
| [婚姻状况=未婚] | 14.08 | 0.00** | 15.03 | 0.00** | ||||||||||||
| [婚姻状况=已婚] | 14.99 | . | 14.99 | . | ||||||||||||
| [婚姻状况=离异或丧偶] | 0.00b | . | 0.00b | . | ||||||||||||
| 个人偏好 | [择居原因=1] | -2.46 | 0.08* | 0.36 | 0.78 | |||||||||||
| [择居原因=2] | -2.10 | 0.25 | -1.45 | 0.38 | ||||||||||||
| [择居原因=3] | -2.62 | 0.10 | 0.99 | 0.44 | ||||||||||||
| [择居原因=4] | -3.13 | 0.03** | 0.56 | 0.66 | ||||||||||||
| [择居原因=5] | -1.99 | 0.15 | 0.64 | 0.61 | ||||||||||||
| [择居原因=6] | -2.70 | 0.07* | -0.39 | 0.76 | ||||||||||||
| [择居原因=7] | -2.80 | 0.05* | -0.42 | 0.74 | ||||||||||||
| [择居原因=8] | -2.58 | 0.13 | -0.08 | 0.95 | ||||||||||||
| [择居原因=9] | -1.63 | 0.28 | 0.41 | 0.75 | ||||||||||||
| [择居原因=11] | 0.00b | . | 0.00b | . | ||||||||||||
| 无固定工作者(参考类别为“中心平衡模式”, 伪R2 Cox和Snell=0.410,Sig.=0.000) | 建成环境 | 就业地 | 交叉口密度 | -0.96 | 0.08* | 0.00 | 0.99 | |||||||||
| 公交站密度 | -1.60 | 0.09* | 0.06 | 0.55 | ||||||||||||
| POI种类 | 0.02 | 0.53 | -0.01 | 0.08* | ||||||||||||
| 居住地 | 道路密度 | -0.12 | 0.91 | 0.06 | 0.84 | |||||||||||
| 公交站密度 | 0.22 | 0.72 | 0.05 | 0.73 | ||||||||||||
| POI种类 | -0.07 | 0.10 | -0.02 | 0.02** | ||||||||||||
| 房屋属性 | 房屋年代 | -1.05 | 0.26 | 0.26 | 0.18 | |||||||||||
| 房屋面积 | 0.20 | 0.82 | 0.46 | 0.03** | ||||||||||||
| 邻里环境 | 邻里(成分1) | 0.97 | 0.14 | 0.34 | 0.16 | |||||||||||
| 邻里(成分2) | 0.13 | 0.80 | -0.15 | 0.54 | ||||||||||||
| 稳定性 | -0.79 | 0.24 | 0.07 | 0.75 | ||||||||||||
| 无固定工作者(参考类别为“中心平衡模式”, 伪R2 Cox和Snell=0.410,Sig.=0.000) | 个人属性 | 社会属性 | 出生年份 | 0.08 | 0.21 | 0.00 | 0.84 | |||||||||
| 学生人数 | 1.62 | 0.23 | 0.30 | 0.48 | ||||||||||||
| [户主] | -0.77 | 0.59 | -0.34 | 0.43 | ||||||||||||
| [非户主] | 0.00b | . | 0.00b | . | ||||||||||||
| [婚姻状况=未婚] | 21.01 | 0.99 | 16.11 | 0.00** | ||||||||||||
| [婚姻状况=已婚] | 22.69 | 0.99 | 16.73 | . | ||||||||||||
| [婚姻状况=离异或丧偶] | 0.00b | . | 0.00b | . | ||||||||||||
| 个人偏好 | [择居原因=1] | 0.00 | . | 0.00 | . | |||||||||||
| [择居原因=2] | 4.35 | 1.00 | 16.40 | 1.00 | ||||||||||||
| [择居原因=3] | 8.86 | 1.00 | 17.23 | 1.00 | ||||||||||||
| [择居原因=4] | 9.05 | 1.00 | 16.42 | 1.00 | ||||||||||||
| [择居原因=5] | 11.11 | 1.00 | 16.33 | 1.00 | ||||||||||||
| [择居原因=6] | 9.98 | 1.00 | 15.57 | 1.00 | ||||||||||||
| [择居原因=7] | 2.76 | 1.00 | 15.35 | 1.00 | ||||||||||||
| [择居原因=8] | 13.56 | 1.00 | 16.21 | 1.00 | ||||||||||||
| [择居原因=9] | -2.09 | 1.00 | 15.65 | 1.00 | ||||||||||||
| [择居原因=11] | 0.00b | . | 0.00b | . | ||||||||||||
| 体制外工薪 (参考类别为“中心平衡模式”,伪R2 Cox和Snell=0.463,Sig.=0.000) | 建成环境 | 就业地 | 交叉口密度 | -0.10 | 0.09* | -0.02 | 0.01** | |||||||||
| 公交站密度 | -0.32 | 0.24 | -0.10 | 0.10 | ||||||||||||
| POI种类 | -0.02 | 0.03** | 0.01 | 0.05* | ||||||||||||
| 居住地 | 道路密度 | 1.11 | 0.05* | 0.93 | 0.00** | |||||||||||
| 公交站密度 | -0.87 | 0.03** | -0.36 | 0.00** | ||||||||||||
| POI种类 | -0.02 | 0.09* | -0.02 | 0.00** | ||||||||||||
| 房屋属性 | 房屋年代 | 0.03 | 0.96 | 0.17 | 0.38 | |||||||||||
| 房屋面积 | 0.39 | 0.31 | 0.32 | 0.04** | ||||||||||||
| 邻里环境 | 邻里(成分1) | 0.16 | 0.53 | -0.13 | 0.28 | |||||||||||
| 邻里(成分2) | -0.22 | 0.52 | 0.21 | 0.09* | ||||||||||||
| 稳定性 | 0.06 | 0.86 | 0.20 | 0.14 | ||||||||||||
| 个人属性 | 社会属性 | 出生年份 | 0.00 | 0.98 | 0.00 | 0.44 | ||||||||||
| 学生人数 | 0.24 | 0.64 | 0.15 | 0.41 | ||||||||||||
| [户主] | 0.07 | 0.92 | 0.09 | 0.75 | ||||||||||||
| [非户主] | 0.00 | . | 0.00 | . | ||||||||||||
| [婚姻状况=未婚] | -0.63 | 0.56 | 0.36 | 0.32 | ||||||||||||
| [婚姻状况=已婚] | 0.00b | . | 0.00b | . | ||||||||||||
| [婚姻状况=离异或丧偶] | - | - | - | - | ||||||||||||
| 个人偏好 | [择居原因=1] | -3.70 | 0.05* | -0.62 | 0.70 | |||||||||||
| [择居原因=2] | -21.73 | . | -1.28 | 0.53 | ||||||||||||
| [择居原因=3] | -20.90 | 1.00 | 0.04 | 0.98 | ||||||||||||
| [择居原因=4] | -21.09 | 1.00 | 0.44 | 0.79 | ||||||||||||
| 体制外工薪 (参考类别为“中心平衡模式”,伪R2 Cox和Snell=0.463,Sig.=0.000) | [择居原因=5] | -3.51 | 0.06* | -0.14 | 0.93 | |||||||||||
| [择居原因=6] | -2.93 | 0.13 | -1.08 | 0.51 | ||||||||||||
| [择居原因=7] | -3.06 | 0.10 | -1.13 | 0.49 | ||||||||||||
| [择居原因=8] | -21.56 | 1.00 | -0.91 | 0.59 | ||||||||||||
| [择居原因=9] | -1.99 | 0.34 | -0.44 | 0.79 | ||||||||||||
| [择居原因=11] | 0.00b | . | 0.00b | . | ||||||||||||
| 体制内(参考类别为“中心平衡模式”,R2 Cox和Snell=0.453, Sig.=0.000) | 建成环境 | 就业地 | 交叉口密度 | -0.60 | 0.13 | -0.02 | 0.09* | |||||||||
| 公交站密度 | -0.16 | 0.72 | -0.05 | 0.59 | ||||||||||||
| POI种类 | 0.00 | 1.00 | 0.00 | 0.61 | ||||||||||||
| 居住地 | 道路密度 | 0.50 | 0.70 | -0.19 | 0.64 | |||||||||||
| 公交站密度 | -0.65 | 0.40 | -0.11 | 0.53 | ||||||||||||
| POI种类 | 0.00 | 0.94 | 0.00 | 0.44 | ||||||||||||
| 房屋属性 | 房屋年代 | 1.19 | 0.29 | -0.33 | 0.23 | |||||||||||
| 房屋面积 | -0.91 | 0.34 | 0.19 | 0.45 | ||||||||||||
| 邻里环境 | 邻里(成分1) | -0.99 | 0.22 | -0.72 | 0.00** | |||||||||||
| 邻里(成分2) | 0.01 | 0.99 | 0.31 | 0.06* | ||||||||||||
| 稳定性 | -0.51 | 0.42 | -0.08 | 0.70 | ||||||||||||
| 个人属性 | 社会属性 | 出生年份 | 0.01 | 0.84 | 0.05 | 0.03** | ||||||||||
| 学生人数 | -2.77 | 0.09* | -1.00 | 0.01** | ||||||||||||
| [户主] | -0.81 | 0.68 | -0.12 | 0.78 | ||||||||||||
| [非户主] | 0.00b | . | 0.00b | . | ||||||||||||
| [婚姻状况=未婚] | -6.42 | 0.04** | -1.32 | 0.04** | ||||||||||||
| [婚姻状况=已婚] | 0.00b | . | 0.00b | . | ||||||||||||
| [婚姻状况=离异或丧偶] | - | - | - | - | ||||||||||||
| 个人偏好 | [择居原因=1] | 0.47 | 0.84 | 0.56 | 0.46 | |||||||||||
| [择居原因=2] | 2.52 | 0.44 | -20.87 | . | ||||||||||||
| [择居原因=3] | 0.62 | 0.84 | 0.26 | 0.72 | ||||||||||||
| [择居原因=4] | -1.00 | 0.67 | -1.40 | 0.06* | ||||||||||||
| [择居原因=5] | -0.54 | 0.85 | -0.37 | 0.59 | ||||||||||||
| [择居原因=6] | -18.95 | 1.00 | -1.33 | 0.09* | ||||||||||||
| [择居原因=7] | -17.13 | 1.00 | -1.03 | 0.18 | ||||||||||||
| [择居原因=8] | -19.52 | . | -1.11 | 0.27 | ||||||||||||
| [择居原因=9] | 0.00b | . | 0.00b | . | ||||||||||||
| [择居原因=11] | - | - | - | - | ||||||||||||
注:邻里成分1包括小区人们能互相帮助、值得信任、能互相打招呼、能共同处理问题的程度;邻里成分2包括同小区的亲人数量和打招呼人数。择居原因=1为价格便宜;2为拆迁安置;3为福利分房;4为上班方便;5为设施完善,生活便利;6为交通方便;7为安全;8为想买房;9为结婚;10为生孩子;11为子女上学。Sig.<0.05为十分显著,用**表示;Sig.小于0.1为显著,用*表示。b:因为此参数冗余,所以将其设为零。“-”表示没有此类型的样本。 |
Fig. 2 The mechanism of job-housing decision图2 各阶层人群职住决策机制分析图 |
The authors have declared that no competing interests exist.
| [1] |
[
|
| [2] |
|
| [3] |
|
| [4] |
[
|
| [5] |
|
| [6] |
|
| [7] |
|
| [8] |
[
|
| [9] |
[
|
| [10] |
[
|
| [11] |
|
| [12] |
|
| [13] |
[
|
| [14] |
[
|
| [15] |
[
|
| [16] |
|
| [17] |
[
|
| [18] |
[
|
| [19] |
|
| [20] |
|
| [21] |
[
|
| [22] |
|
| [23] |
|
| [24] |
[
|
| [25] |
[
|
| [26] |
[
|
| [27] |
[
|
| [28] |
[
|
| [29] |
[
|
| [30] |
[
|
| [31] |
[
|
/
| 〈 |
|
〉 |