
基于VIIRS夜间灯光的中国城市中心的分异特征及其影响因素
作者简介:罗庆(1981- ),男,四川合江人,博士,副教授,研究方向为城乡发展、新经济地理学。E-mail: luoqing518@163.com
收稿日期: 2018-06-14
要求修回日期: 2018-11-15
网络出版日期: 2019-01-20
基金资助
国家自然科学基金项目(41771141,41471117)
教育部人文社会科学重点研究基地重大项目(16JJD7 70021)
河南省哲学社会科学规划项目(2017BJJ005)
The spatial differentiation and influencing factors of urban centers in China based on VIIRS night light
Received date: 2018-06-14
Request revised date: 2018-11-15
Online published: 2019-01-20
Copyright
城市多中心是现代城市发展的重要趋势,精准识别城市中心和理解城市中心形成机制对推进以人为核心的新型城镇化具有十分重要的意义。基于VIIRS夜间灯光数据设计出城市中心识别方法,对全国286个地级以上城市的城市中心进行识别,从城市中心数和中心发展的均衡度两个方面对城市中心的分异特征及影响因素进行分析。结果表明:① 在全国286个城市中识别出181个多中心城市,所识别的城市中心与城市规划中心具有很大程度一致性,识别结果具有一定的可靠性。② 城市中心数表现为“东多西少”的空间格局,并随城市规模等级的增加呈现“S”型递增趋势。③ 城市中心发展的均衡度呈现“东高西低”的空间格局,并随城市规模等级的增加呈现稳定递增,到特大型城市基本保持稳定。④ 河流对市区的分割、市区是否临海以及市区平地占比等自然地理因素对城市中心发展具有影响,但是社会经济因素影响更大;社会经济因素中,轨道交通站点数、市辖区人口数、城市规模等级、地区生产总值、第三产业占地区生产总值比例、固定资产投资对城市中心发展具有显著影响。
罗庆 , 李小建 . 基于VIIRS夜间灯光的中国城市中心的分异特征及其影响因素[J]. 地理研究, 2019 , 38(1) : 155 -166 . DOI: 10.11821/dlyj020180467
A polycentric city is an important trend in the development of modern cities. Identifying accurate urban centers and understanding formation mechanism of urban center are of great significance to promoting the new urbanization with the people-oriented idea. Based on the VIIRS night lighting data, the paper designs the identification method of the urban center, identifies the urban center of 286 prefecture-level cities, and analyzes the differentiation characteristics and influencing factors of the urban center from the number and the centrality index. The results show that: (1) The 181 polycentric cities have been identified in 286 cities throughout the country, the identified urban center is in great agreement with the urban planning center, and the results have a certain reliability. (2) The urban center number presents the spatial pattern of more in the east and less in the west, and presents the "S" type increasing trend with the increase of the city scale. (3) The equilibrium index shows the spatial pattern of high in the east and low in the west, suggesting a steady increase with the increase of the scale of the city and remain stable until a megalopolis forms. (4) Natural geographical factors such as the segmentation of the rivers, the adjacency of the sea and the proportion of the flat land have influence on the development of the city center, but the social and economic factors has more impact on this process. Social and economic factors, the number of rail transit station, city population, city scale, GRP, proportion of third industries and investment in fixed assets have a significant impact on the polycentric development.
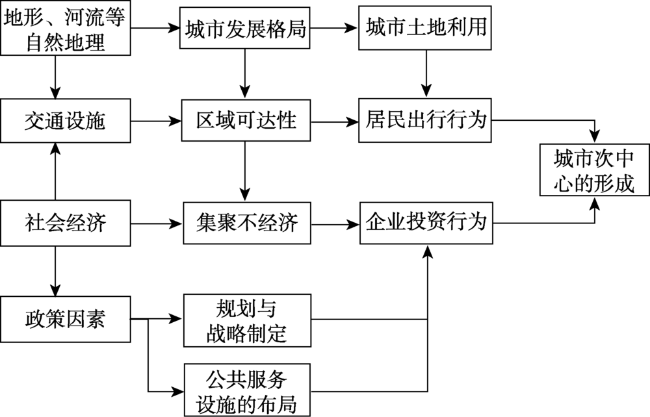
Fig. 1 The impact mechanism of urban polycentric development图1 城市多中心发展的影响机理 |
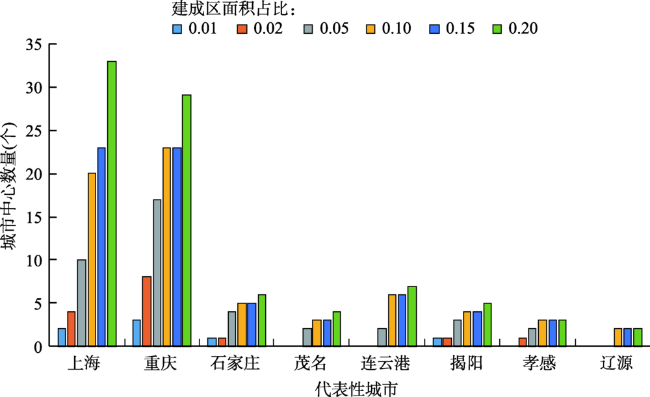
Fig. 2 The sensitivity analysis of urban center extraction图2 城市中心提取的敏感性分析 |
Tab. 1 The descriptive statistics of variables表1 各变量的描述性统计 |
| 变量 | 样本数 | 平均值 | 标准差 | 最小值 | 最大值 | |
|---|---|---|---|---|---|---|
| 被解释变量 | 城市中心数(个) | 286 | 2.95 | 3.25 | 0.00 | 22.00 |
| 中心均衡度指数 | 278 | 0.40 | 0.34 | 0.00 | 0.97 | |
| 解释变量 | ||||||
| 自然地理因素 | 河流分割市区数(块) | 286 | 0.93 | 1.37 | 0.00 | 8.00 |
| 市区是否临海(是=1,否=0) | 286 | 0.18 | 0.38 | 0.00 | 1.00 | |
| 6度以下面积占市区面积比例(%) | 286 | 76.64 | 23.81 | 9.45 | 100.00 | |
| 公共交通设施 | 公共汽车数(万辆) | 286 | 0.16 | 0.33 | 0.00 | 3.17 |
| 地铁站数(个) | 286 | 7.82 | 36.81 | 0.00 | 375.00 | |
| 规模因素 | 市区常住人口数(万人) | 286 | 153.93 | 201.59 | 15.32 | 2126.65 |
| 城市等级(Ⅱ型小城市=1,Ⅱ型小城市=2,依次类推,超大城市=7) | 286 | 2.97 | 1.24 | 1.00 | 7.00 | |
| 经济因素 | 市区生产总值(亿元) | 286 | 1464.63 | 3032.99 | 30.17 | 24838.37 |
| 第三产业占生产总值比例(%) | 286 | 46.71 | 10.94 | 22.36 | 79.65 | |
| 政府干预 | 固定资产投资(亿元) | 285 | 960.84 | 1518.85 | 52.40 | 13048.00 |
| 建成区形状指数 | 286 | 3.32 | 1.46 | 0.88 | 11.98 |
注:城市等级根据2014年国务院的市区常住人口标准,划分为七档:超大城市(1000万以上)、特大城市(500万~1000万)、Ⅰ型大城市(300万~500万)、Ⅱ型大城市(100万~300万)、中等城市(50万~100万)、Ⅰ型小城市(20万~50万)、Ⅱ型小城市(20万以下);建成区形状指数计算公式:,式中:S为形状指数;P为建成区周长;A为建成区面积。 |
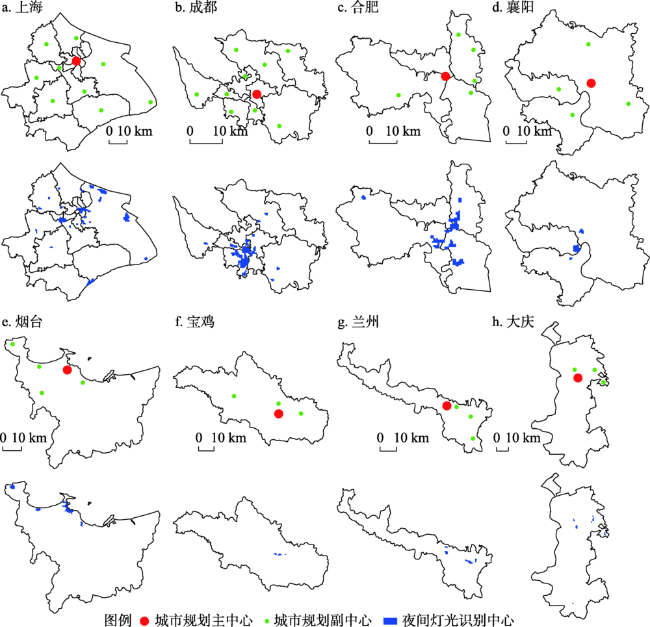
Fig. 3 Comparison between night light identification center with city planning center图3 夜间灯光识别中心与城市规划中心对比 |
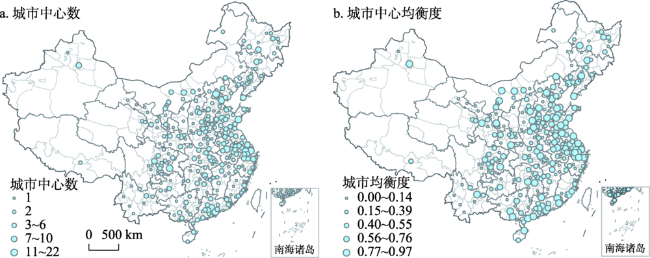
Fig. 4 The spatial distribution of central number and equilibrium index of China's cities图4 中国城市中心数和均衡度指数的空间分布图 |
Tab. 2 Central index statistics in eastern, central, western and northeastern China表2 东、中、西和东北地区城市中心发展指标统计 |
| 地区 | 东部 | 中部 | 西部 | 东北 | ||||||||
|---|---|---|---|---|---|---|---|---|---|---|---|---|
| 规模等级 | 中心数(个) | 均衡度指数 | 中心数(个) | 均衡度指数 | 中心数(个) | 均衡度指数 | 中心数(个) | 均衡度指数 | ||||
| 超大城市 | 18 | 0.86 | — | — | 21 | 0.85 | — | — | ||||
| 特大城市 | 17.33 | 0.86 | — | — | — | — | — | — | ||||
| Ⅰ型大城市 | 8.50 | 0.75 | 8.25 | 0.68 | 7.33 | 0.76 | 8.00 | 0.71 | ||||
| Ⅱ型大城市 | 4.88 | 0.67 | 4.00 | 0.56 | 4.27 | 0.62 | 3.75 | 0.61 | ||||
| 中型城市 | 2.76 | 0.53 | 2.00 | 0.39 | 2.00 | 0.36 | 1.62 | 0.26 | ||||
| Ⅰ型小城市 | 1.71 | 0.30 | 1.56 | 0.24 | 1.41 | 0.19 | 1.38 | 0.18 | ||||
| Ⅱ型小城市 | 1.00 | 0 | — | — | 0.75 | 0 | 0 | 0 | ||||
| 合计 | 4.14 | 0.53 | 2.38 | 0.35 | 2.24 | 0.28 | 2.63 | 0.34 | ||||
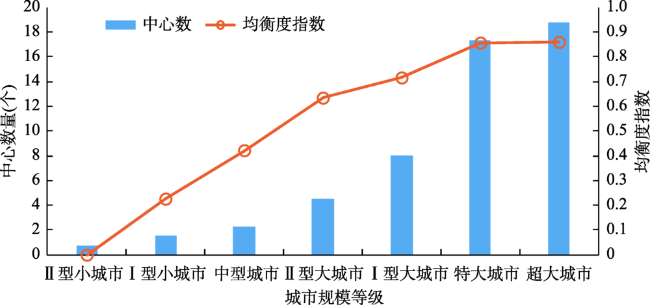
Fig. 5 Relationship between urban scale and urban center number and equilibrium index图5 城市规模等级与城市中心数、均衡度指数关系 |
Tab. 3 Analysis of factors influencing on the development of urban center表3 城市中心发展的影响因素分析 |
| CN | EI | ||||||
|---|---|---|---|---|---|---|---|
| 自变量 | 模型1 | 模型2 | 模型3 | 模型4 | 模型5 | 模型6 | |
| 是否邻近河流 | 0.706*** | -0.035 | 0.057*** | 0.006 | |||
| (0.131) | (0.052) | (0.014) | (0.008) | ||||
| 是否临海 | 1.869*** | -0.020 | 0.149*** | 0.027 | |||
| (0.466) | (0.184) | (0.050) | (0.028) | ||||
| 市区平地比重 | 0.017** | 0.001 | 0.002*** | 0.001 | |||
| (0.008) | (0.003) | (0.001) | (0.000) | ||||
| 公共交通车辆数 | 0.443 | 0.419 | 0.083 | 0.086 | |||
| (0.395) | (0.399) | (0.060) | (0.060) | ||||
| 地铁站数 | -0.013** | -0.013*** | -0.002** | -0.001** | |||
| (0.005) | (0.005) | (0.001) | (0.001) | ||||
| 市辖区人口数 | 0.172** | 0.170* | -0.006 | -0.004 | |||
| (0.087) | (0.088) | (0.013) | (0.013) | ||||
| 城市等级 | 0.266*** | 0.266*** | 0.113*** | 0.112*** | |||
| (0.030) | (0.031) | (0.005) | (0.005) | ||||
| 市辖区GRP | 0.073*** | 0.074*** | 0.004*** | 0.004** | |||
| (0.010) | (0.010) | (0.001) | (0.002) | ||||
| 第三产业比例 | 0.017*** | 0.017*** | 0.002** | 0.003*** | |||
| (0.006) | (0.006) | (0.001) | (0.001) | ||||
| 固定资产投资 | 0.045*** | 0.046*** | 0.004** | 0.004** | |||
| (0.012) | (0.013) | (0.002) | (0.002) | ||||
| 建成区形状 | 0.062 | 0.061 | 0.005 | 0.003 | |||
| (0.075) | (0.078) | (0.012) | (0.012) | ||||
| Constant | 0.630 | -0.525 | -0.545 | 0.126* | -0.138** | -0.187*** | |
| (0.630) | (0.372) | (0.464) | (0.070) | (0.058) | (0.071) | ||
| Observations | 286 | 285 | 285 | 278 | 277 | 277 | |
| R-squared | 0.151 | 0.892 | 0.892 | 0.113 | 0.769 | 0.771 | |
注:(1)括号中报告的为标准误;(2)***、**、*分别表示在1%、5%和10%水平上显著;(3)为便于解释,回归模型中市辖区人口数、市辖区GRP和固定资产投资的单位分别采用百万人、百亿元和百亿元。 |
The authors have declared that no competing interests exist.
| [1] |
|
| [2] |
[
|
| [3] |
[
|
| [4] |
[
|
| [5] |
|
| [6] |
|
| [7] |
|
| [8] |
|
| [9] |
|
| [10] |
[
|
| [11] |
[
|
| [12] |
[
|
| [13] |
[
|
| [14] |
|
| [15] |
|
| [16] |
|
| [17] |
[
|
| [18] |
[
|
| [19] |
[
|
| [20] |
|
| [21] |
[
|
| [22] |
|
| [23] |
|
| [24] |
[
|
| [25] |
|
| [26] |
[
|
| [27] |
|
/
| 〈 |
|
〉 |