
基于卫星遥感数据的森林病虫害监测与评价
作者简介:郭仲伟(1987-),男,河北石家庄人,硕士,研究方向为全球变化遥感。E-mail:guozw@radi.ac.cn
收稿日期: 2018-04-01
要求修回日期: 2018-06-01
网络出版日期: 2019-04-20
基金资助
国家自然科学基金项目(41371013,41522109)
Forest insect-disease monitoring and estimation based on satellite remote sensing data
Received date: 2018-04-01
Request revised date: 2018-06-01
Online published: 2019-04-20
Copyright
森林病虫害由于在森林资源中造成的重大破坏而被人们称为“不冒烟的火灾”,其对生态系统的研究具有重要意义。现有基于遥感数据的病虫害研究多集中在森林病虫害的监测、爆发原因以及发病区域内生产力的变化情况,而对于森林病虫害发生后森林中植被指数与叶面积指数之间的相关性的变化情况还相对较少,处于需要持续性深入探讨的阶段。以加拿大不列颠哥伦比亚地区2002—2012年森林病虫害数据为基础,分析不同严重程度的病虫害对叶面积指数(LAI)与归一化植被指数(NDVI)和增强型植被指数(EVI)的影响。结果表明:① 受病虫害感染的像元在轻度(Light)、中度(Moderate)和重度(Severe)三个严重级别中,NDVI与LAI之间的相关性由弱变强,又由强变弱;② EVI与LAI之间的相关性,在轻度(Light)、中度(Moderate)和重度(Severe)三个严重级别的像元中则依次变强。这一研究将为今后利用遥感数据识别病虫害、评价生态系统影响提供基础。
关键词: 森林病虫害; 归一化植被指数NDVI; 增强型植被指数EVI; 叶面积指数LAI; 相关性
郭仲伟 , 吴朝阳 , 汪箫悦 . 基于卫星遥感数据的森林病虫害监测与评价[J]. 地理研究, 2019 , 38(4) : 831 -843 . DOI: 10.11821/dlyj020180299
Forest insect has been known as the "Fire without Smoke" due to their major damages to forest resources. Therefore it is of great significance for research on ecosystem safety. Current remote sensing based monitoring of forest insect outbreak mainly focuses on its distributions, reasons and consequent influences on productivity. Using insect outbreak data acquired at British Colombia in Canada over 2002-2012, we here provide an analysis of the impacts of insect intensity on relationship between leaf area index (LAI) and the normalized difference vegetation index (NDVI) and the enhanced vegetation index (EVI). We showed that for pixels converting from light to moderate and from moderate to severe, correlations between LAI and NDVI became higher first, then lower evidently and correlations between LAI and EVI became higher consistently. Furthermore, for severely-affected regions, the correlation became stronger. Our results provide a good reference for the future assessment of insect damage on ecosystem function using remote sensing observations.
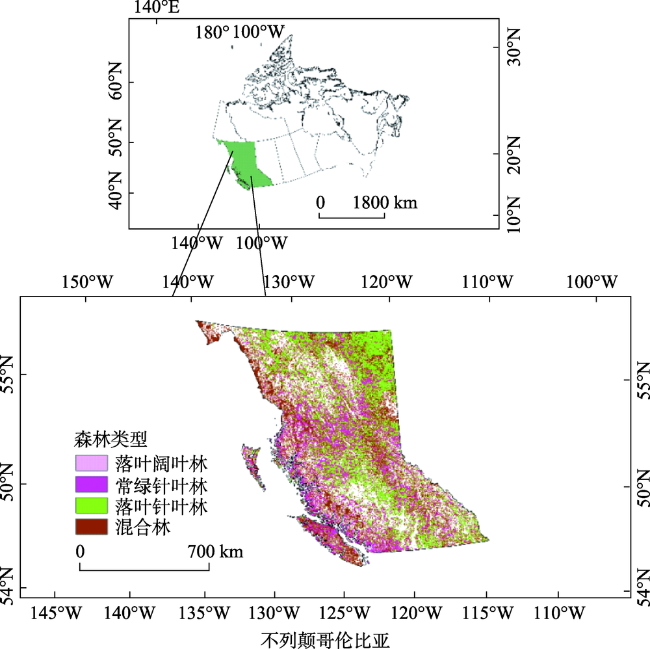
Fig. 1 Research area in British Colombia, Canada图1 加拿大不列颠哥伦比亚省研究区域 |
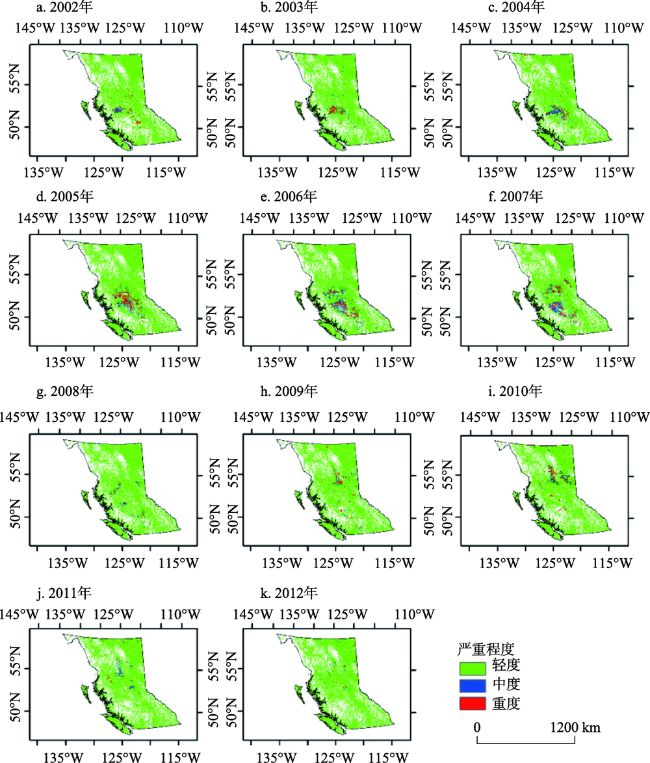
Fig. 3 The distribution of insect diseaster-affected areas from 2002 to 2012图3 2002—2012年间病虫害发病区域分布 |
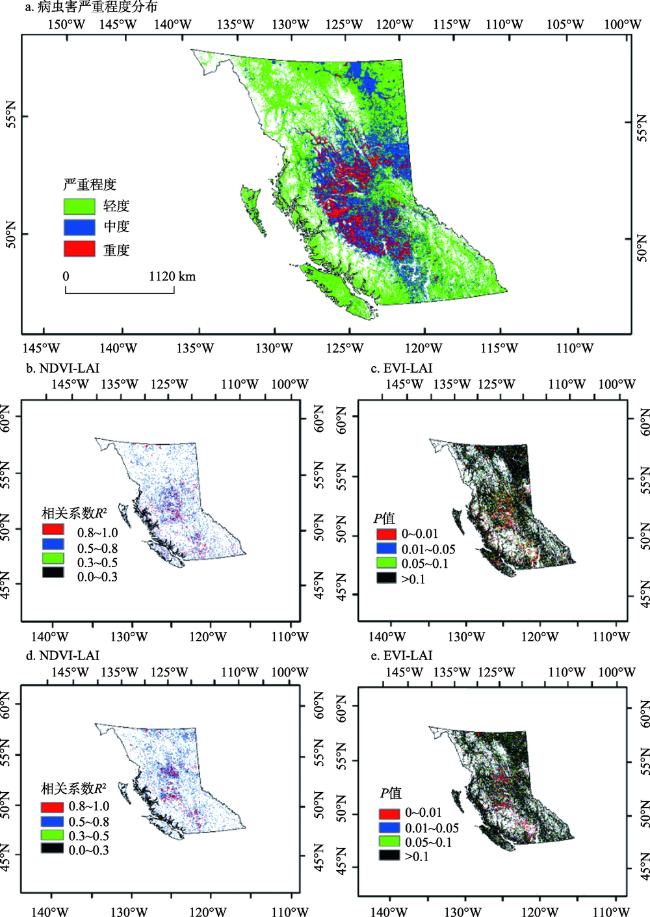
Fig. 4 Distribution of correlation between NDVI, EVI and LAI图4 NDVI、EVI与LAI相关性空间分布 |
Tab. 2 Pixel quantities in different groups表2 各组像元数量与百分比 |
| 相关程度 | 相关关系 | |||||
|---|---|---|---|---|---|---|
| 强相关 | 中等相关 | 弱相关 | 不相关 | 合计 | ||
| NDVI与LAI相关性 | 数量 | 111659 | 102501 | 71344 | 593279 | 878783 |
| 百分比(%) | 12.7 | 11.7 | 8.1 | 67.5 | 100 | |
| EVI与LAI相关性 | 数量 | 94148 | 102491 | 75372 | 606750 | 878761 |
| 百分比(%) | 10.7 | 11.7 | 8.6 | 69 | 100 | |
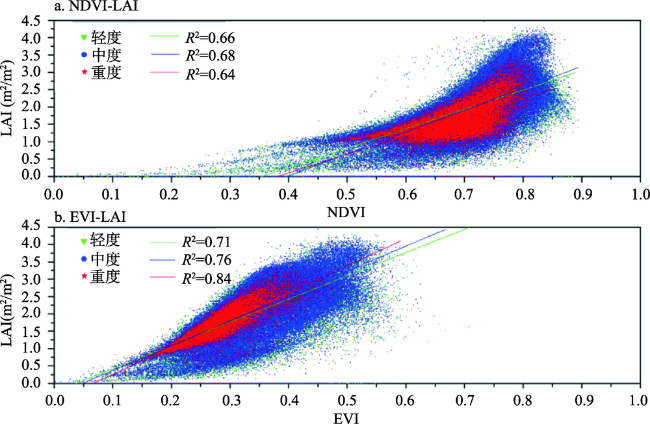
Fig. 5 Scatter map of correlation between NDVI, EVI and LAI图5 NDVI、EVI与LAI相关性散点图 |
Tab. 3 The fitting curves functions of vegetation and LAI表3 植被指数与叶面积指数拟合曲线 |
| 相关性 | 轻度(Light) | 中度(Moderate) | 重度(Severe) |
|---|---|---|---|
| NDVI和LAI | y=55.9x-19.8 | y=63.1x-25.1 | y=53.7x-20.5 |
| EVI和LAI | y=67.0x-2.5 | y=71.7x-3.5 | y=78.3x-5.2 |
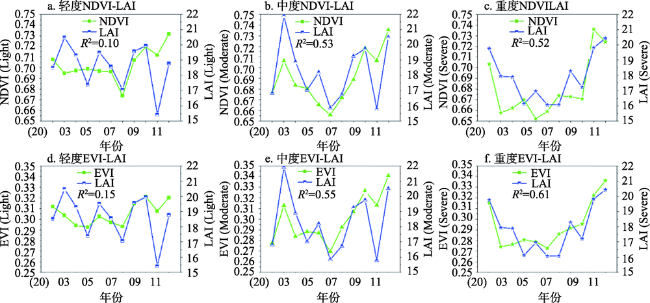
Fig. 6 Average line-scatter map of NDVI, EVI and LAI图6 NDVI、EVI与LAI平均值折线-散点图 |
The authors have declared that no competing interests exist.
| [1] |
|
| [2] |
[
|
| [3] |
[
|
| [4] |
[
|
| [5] |
|
| [6] |
|
| [7] |
|
| [8] |
|
| [9] |
|
| [10] |
|
| [11] |
[
|
| [12] |
[
|
| [13] |
[
|
| [14] |
|
| [15] |
[
|
| [16] |
|
| [17] |
|
| [18] |
|
| [19] |
|
| [20] |
|
| [21] |
|
| [22] |
[
|
| [23] |
|
| [24] |
|
| [25] |
|
| [26] |
|
| [27] |
|
| [28] |
|
| [29] |
|
| [30] |
|
| [31] |
|
| [32] |
|
| [33] |
|
| [34] |
[
|
| [35] |
[
|
| [36] |
|
| [37] |
[
|
| [38] |
|
| [39] |
|
| [40] |
[
|
| [41] |
[
|
| [42] |
[
|
| [43] |
[
|
/
| 〈 |
|
〉 |