
建成环境对城市居民日常出行碳排放的影响——以开封市248个居住区为例
作者简介:荣培君(1986-),女,河南开封人,博士,讲师,主要研究方向为区域可持续发展。 E-mail: rongpeijun@126.com
收稿日期: 2019-01-29
要求修回日期: 2019-05-06
网络出版日期: 2019-06-12
基金资助
国家自然科学基金项目(41671536)
国家社会科学基金项目(17BJL065)
中国博士后科学基金面上项目(2017M622333)
河南省科技厅软科学项目(41901588)
Impact of built environment on carbon emissions from daily travel of urban residents: A case study of 248 residential areas in Kaifeng
Received date: 2019-01-29
Request revised date: 2019-05-06
Online published: 2019-06-12
Copyright
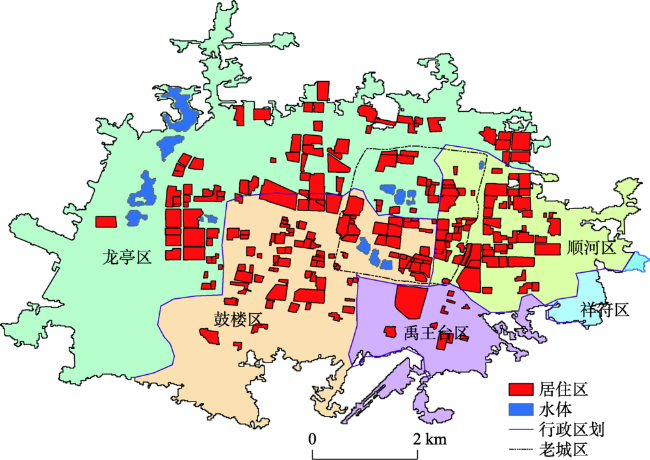
居住区是居民日常生活最基本的空间单元,其建成环境对出行碳排放的影响是学术界关注的焦点。基于大样本调查数据核算居民各类出行碳排放,通过POI抓取、空间句法、网络分析等方法识别开封市主城区成规模的248个居住区的建成环境特征,借助核密度和GWR等方法剖析居住区尺度居民各类出行碳排放的空间分异规律。结果表明:① 城市内部居民出行碳排放空间差异显著,居住区公共服务供给的公平性问题突出,外圈层快速扩张区域应作为城市碳减排工作的关键区域;② 居住区尺度能较好地揭示建成环境对出行碳排放的影响,路网设计、建筑密度、土地利用混合度等因素对各类出行碳排放的作用机理差异较大,作用强度亦存在不同方向上的空间渐进规律;③ 根据出行碳排放结构及其对应的建成环境指标可识别出外层高密度欠通达低混合型居住区碳排放水平较高,内层低密度高通达高混合型居住区碳排放水平较低。研究结果可为居住区空间重构和城市碳排放的分区规划与治理提供科学依据。
荣培君 , 张丽君 , 秦耀辰 , 李阳 , 郑智成 . 建成环境对城市居民日常出行碳排放的影响——以开封市248个居住区为例[J]. 地理研究, 2019 , 38(6) : 1464 -1480 . DOI: 10.11821/dlyj020190096
Residential area is the most basic unit of residential daily life, and the impact of its built environment on daily travel carbon emissions is a major concern within academic field. We accounted all kinds of carbon emissions from residential daily travel based on a large number of sample questionnaire data, identified the built environment characteristics of 248 residential areas in the main urban area of Kaifeng city by POI capture, network analysis, spatial syntax and other methods, and analyzed the spatial distribution and the differentiation mechanism of carbon emissions of various types of residents in residential areas by means of nuclear density and GWR. The results show that: (1) There is a significant spatial difference in urban residents' travel carbon emissions, and there is a great difference in the fairness of public service supply in residential areas. (2) The study in residential area scale can better reveal the impact of built environment on travel carbon emissions. Location, accessibility, road network design, building density and land use mix degree, etc. have significant impacts on the residential daily travel carbon emissions. However, for different travel purposes, the impacts of these factors are quite different. What's more, there is a spatial asymptotic difference in the impact intensity in different directions. (3) According to the carbon emission grade combination of various purposes and corresponding built environment indexes, it can be identified that the carbon emission level of outer high-density under-accessible low-mixed residential areas is of high emissions, and that of inner low-density high-accessible high-mixed residential areas is of low emissions. The results can provide a scientific basis for the spatial reconstruction of residential areas and the zoning planning and governance of urban carbon emissions.
Fig. 1 Spatial distribution of samples图1 样本居住区空间分布 |
Tab. 1 Classification of POI species involved in this study表1 本研究涉及到的POI种类划分 |
| 一级分类 | 二级分类 | 具体内容 |
|---|---|---|
| 公共管理服务设施 | 教育服务 | 幼儿园、小学、初中、高中 |
| 交通设施 | 公交站点 | |
| 商业服务设施 | 娱乐设施 | 景区、KTV、城市公园、游乐场 |
| 餐饮购物 | 各类餐厅、星级酒店、超级市场、购物中心、副食店、菜市场 | |
| 生活服务 | 汽车服务、家政服务、报刊亭、物流点、洗衣店、摄影店、健身房洗浴中心等 |
Tab. 2 Comparison of basic attributes of residential areas in new and old areas表2 新老区居住区基本属性对比 |
| 指标 | 分类 | 老城区(%) | 新城区(%) | 指标 | 分类 | 老城区(%) | 新城区(%) |
|---|---|---|---|---|---|---|---|
| 住房类型 | 商品房 | 23.0 | 51.1 | 平均楼层(层) | ≤ 3 | 32.0 | 9.0 |
| 单位集资房 | 9.9 | 17.0 | 4~6 | 59.2 | 62.9 | ||
| 经济适用房 | 1.4 | 8.4 | 7~11 | 9.9 | 14.0 | ||
| 私人自建房 | 64.8 | 18.5 | ≥ 12 | 0.0 | 14.0 | ||
| 拆迁安置房 | 0.0 | 4.9 | 建造年代(年) | 1980以前 | 4.2 | 2.2 | |
| 建筑面积 | 50~100 | 54.9 | 26.4 | 1981—1990 | 23.9 | 7.9 | |
| 100~150 | 36.6 | 59.0 | 1991—2000 | 45.1 | 39.3 | ||
| 150~200 | 8.5 | 8.4 | 2001—2010 | 25.3 | 39.9 | ||
| 200以上 | 0.0 | 6.2 | 2010以后 | 1.4 | 10.7 | ||
| 家庭月收入(元) | ≤ 3000 | 14.1 | 1.7 | 小汽车拥有量(辆) | ≤ 0.5 | 56.3 | 21.9 |
| 3000~6000 | 49.3 | 27.5 | 0.5~1 | 35.2 | 61.8 | ||
| 6000~9000 | 26.6 | 57.3 | 1~1.5 | 7.1 | 11.2 | ||
| 9000~12000 | 7.0 | 13.5 | 1.5~2 | 1.4 | 5.1 |
注:若一个小区是商品房和拆迁安置房混合,因房价受到一定影响,因此该小区认定为拆迁安置房小区。 |
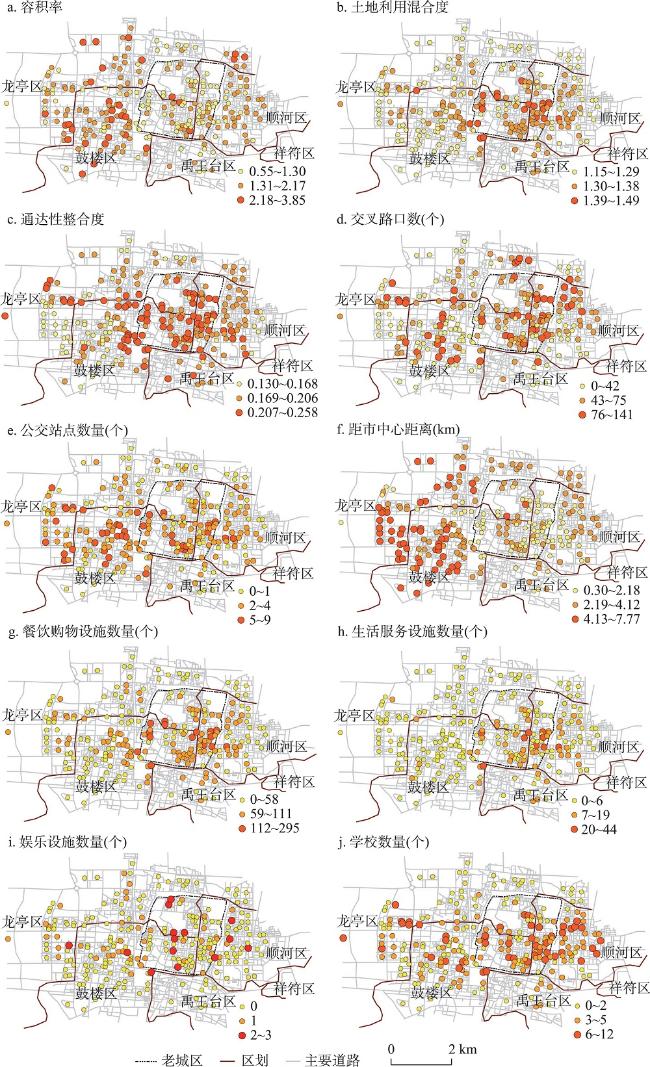
Fig. 2 Spatial distribution of built environment index of residential area图2 居住区建成环境指标的空间分布 |
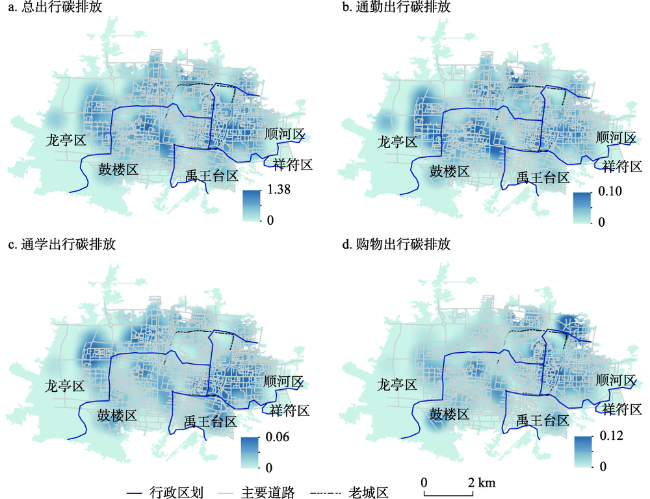
Fig. 3 Kernel density distribution of residential carbon emissions in Kaifeng图3 开封市居住区出行碳排放的核密度分布 |
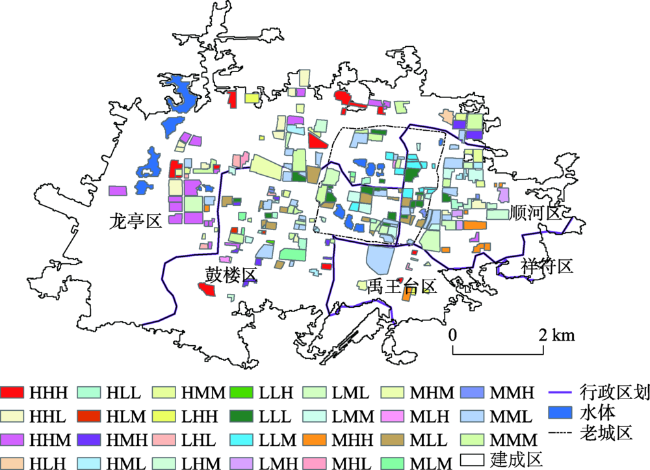
Fig. 4 Spatial distribution of travel carbon emission structure types图4 出行碳排放结构类型空间分布 |
Tab. 3 Built environment characteristics of carbon emission structure with different types of residential travel表3 不同出行碳排放结构类型居住区的建成环境特征 |
| 碳排放 结构类别 | 容积率 | 离市中心 距离(km) | 通达性 整合度 | 周边交叉 路口(个) | 周边公交 站点(个) | 周边学校(个) | 周边餐饮购 物设施(个) | 土地利用 混合度 |
|---|---|---|---|---|---|---|---|---|
| HHH | 2.96 | 6.96 | 0.13 | 18.29 | 0.96 | 1.33 | 19.95 | 1.17 |
| HHM | 2.53 | 5.20 | 0.15 | 27.60 | 0.86 | 2.23 | 35.21 | 1.27 |
| HHL | 2.54 | 5.56 | 0.13 | 24.36 | 1.23 | 3.02 | 55.63 | 1.18 |
| HMH | 2.43 | 5.31 | 0.14 | 45.16 | 0.96 | 4.05 | 22.21 | 1.18 |
| HML | 2.09 | 4.53 | 0.15 | 56.32 | 1.96 | 4.16 | 68.32 | 1.36 |
| HLH | 1.89 | 5.36 | 0.15 | 42.36 | 2.58 | 6.93 | 29.65 | 1.20 |
| HLM | 1.95 | 5.11 | 0.16 | 62.45 | 3.26 | 5.35 | 35.16 | 1.26 |
| HLL | 1.56 | 4.95 | 0.14 | 57.13 | 3.75 | 6.87 | 75.28 | 1.39 |
| MHH | 1.73 | 3.68 | 0.17 | 30.36 | 1.34 | 2.05 | 17.36 | 1.19 |
| MHM | 1.62 | 4.65 | 0.19 | 28.52 | 3.65 | 2.16 | 34.26 | 1.23 |
| MHL | 1.35 | 3.96 | 0.19 | 50.45 | 2.96 | 1.95 | 40.26 | 1.30 |
| MMH | 1.63 | 4.87 | 0.18 | 19.93 | 2.65 | 4.13 | 36.63 | 1.20 |
| MMM | 1.52 | 4.52 | 0.20 | 46.52 | 3.17 | 5.12 | 35.11 | 1.26 |
| MML | 1.46 | 3.56 | 0.17 | 49.35 | 4.06 | 6.02 | 70.03 | 1.38 |
| MLH | 1.53 | 3.95 | 0.21 | 51.23 | 3.12 | 3.06 | 42.69 | 1.21 |
| MLM | 1.42 | 4.90 | 0.20 | 50.63 | 2.58 | 3.58 | 34.36 | 1.32 |
| MLL | 1.46 | 3.68 | 0.19 | 69.11 | 3.95 | 4.06 | 69.84 | 1.35 |
| LHH | 0.96 | 2.19 | 0.24 | 39.42 | 1.02 | 2.06 | 44.33 | 1.34 |
| LHM | 1.09 | 2.08 | 0.23 | 40.26 | 2.69 | 1.95 | 23.63 | 1.27 |
| LHL | 1.21 | 2.36 | 0.26 | 70.42 | 2.35 | 2.22 | 71.36 | 1.44 |
| LMH | 1.05 | 2.05 | 0.23 | 55.26 | 3.06 | 2.16 | 39.96 | 1.20 |
| LMM | 1.07 | 1.85 | 0.25 | 53.36 | 4.27 | 2.04 | 34.12 | 1.25 |
| LML | 1.15 | 1.09 | 0.24 | 73.56 | 3.89 | 1.66 | 61.39 | 1.45 |
| LLH | 1.18 | 2.23 | 0.23 | 85.28 | 4.62 | 6.92 | 21.96 | 1.20 |
| LLM | 0.93 | 1.84 | 0.24 | 78.34 | 4.35 | 7.23 | 33.98 | 1.34 |
| LLL | 0.95 | 1.95 | 0.22 | 79.49 | 4.02 | 7.12 | 72.13 | 1.48 |
Tab. 4 Regression results of residential daily travel carbon emissions表4 居民日常出行碳排放的回归结果 |
| 影响因素 | 模型 I | 模型II | |||||||||
|---|---|---|---|---|---|---|---|---|---|---|---|
| 总出行 | 通勤 | 通学 | 购物 | 休闲 | 总出行 | 通勤 | 通学 | 购物 | 休闲 | ||
| 家庭月收入 | - | - | 0.051 | - | - | - | - | 0.062 | - | - | |
| 建造年代 | 0.123 | 0.109 | - | - | 0.081 | 0.106 | 0.101 | - | - | 0.083 | |
| 家庭小汽车拥有量 | 0.074 | 0.095 | 0.037 | 0.060 | 0.052 | 0.083 | 0.076 | 0.043 | 0.056 | 0.054 | |
| 户主年龄 | -0.133 | -0.075 | -0.071 | -0.099 | -0.076 | -0.106 | -0.083 | -0.065 | -0.102 | -0.079 | |
| 户主学历 | - | 0.099 | - | - | 0.106 | - | 0.085 | - | - | 0.098 | |
| 距市中心距离 | 0.008 | 0.222 | - | 0.042 | -0.156 | ||||||
| 居住密度 | -0.048 | - | - | - | -0.073 | ||||||
| 通达性 | - | -0.056 | - | - | - | ||||||
| 交叉路口数 | -0.142 | -0.062 | -0.046 | - | -0.147 | ||||||
| 公交站点密度 | -0.108 | - | - | - | - | ||||||
| 土地利用混合度 | -0.106 | - | - | - | - | ||||||
| 餐饮购物设施密度 | - | - | - | -0.213 | - | ||||||
| 娱乐设施密度 | - | - | - | - | -0.164 | ||||||
| 教育设施密度 | -0.043 | - | -0.151 | - | -0.072 | ||||||
| R2 | 0.259 | 0.247 | 0.135 | 0.142 | 0.198 | 0.716 | 0.711 | 0.580 | 0.693 | 0.535 | |
注:“-”表示未通过5%置信水平下的显著性检验。 |
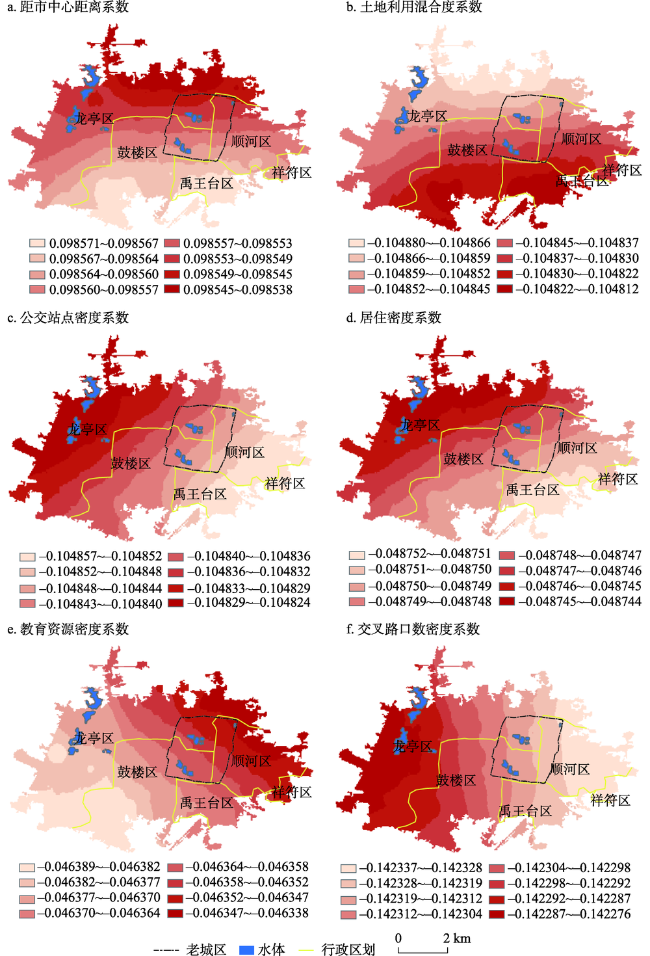
Fig. 5 Spatial distribution of regression coefficient of influence factors on built environment in the GWR model of residential travel carbon emissions图5 居民出行碳排放建成环境效应的GWR参数估计空间分布 |
The authors have declared that no competing interests exist.
| [1] |
[
|
| [2] |
|
| [3] |
|
| [4] |
|
| [5] |
[
|
| [6] |
|
| [7] |
[
|
| [8] |
|
| [9] |
|
| [10] |
[
|
| [11] |
|
| [12] |
|
| [13] |
|
| [14] |
|
| [15] |
|
| [16] |
|
| [17] |
|
| [18] |
|
| [19] |
|
| [20] |
[
|
| [21] |
[
|
| [22] |
|
| [23] |
|
| [24] |
|
| [25] |
|
| [26] |
[
|
| [27] |
|
| [28] |
|
| [29] |
[
|
| [30] |
[
|
| [31] |
|
| [32] |
|
| [33] |
[
|
| [34] |
|
| [35] |
[
|
| [36] |
|
| [37] |
[
|
| [38] |
[
|
| [39] |
[
|
/
| 〈 |
|
〉 |