
中国农村人口老龄化的时空演化及乡村振兴对策
作者简介:郭远智(1990-),男,江西南康人,博士研究生,研究方向为城乡发展与贫困地理学研究。E-mail:Gavin.gyz@gmail.com
收稿日期: 2018-09-26
要求修回日期: 2019-01-30
网络出版日期: 2019-03-20
基金资助
国家自然科学基金(41871183,41471143)
中国博士后科学基金项目(2016M591105)
全球乡村计划-中国乡村振兴(GRP-CRV)
Population aging in rural China: Spatial-temporal pattern and countermeasures for rural revitalization
Received date: 2018-09-26
Request revised date: 2019-01-30
Online published: 2019-03-20
Copyright
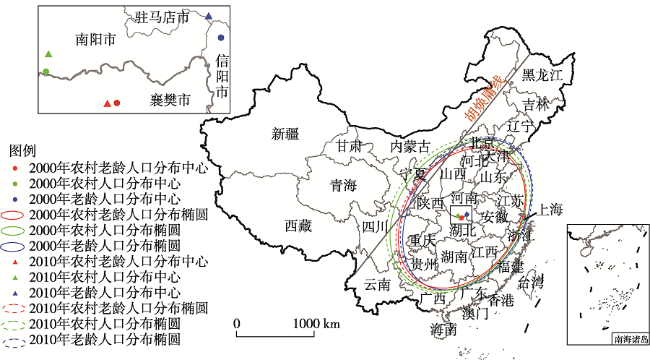
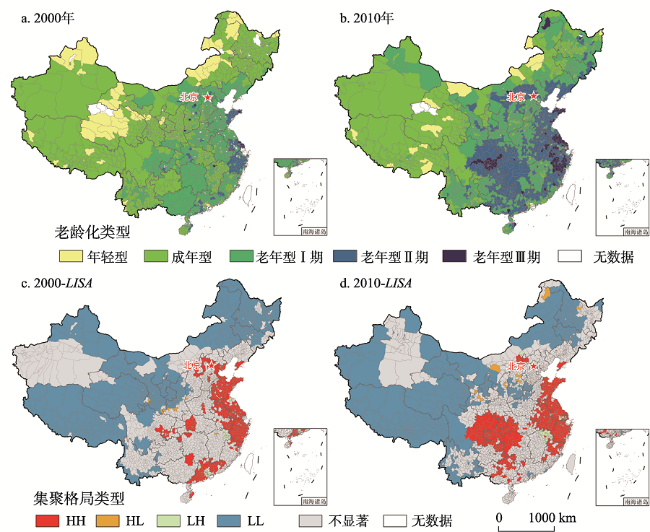
社会经济发展过程中农村青壮年劳动力外流、预期寿命延长以及生育率下降使得乡村人口老龄化形势愈发严峻,因此科学认知农村人口老龄化的发展演化及其机理对于推进乡村振兴战略的实施具有重要意义。基于2000年和2010年人口普查数据,采用标准差椭圆、空间自相关、多元线性回归等分析方法,本文揭示了中国县域农村人口老龄化的时空格局及其形成机制,探讨人口老龄化背景下的乡村振兴对策。结果显示:① 2000—2010年,中国农村老龄人口主要分布在胡焕庸线东南一侧,在空间分布上保持“东北-西南”格局。② 2000年全国有48.26%的区县农村尚未步入老龄化,主要分布在西部、东北地区和中部的江西和湖北东部;到2010年,仅有17.54%的区县农村未进入老龄化,主要分布在胡焕庸线西北一侧及大兴安岭地区。③ 植被覆盖指数、死亡率、每千人卫生机构床位数、受教育水平、农民人均可支配收入与农村人口老龄化水平呈现正相关关系,人口净流出率、出生率、城镇化率、少数民族人口占比、海拔、人均GDP则呈现负相关关系。老龄化背景下,应积极推动新型城镇化和县域经济发展,构建城乡融合发展的体制机制和可持续发展的内生机制,同时逐步放开生育限制,降低人口的风险暴露,进而减缓人口老龄化发展,推动乡村振兴战略的实施。
郭远智 , 周扬 , 韩越 . 中国农村人口老龄化的时空演化及乡村振兴对策[J]. 地理研究, 2019 , 38(3) : 667 -683 . DOI: 10.11821/dlyj020180967
Since the reform and opening-up, industrialization and urbanization in China have developed rapidly, and a large number of young and middle-aged workers, which migrate from rural to urban areas, exacerbating the population aging in rural China, which poses great challenges to rural sustainable development. Human activity is the decisive factor in socioeconomic development. Therefore, to promote the implementation of rural revitalization strategy, it is of great significance to scientifically analyze the evolution of aging population in rural China. This study examines the spatio-temporal pattern and mechanism of rural population aging in rural China at county level through standard deviational ellipse (SDE), exploratory spatial data analysis and multivariable linear regression (MLR). Then it discusses the countermeasures for rural revitalization under the background of population aging. Results showed that rural China entered the aging stage in 1999 and the ratio of population aged 65 and above increased from 7.50% in 2000 to 10.06% in 2010. In 2000 and 2010, rural aging population was concentrated to the southeast side of Heihe-Tengchong Line and maintained the spatial pattern of "northeast-southwest". Specifically, the rural areas of 48.26% of the total number of counties did not enter the aging stage in 2000, which were mainly distributed in western and northeastern China as well as Jiangxi and eastern Hubei of central China; while there were only 404 counties with the aging level of rural population less than 7.00% in 2010, most of them were located in the Greater Khingan Range area and to the northwest side of Heihe-Tengchong Line. Furthermore, regression results indicated that normalized difference vegetation index (NDVI), mortality, number of beds in health institutions per thousand people, educational attainment and per capita disposable income of rural households were positively correlated with the aging level of rural population, while net outflow rate of rural population, natality, urbanization rate, ratio of minority, elevation and per capita GDP showed a negative correlation. Population aging is an irreversible trend. To realize modernization of agriculture and the countryside, we should promote the development of new-type urbanization and intra-county economy and construct the mechanism for urban-rural integration and sustainable development. Besides, we should gradually liberate the birth control and reduce the risk exposure of rural population, which help to slow down the development of population aging and provide supports for rural revitalization.
Tab. 1 Parameters of standard deviational ellipse of rural elderly population in China表1 中国农村老龄人口特征椭圆参数 |
| 特征椭圆 | 平均中心坐标 | x标准差(km) | y标准差(km) | 方位角θ(°) | |
|---|---|---|---|---|---|
| 2000年 | 农村老龄人口 | 113.08°E, 32.19°N | 717.07 | 990.39 | 35.68 |
| 农村人口 | 112.59°E, 32.41°N | 783.34 | 1039.71 | 35.76 | |
| 老龄人口 | 113.87°E, 32.52°N | 726.43 | 1056.27 | 32.10 | |
| 2010年 | 农村老龄人口 | 113.01°E, 32.19°N | 738.89 | 1020.84 | 35.96 |
| 农村人口 | 112.62°E, 32.51°N | 833.58 | 1080.36 | 36.89 | |
| 老龄人口 | 113.79°E, 32.66°N | 758.19 | 1066.73 | 32.01 |
Fig. 1 Spatial variation of rural elderly population in 2000 and 2010图1 2000年和2010年中国农村老龄人口空间分异格局 注:此图根据国家测绘地理信息局标准地图(审图号:GS(2016)1569号)绘制而成,底图无修改。 |
Fig. 2 Spatial distribution profiles of rural population aging in 2000 and 2010图2 2000年和2010年中国农村人口老龄化空间分布 注:此图根据国家测绘地理信息局标准地图(审图号:GS(2016)1569号)绘制而成,底图无修改。 |
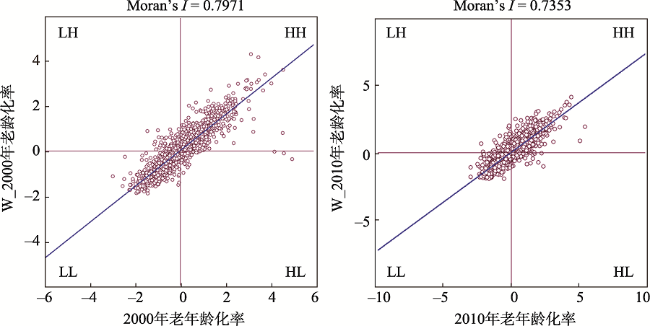
Fig. 3 Global autocorrelation of rural population aging in 2000 and 2010图3 2000年和2010年中国农村人口老龄化全局自相关分布 |
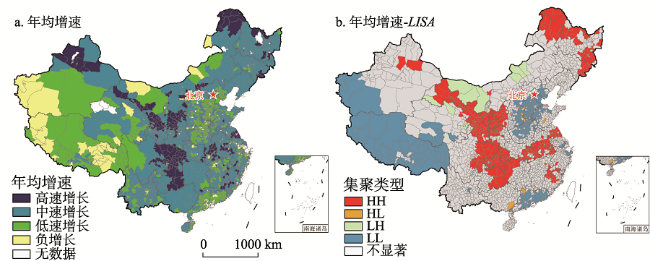
Fig. 4 Annual average growth rate of rural population aging from 2000 to 2010图4 2000—2010年中国农村人口老龄化年均增速 注:此图根据国家测绘地理信息局标准地图(审图号:GS(2016)1569号)绘制而成,底图无修改。 |
Tab. 2 Changes in the types of rural population aging from 2000 to 2010 (个区县)表2 2000—2010年中国农村人口老龄化类型变化 |
| 2010年 | |||||||
|---|---|---|---|---|---|---|---|
| 年轻型 | 成年型 | 老年型Ⅰ 期 | 老年型Ⅱ 期 | 老年型Ⅲ期 | 合计 | ||
2000年 | 年轻型 | 15 | 38 | 8 | 0 | 0 | 61 |
| 成年型 | 5 | 272 | 506 | 79 | 3 | 865 | |
| 老年型Ⅰ期 | 1 | 7 | 326 | 454 | 46 | 834 | |
| 老年型Ⅱ 期 | 0 | 2 | 5 | 73 | 70 | 150 | |
| 老年型Ⅲ期 | 0 | 0 | 3 | 1 | 6 | 10 | |
| 合计 | 21 | 319 | 848 | 607 | 125 | 1920 | |
Tab. 3 The regression coefficient of rural population aging in China表3 中国农村人口老龄化模型的回归分析 |
| 非标准化系数 | 标准化 系数 | t | Sig. | 共线性统计 | |||||
|---|---|---|---|---|---|---|---|---|---|
| B | Std. Error | 容忍度 | VIF | ||||||
| NDVI | 2.008 | 0.292 | 0.107 | 6.872 | 0.000 | 0.699 | 1.432 | ||
| Elevation | -2.63E-04 | 0.000 | -0.082 | -4.336 | 0.000 | 0.471 | 2.122 | ||
| Natality | -0.115 | 0.012 | -0.155 | -9.384 | 0.000 | 0.617 | 1.620 | ||
| Mortality | 0.953 | 0.033 | 0.439 | 28.755 | 0.000 | 0.725 | 1.379 | ||
| NOR | -2.847 | 0.161 | -0.253 | -17.693 | 0.000 | 0.830 | 1.205 | ||
| Per capita GDP | -0.08E-08 | 0.000 | -0.052 | -2.501 | 0.012 | 0.387 | 2.586 | ||
| Per capita DIR | 4.43E-04 | 0.000 | 0.421 | 18.467 | 0.000 | 0.326 | 3.071 | ||
| ROM | -0.006 | 0.002 | -0.058 | -3.497 | 0.000 | 0.620 | 1.613 | ||
| UR | -0.009 | 0.003 | -0.054 | -2.581 | 0.010 | 0.384 | 2.606 | ||
| NBHI | 0.125 | 0.038 | 0.056 | 3.277 | 0.001 | 0.582 | 1.719 | ||
| EA | 0.112 | 0.054 | 0.048 | 2.075 | 0.038 | 0.314 | 3.183 | ||
| Constant | 2.549 | 0.561 | 4.540 | 0.000 | |||||
| R=0.739 | R2=0.546 | 调整R2=0.544 | |||||||
| F=292.950 | Sig.=0.000 | df=11 | |||||||
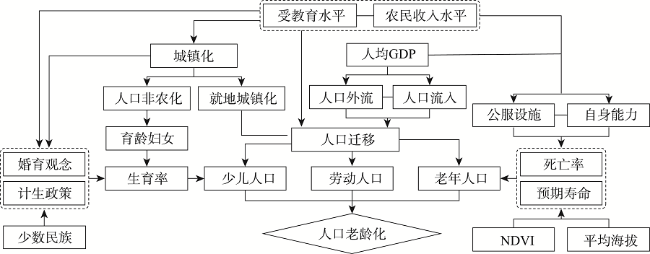
Fig. 5 The mechanism of rural population aging图5 农村人口老龄化的形成机制 |
The authors have declared that no competing interests exist.
| [1] |
World Health Organization (WHO). World Health Statistics 2016: Monitoring Health for the SDGs, Sustainable Development Goals. Geneva: World Health Organization, 2016.
|
| [2] |
United Nations (UN). World Population Prospects: The 2017 Revision. New York: United Nations Publications, 2017.
|
| [3] |
|
| [4] |
|
| [5] |
United Nations Population Fund (UNFPA). Ageing in the Twenty-first Century: A Celebration and a Challenge. New York: United Nations Population Fund (UNFPA) & London: HelpAge International, 2012.
|
| [6] |
[
|
| [7] |
|
| [8] |
|
| [9] |
|
| [10] |
|
| [11] |
|
| [12] |
|
| [13] |
|
| [14] |
|
| [15] |
|
| [16] |
|
| [17] |
|
| [18] |
|
| [19] |
|
| [20] |
[
|
| [21] |
[
|
| [22] |
[
|
| [23] |
[
|
| [24] |
|
| [25] |
|
| [26] |
|
| [27] |
|
| [28] |
|
| [29] |
|
| [30] |
|
| [31] |
|
| [32] |
[
|
| [33] |
[
|
| [34] |
[
|
| [35] |
[
|
| [36] |
[
|
| [37] |
|
| [38] |
|
| [39] |
[
|
| [40] |
[
|
| [41] |
[
|
| [42] |
[
|
| [43] |
[
|
| [44] |
[
|
| [45] |
[
|
| [46] |
[
|
| [47] |
|
| [48] |
[
|
| [49] |
[
|
| [50] |
|
| [51] |
|
| [52] |
|
| [53] |
|
| [54] |
|
| [55] |
[
|
| [56] |
|
| [57] |
[
|
| [58] |
[
|
/
| 〈 |
|
〉 |