
基于旅游开发影响的五台山植被景观特征分析
作者简介:牛莉芹(1976-),女,山西吕梁人,博士,副教授,主要从事环境生态学研究。E-mail: nlq1976@126.com
收稿日期: 2017-08-09
要求修回日期: 2017-12-27
网络出版日期: 2019-05-13
基金资助
国家自然科学基金项目(41571141)
山西省高等学校人文社会科学重点研究基地项目(2017332)
山西省软科学研究项目(2018041065-1)
山西省哲学社会科学规划项目(2018B072)
山西省高等学校工商管理优势学科攀升计划项目(晋教研[2018]4号)
Analysis on characteristics of vegetation landscapes basedon tourism development in Wutai Mountain scenic area
Received date: 2017-08-09
Request revised date: 2017-12-27
Online published: 2019-05-13
Copyright
以往旅游对植被影响的评价成果较多,但是旅游影响下植被景观与地理因子之间的关系报道较少。本文利用多种数量生态学方法探讨了五台山旅游开发与植被景观之间的生态关系。结果表明:① 旅游开发影响下五台山植被景观可分为单优乔木区、草本区、差级乔草区、中级乔草区、中级灌草区、良级灌草区、良级乔灌草区、优级乔灌草区、以及寺庙区、商业区或居民区9种类型。② 在除趋势对应分析中,第一轴与所有因子的相关性都较大,第二轴与旅游干扰度和海拔呈显著的负相关性。各植被景观类型的空间分布在一定程度上取决于关键性指标的空间格局。③ 除趋势典范对应分析方法能够大大提高植被景观特征与地理因子间的相关性,并将其直观地表达于排序图中。在植被景观特征与地理因子的关系上,第一轴上的相关系数是0.858DCCA>0.828DCA,第二轴上的相关系数是0.583DCCA>0.501DCA,这说明除趋势典范对应分析方法更优。
牛莉芹 , 程占红 . 基于旅游开发影响的五台山植被景观特征分析[J]. 地理研究, 2019 , 38(5) : 1162 -1174 . DOI: 10.11821/dlyj020170710
Vegetation landscape is an important factor for indicating the change of ecological environment, and it is beneficial to the ecological construction and the scenic area management to identify the types and characteristics of vegetation landscape under the influence of tourism development. The ecological relationship between tourism development and vegetation landscapes is studied by Two-Way Indicator Species Analysis (TWINSPAN), Detrended Correspondence Analysis (DCA), and Detrended Canonical Correspondence Analysis (DCCA) in Wutai Mountain. The results show that: (1) There are 9 types of vegetation landscapes under the influence of tourism development, i.e., the single tree area, the herb area, the poor class area for tree-herb, the intermediate area for tree-herb, the intermediate area for shrub-herb, the good level area for shrub-herb, the good level area for tree-shrub-herb, the best level area for tree-shrub-herb, and the temple and the residential area. By using the TWINSPAN, the results show that from right to left, tourism influencing index and the proportion of species companying with human being show a decreasing trend, and landscape value importance, species diversity, the proportions in community structure, and negative species proportion are in the increasing trend. Accordingly, the structure of the plant community changes from simplicity to complexity. (2) By adopting the DCA, the result shows that the first axis is greatly correlated with all factors, revealing a comprehensive environmental gradient. The second axis has significant negative correlation with elevation and tourism disturbance degree. All types have their distribution range in the ordination figure, which are determined by the pattern rule of main indices to a large extent. (3) Compared with DCA, DCCA can improve greatly the correlation between geographical factors and vegetation landscape characteristics, which can be directly reflected in the ordination figure. As for the correlation between vegetation landscapes and geographical factors, the ordination of their coefficients is 0.858DCCA>0.828DCA on the first axes, and 0.583DCCA >0.501DCA on the second axes, which shows that the DCCA is better.
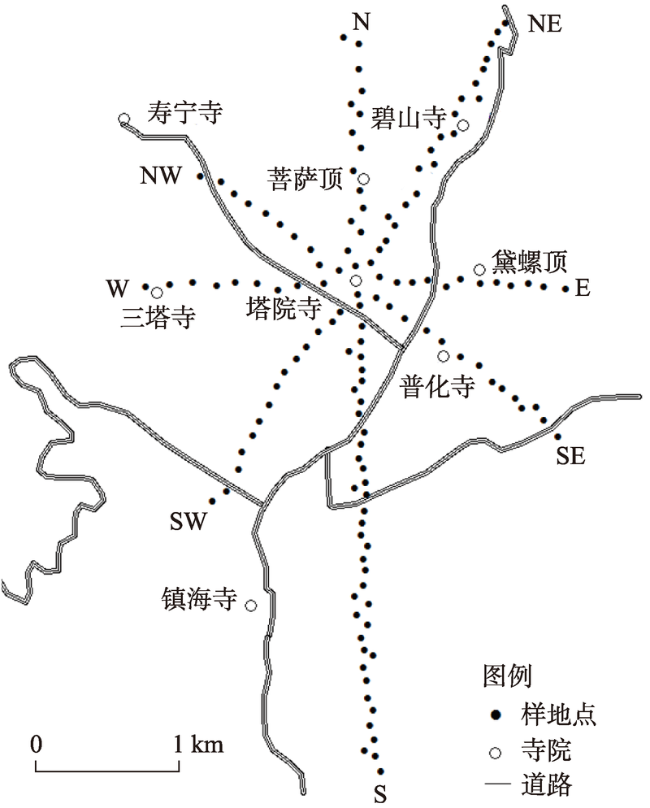
Fig. 1 Distribution of vegetation sample sites in Wutai Mountain图1 五台山植被取样分布 |
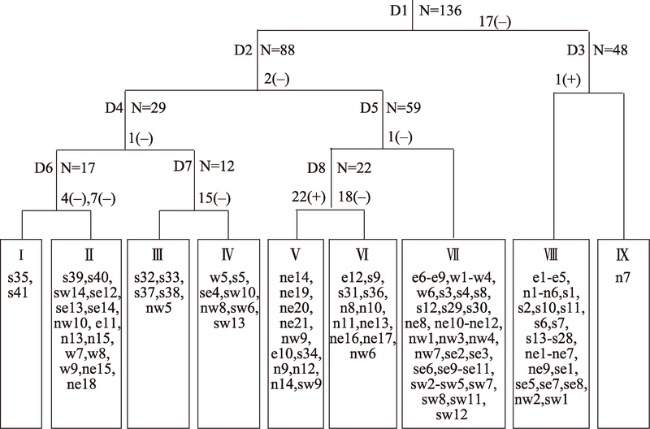
Fig. 2 The classification of all the samples by TWINSPAN图2 所有样地的TWINSPAN分类 |
Tab. 1 The average value of ecological characteristics in different vegetation landscape districts表1 不同植被景观区的生态特征平均值 |
| Ⅰ区 | Ⅱ区 | Ⅲ区 | Ⅳ区 | Ⅴ区 | Ⅵ区 | Ⅶ区 | Ⅷ区 | Ⅸ区 | |
|---|---|---|---|---|---|---|---|---|---|
| 乔木重要值 | 0.18 | 0.23 | 0 | 0 | 0.18 | 0.19 | 0 | 0 | 0.17 |
| 灌木重要值 | 0.16 | 0.33 | 0.11 | 0.32 | 0 | 0 | 0 | 0 | 0 |
| 草本重要值 | 0.06 | 0.11 | 0.05 | 0.11 | 0.18 | 0.08 | 0.09 | 0 | 0 |
| 乔木层丰富度 | 2.00 | 1.27 | 0 | 0 | 1.18 | 1.09 | 0 | 0 | 2.00 |
| 乔木层均匀度 | 0.90 | 0.99 | 0 | 0 | 0.99 | 1.00 | 0 | 0 | 0.98 |
| 乔木层多样性 | 0.76 | 0.91 | 0 | 0 | 0.94 | 0.96 | 0 | 0 | 0.52 |
| 灌木层丰富度 | 6.50 | 1.67 | 3.40 | 1.57 | 0 | 0 | 0 | 0 | 0 |
| 灌木层均匀度 | 0.91 | 0.99 | 0.96 | 0.96 | 0 | 0 | 0 | 0 | 0 |
| 灌木层多样性 | 0.22 | 0.78 | 0.58 | 0.79 | 0 | 0 | 0 | 0 | 0 |
| 草本层丰富度 | 11.50 | 11.00 | 8.20 | 11.57 | 11.73 | 9.64 | 8.62 | 0 | 0 |
| 草本层均匀度 | 0.70 | 0.87 | 0.88 | 0.89 | 0.82 | 0.86 | 0.81 | 0 | 0 |
| 草本层多样性 | 0.21 | 0.15 | 0.19 | 0.13 | 0.15 | 0.17 | 0.24 | 0 | 0 |
| 中高位芽植物比例 | 1.27 | 1.07 | 0 | 0.03 | 1.00 | 0.91 | 0 | 0 | 1.00 |
| 小高位芽植物比例 | 0.33 | 0.71 | 0.30 | 0.97 | 0 | 0.09 | 0 | 0 | 0 |
| 矮高位芽植物比例 | 0.40 | 0.21 | 0.70 | 0 | 0 | 0 | 0 | 0 | 0 |
| 地上芽植物比例 | 0.11 | 0.17 | 0.24 | 0.16 | 0.11 | 0.15 | 0.17 | 0 | 0 |
| 地面芽植物比例 | 0.78 | 0.64 | 0.70 | 0.50 | 0.69 | 0.74 | 0.40 | 0 | 0 |
| 隐芽植物比例 | 0.04 | 0.07 | 0 | 0.07 | 0.11 | 0 | 0.05 | 0 | 0 |
| 一年生植物比例 | 0.06 | 0.11 | 0.06 | 0.27 | 0.13 | 0.11 | 0.37 | 0 | 0 |
| 阴生种比值 | 0.63 | 0.37 | 0.39 | 0.18 | 0.41 | 0.24 | 0.11 | 0 | 0 |
| 伴人种比值 | 0 | 0.03 | 0.03 | 0.31 | 0.09 | 0.10 | 0.44 | 1.00 | 0 |
| 垃圾影响系数 | 0.15 | 0.10 | 0.14 | 0.14 | 0.19 | 0.38 | 0.30 | 1.00 | 1.00 |
| 折枝影响系数 | 0.15 | 0.30 | 0.08 | 0.16 | 0.39 | 0.50 | 0.17 | 1.00 | 1.00 |
| 林木更新影响系数 | 0.60 | 0.72 | 1.00 | 0.97 | 0.80 | 0.90 | 1.00 | 1.00 | 1.00 |
| 践踏影响系数 | 0.15 | 0.30 | 0.28 | 0.49 | 0.41 | 0.60 | 0.66 | 1.00 | 1.00 |
| 植被现状系数 | 0.15 | 0.25 | 0.70 | 0.70 | 0.32 | 0.47 | 0.87 | 1.00 | 0.70 |
Tab. 2 The average value of landscapes' characteristics in different vegetation landscape districts表2 不同植被景观区的景观特征平均值 |
| Ⅰ区 | Ⅱ区 | Ⅲ区 | Ⅳ区 | Ⅴ区 | Ⅵ区 | Ⅶ区 | Ⅷ区 | Ⅸ区 | |
|---|---|---|---|---|---|---|---|---|---|
| 景观重要值 | 0.153 | 0.232 | 0.034 | 0.089 | 0.141 | 0.128 | 0.013 | 0 | 0.105 |
| 物种多样性 | 3.187 | 2.457 | 1.816 | 2.092 | 2.210 | 1.897 | 1.339 | 0 | 0.521 |
| 群落结构比 | 0.387 | 0.377 | 0.256 | 0.245 | 0.312 | 0.314 | 0.165 | 0 | 0.118 |
| 阴生种比值 | 0.628 | 0.372 | 0.390 | 0.184 | 0.411 | 0.240 | 0.112 | 0 | 0 |
| 伴人种比值 | 0 | 0.031 | 0.030 | 0.315 | 0.093 | 0.104 | 0.440 | 1.000 | 0 |
| 旅游影响系数 | 0.234 | 0.328 | 0.478 | 0.539 | 0.415 | 0.574 | 0.671 | 0.998 | 0.923 |
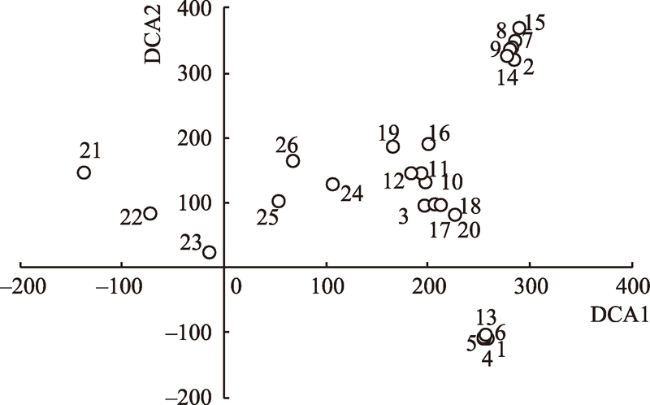
Fig. 3 The DCA ordination diagram of 136 samples图3 136个样地的DCA排序 |
Tab. 3 The relationship between the DCA ordination axes and different geographical factors表3 DCA排序轴与地理因子之间的关系 |
| 海拔 | 坡度 | 坡形 | 坡位 | 坡向 | 距离 | 干扰度 | 保护率 | 面积率 | 历史性 | |
|---|---|---|---|---|---|---|---|---|---|---|
| 第一轴 | 0.365** | 0.700** | 0.453** | 0.598** | -0.626** | 0.310** | -0.188* | -0.192* | -0.180* | -0.175* |
| 第二轴 | -0.303** | -0.058 | -0.011 | -0.098 | -0.008 | 0.024 | -0.225* | -0.142 | -0.144 | -0.098 |
注:* p<0.05;** p<0.01。 |
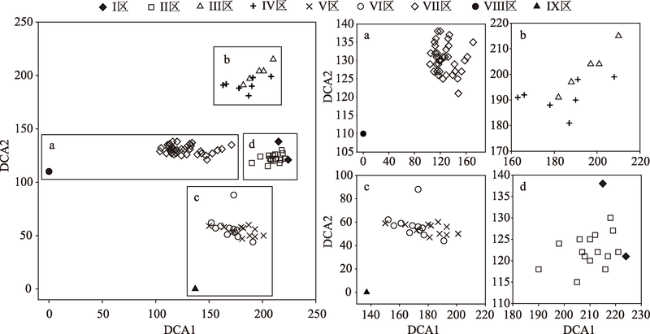
Fig. 4 DCA ordination diagram of main indices图4 主要指标的DCA排序 |
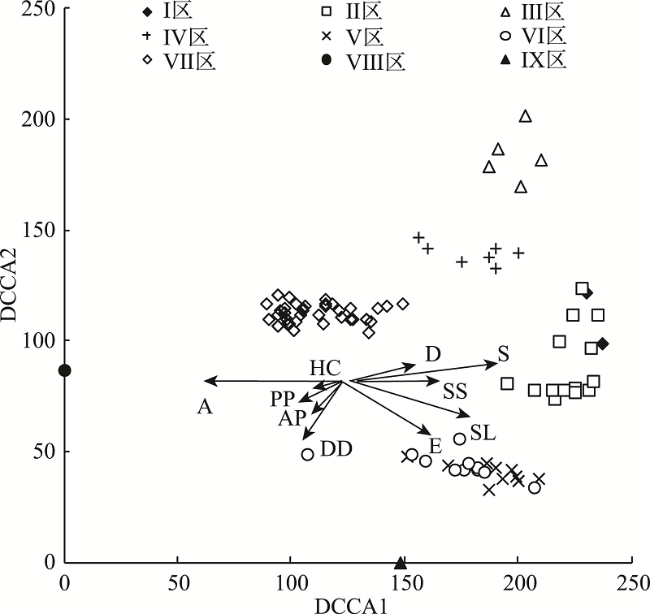
Fig. 5 The DCCA ordination diagram of 136 samples图5 136个样地的DCCA排序 |
Tab. 4 The correlation coefficients and the canonical coefficients between the DCCA ordination axes and all geographical factors表4 DCCA排序轴与地理因子的相关系数和典范系数 |
| 海拔 | 坡度 | 坡形 | 坡位 | 坡向 | 距离 | 干扰度 | 面积率 | 保护率 | 历史性 | ||
|---|---|---|---|---|---|---|---|---|---|---|---|
| 相关系数 | 第一轴 | 0.382** | 0.738** | 0.474** | 0.623** | -0.660** | 0.342** | -0.159 | -0.151 | -0.164 | -0.149 |
| 第二轴 | -0.432** | -0.040 | -0.040 | -0.099 | 0.051 | 0.087 | -0.173* | -0.077 | -0.071 | -0.023 | |
| 典范系数 | 第一轴 | 0.445 | 0.860 | 0.553 | 0.727 | -0.769 | 0.399 | -0.185 | -0.176 | -0.191 | -0.174 |
| 第二轴 | -0.741 | -0.069 | -0.068 | -0.170 | 0.088 | 0.149 | -0.298 | -0.133 | -0.121 | -0.040 | |
注:* p<0.05;** p<0.01。 |
Tab. 5 The characteristic values and the correlation coefficients in two ordination ways表5 2种排序轴的特征值及其相关系数 |
| 特征值 | 景观特征与地理因子的相关系数 | ||||
|---|---|---|---|---|---|
| DCA | DCCA | DCA | DCCA | ||
| 第一轴 | 0.425 | 0.347 | 0.828** | 0.858** | |
| 第二轴 | 0.134 | 0.043 | 0.501** | 0.583** | |
注:* p<0.05;** p<0.01。 |
The authors have declared that no competing interests exist.
| [1] |
[
|
| [2] |
[
|
| [3] |
[
|
| [4] |
[
|
| [5] |
[
|
| [6] |
[
|
| [7] |
[
|
| [8] |
[
|
| [9] |
[
|
| [10] |
[
|
| [11] |
[
|
| [12] |
[
|
| [13] |
[
|
| [14] |
|
| [15] |
|
| [16] |
|
| [17] |
|
| [18] |
|
| [19] |
|
| [20] |
[
|
| [21] |
[
|
| [22] |
[
|
| [23] |
[
|
| [24] |
[
|
| [25] |
[
|
| [26] |
[
|
| [27] |
[
|
| [28] |
[
|
| [29] |
[
|
| [30] |
[
|
/
| 〈 |
|
〉 |