
中国基础教育公共服务均等化空间格局及其影响因素
作者简介:汪凡(1992- ),男,湖北襄阳人,硕士,研究方向为区域发展与区域管理。E-mail: xywangfan@163.com
收稿日期: 2017-03-19
要求修回日期: 2018-08-11
网络出版日期: 2019-02-20
基金资助
国家自然科学基金项目(41701173)
中国博士后科学基金(2016M600121)
Spatial pattern and influencing factors of the equalization of basic education public service in China
Received date: 2017-03-19
Request revised date: 2018-08-11
Online published: 2019-02-20
Copyright
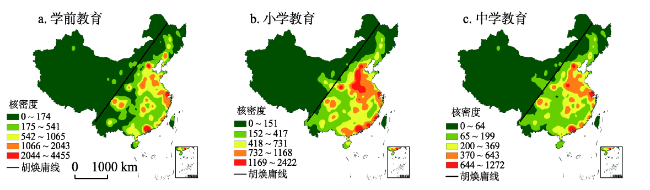
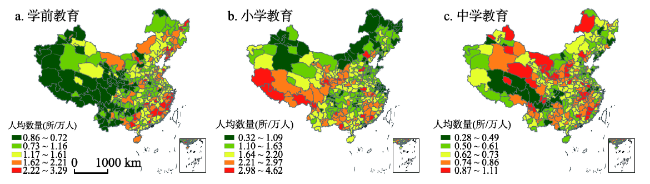
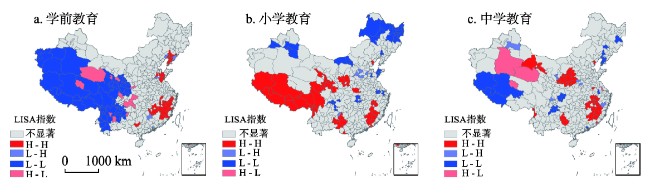
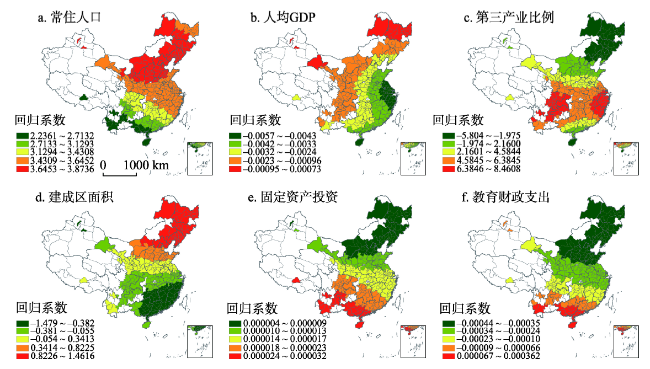
基于教育POI设施数据,利用ArcGIS比较统计地图(Cartogram)、核密度分析和探索性空间数据分析(ESDA)等方法对基础教育公共服务均等化空间格局进行研究,并采用地理加权回归(GWR)方法对其格局形成的影响因素进行探究。结果表明:东部和中部地区基础教育公共服务资源数量约占65%,基础教育公共服务的高值区域与城市群所在区域较为吻合,低值区域主要分布于胡焕庸线以西,东西部基础教育资源绝对数量差异明显。学前教育服务人均数量的低值区主要分布在西部,中部也存在部分低值塌陷区,相较于中小学,学前教育公共服务的非均等化问题突出。小学和中学教育公共服务人均数量的高高集聚(H-H)和低低集聚(L-L)区域在东中西地区均有分布,综合而言,地区基础教育公共服务人均数量均等化优于绝对数量的均等化状况。常住人口、第三产业比例、建成区面积是基础教育公共服务均等化空间格局分异的主要影响因素。
汪凡 , 白永平 , 周亮 , 纪学朋 , 徐智邦 , 乔富伟 . 中国基础教育公共服务均等化空间格局及其影响因素[J]. 地理研究, 2019 , 38(2) : 285 -296 . DOI: 10.11821/dlyj020170219
With the rapid socio-economic development and the progress of urbanization, the demand for basic education public service is increasing both in rural and urban areas. As a result, the issue of regional and urban-rural non-equalization has become increasingly prominent, which significantly affects the development of the harmonious society. Under this background, the paper discussed the equalization of basic education public service. Based on the POI data of basic education facilities, the spatial pattern and the influencing factors of the equalization of basic education public service in China were studied with the method of ArcGIS spatial statistical analysis functions, such as cartogram, kernel density, geographical weighted regression(GWR) and the exploratory sequential data analysis (ESDA). The results show that the basic education public service of eastern and central China accounts for about 65%, and the high-value regions of the basic education public service are observed in urban agglomerations of China, while the low-value regions are mainly located to the west of the "Hu Line". The low-value regions of the preschool education public service per capita are found in the central and western regions of China. Compared with the elementary and secondary education public service, the non-equalization situation of the preschool public service is more obvious. The high-high concentrated regions, the elementary and secondary education public service per capita highly owned regions, and the low-low concentrated regions are distributed all over the country. In general, the equalization of regional basic education public service per capita is superior to the absolute numbers. The spatial heterogeneity is recognized by geographical weighted regression model. The resident population, tertiary industry proportion, and urban built-up area are the major factors influencing the spatial pattern of the equalization of basic education public service. Education fiscal expenditure, GDP per capita and the fixed asset investment are the secondary driving forces of the spatial pattern of the equalization of basic education public service.
Fig. 1 Kernel density distribution of basic education public service of China in 2016图1 2016年中国基础教育公共服务的核密度分布 |
Fig. 2 Spatial distribution of basic education public service per capita in China图2 中国人均基础教育公共服务的空间分布 |
Fig. 3 LISA map for basic education public service per capita in China图3 中国人均基础教育公共服务LISA散点图 |
Tab. 1 Comparison of results from OLS and GWR表1 最小二乘法(OLS)和地理加权回归(GWR)结果对比 |
| AICc | R2 | Adjusted R2 | |
|---|---|---|---|
| OLS | 4376.7454 | 0.8804 | 0.8779 |
| GWR | 4342.3109 | 0.9043 | 0.8949 |
Tab. 2 Descriptive statistical analysis of regression coefficients in the GWR model and VIF表2 GWR模型回归系数描述性统计与方差膨胀因子(VIF) |
| 最小值 | 中位值 | 最大值 | 平均值 | 标准偏差 | VIF | |
|---|---|---|---|---|---|---|
| 常住人口 | 2.2362 | 3.5648 | 3.8736 | 3.4453 | 0.3474 | 6.9521 |
| 人均GDP | -0.0056 | -0.0029 | 0.0007 | -0.0029 | 0.0013 | 2.1133 |
| 第三产业比例 | -5.8031 | 4.2915 | 8.4608 | 3.2827 | 3.6308 | 1.4801 |
| 建成区面积 | -1.4785 | -0.0547 | 1.4616 | 0.0900 | 0.5709 | 5.9646 |
| 固定资产投资 | 0.000004 | 0.000014 | 0.000032 | 0.000015 | 0.000006 | 4.5841 |
| 教育财政支出 | -0.000433 | -0.000283 | 0.000362 | -0.000233 | 0.000168 | 5.9248 |
Fig. 4 Spatial distribution of regression coefficients in the GWR model图4 GWR模型回归系数空间分布 |
The authors have declared that no competing interests exist.
| [1] |
[
|
| [2] |
[
|
| [3] |
[
|
| [4] |
|
| [5] |
|
| [6] |
|
| [7] |
|
| [8] |
|
| [9] |
|
| [10] |
|
| [11] |
|
| [12] |
[
|
| [13] |
[
|
| [14] |
[
|
| [15] |
[
|
| [16] |
[
|
| [17] |
[
|
| [18] |
[
|
| [19] |
[
|
| [20] |
[
|
| [21] |
[
|
| [22] |
[
|
| [23] |
[
|
| [24] |
[
|
| [25] |
[
|
| [26] |
[
|
| [27] |
[
|
| [28] |
[
|
| [29] |
[
|
| [30] |
[
|
| [31] |
|
| [32] |
|
| [33] |
[
|
| [34] |
[
|
| [35] |
[
|
| [36] |
|
| [37] |
[
|
| [38] |
[
|
| [39] |
[
|
/
| 〈 |
|
〉 |