
区际农业生态补偿:区域划分与补偿标准核算——基于虚拟耕地流动视角的考察
|
梁流涛(1981- ),男,河南省杞县人,博士,副教授,主要研究方向为资源经济与环境管理。E-mail: ltliang@henu.edu.cn |
收稿日期: 2018-05-30
要求修回日期: 2018-07-28
网络出版日期: 2019-08-20
基金资助
国家自然科学基金项目(41771565)
河南省高校科技创新人才(人文社科类)支持计划(2019-cx-014)
河南省高校科技创新团队(16IRTSTHN012)
版权
Interregional agricultural eco-compensation based on virtual cultivated land flow: Regional division and compensation standard accounting
Received date: 2018-05-30
Request revised date: 2018-07-28
Online published: 2019-08-20
Copyright
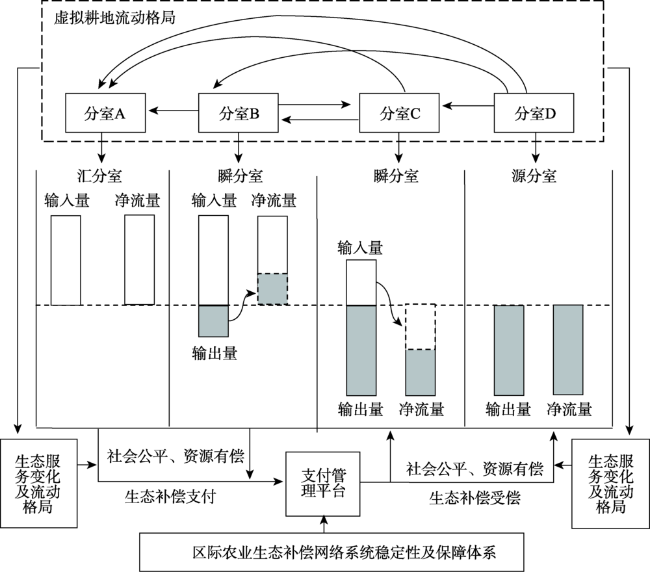
从虚拟耕地流动的视角构建区际农业生态补偿框架,并在此框架下开展区际农业生态补偿支付/受偿区域划分和补偿标准测算的研究。结果表明:① 区际农业生态补偿的基本原理是:利用虚拟耕地净流量(输入量与输出量的差额)指标划分区际农业生态补偿的支付/受偿区域。对于净流量为负的分室,通过虚拟耕地流动占用了其他区域的耕地资源,应该支付相应的生态补偿。对于净流量为正的分室,通过虚拟耕地流动被其他区域占用了耕地资源,应得到生态补偿。区际农业生态补偿额度应包含对农业生态环境保护和改善的投资成本以及占用农业资源使其牺牲的发展机会成本等方面,并由管理平台统一收缴和分发。② 2004年以后虚拟耕地流动格局基本上保持稳定,只有个别省市(甘肃和云南)由净流入转变为净流出,在空间上表现为“北耕南流”的格局。③ 受偿区域(15个省市)主要分布在东北地区、华北地区和西北地区;支付区域(16个省市)主要分布在东部沿海地区和西南地区。④ 研究期内年均总受偿额度为1472.58亿元,处于高受偿省份(黑龙江、吉林、内蒙古、河南)年均受偿额度都在150亿元以上。研究期内年均总支付额度为543.10亿元,其中,处于高支付区域的省份(浙江、广东、北京、福建)年均支付额度都在40亿元以上。
梁流涛 , 祝孔超 . 区际农业生态补偿:区域划分与补偿标准核算——基于虚拟耕地流动视角的考察[J]. 地理研究, 2019 , 38(8) : 1932 -1948 . DOI: 10.11821/dlyj020180549
At present, the practice of agricultural eco-compensation in China is mainly concerned with the central vertical transfer payment to local governments, but the overall effect is not very good. Under the conditions of opening up the grain market, the flow of grain is also accompanied by the inter-regional flow of virtual cultivated land. The area where virtual cultivated land is transferred has paid too much economic, resource, and ecological costs. In order to ensure interregional fairness, it is necessary to provide eco-compensation for the virtual cultivated land flowing-out area based on the carrier of virtual cultivated land, which provides new ideas for the study of interregional agricultural eco-compensation. Therefore, this paper attempted to construct an interregional agricultural eco-compensation framework from the perspective of the flow of virtual cultivated land, and under this framework, studies were carried out on the inter-regional agricultural eco-compensation payment/compensation divisions and compensation standard measurement. The results indicate that: the basic principle of the interregional agricultural eco-compensation is to use the virtual cultivated land net flow (the difference between the input and output of virtual farmland) indicators to divide the payment/receipt area of the inter-regional eco-compensation. The sub-compartment with positive net flow should pay eco-compensation to the net outflow sub-compartment of the virtual cultivated land because the flow of virtual cultivated land occupied the land resources of other regions. A sub-compartment with negative net flow means that the sub-community's land resources are occupied by other areas through the virtual cultivated land flow and should receive eco-compensation. The amount of inter-regional agricultural eco-compensation should include the investment cost of agricultural eco-environmental protection and improvement, as well as the opportunity cost of occupying agricultural resources to be lost and uniformly collected and distributed by the management platform. After 2004, the flow of virtual cultivated land tended to be stable, which is represented by the pattern of "Shift of Farmland from South to North". The compensation area for the inter-regional agricultural eco-compensation includes 15 provincial-level areas, mainly in the northeast, north and northwest regions. The payment area includes 16 provincial-level areas, mainly in the eastern coastal areas and southwest regions. In terms of the amount of reimbursement, the average annual total value within the study period was 147.258 billion yuan, and the average annual quotas in highly compensated regions (Heilongjiang, Jilin, Inner Mongolia, and Henan) were all above 15 billion yuan. Regarding the amount of payments, the average annual value during the study period was 54.301 billion yuan, Zhejiang, Guangdong, Beijing, and Fujian in the high-paying regions had an average annual payment of more than 4 billion yuan, and Guangdong exceeded 15 billion yuan.
表1 全国2001—2015年各省(市)虚拟耕地净流入/净流出年份数量统计Tab. 1 Statistics of virtual cultivated land net inflow / net outflow of provincial-level areas of China in 2001-2015 |
| 分室 | 净流入年份数量(个) | 净流出年份数量(个) | 分室 | 净流入年份数量(个) | 净流出年份数量(个) |
|---|---|---|---|---|---|
| 北京 | 15 | 0 | 湖北 | 3 | 12 |
| 天津 | 15 | 0 | 湖南 | 0 | 15 |
| 河北 | 4 | 11 | 广东 | 15 | 0 |
| 山西 | 15 | 0 | 广西 | 15 | 0 |
| 内蒙古 | 0 | 15 | 海南 | 15 | 0 |
| 辽宁 | 5 | 10 | 重庆 | 2 | 13 |
| 吉林 | 0 | 15 | 四川 | 2 | 13 |
| 黑龙江 | 0 | 15 | 贵州 | 15 | 0 |
| 上海 | 15 | 0 | 云南 | 11 | 4 |
| 江苏 | 15 | 0 | 西藏 | 15 | 0 |
| 浙江 | 15 | 0 | 陕西 | 14 | 1 |
| 安徽 | 1 | 14 | 甘肃 | 9 | 6 |
| 福建 | 15 | 0 | 青海 | 15 | 0 |
| 江西 | 3 | 12 | 宁夏 | 0 | 15 |
| 山东 | 1 | 14 | 新疆 | 0 | 15 |
| 河南 | 0 | 15 |
表2 全国31个省市2001—2015年虚拟耕地净流量Tab. 2 Net flow of fictitious cultivated land in 31 provincial-level areas of China in 2001-2015 |
| 分室 | 2001—2003年平均 (万hm2) | 2004—2006年平均 (万hm2) | 2007—2009年平均 (万hm2) | 2010—2012年平均 (万hm2) | 2013—2015年平均 (万hm2) | 2001—2015年平均 (万hm2) | 对外输出(依存)度 (%) | 支付/受偿 区域类型 |
|---|---|---|---|---|---|---|---|---|
| 北京 | -89.24 | -91.67 | -91.25 | -103.05 | -114.71 | -97.98 | -70.04 | 支付 |
| 天津 | -30.99 | -30.74 | -32.34 | -38.59 | -42.73 | -35.08 | -52.51 | 支付 |
| 河北 | -13.22 | 7.13 | 43.93 | 64.79 | 86.55 | 37.83 | 9.00 | 受偿 |
| 山西 | -56.19 | -26.41 | -36.98 | -18.57 | -6.23 | -28.88 | -15.66 | 支付 |
| 内蒙古 | 105.19 | 144.26 | 210.00 | 249.82 | 279.50 | 197.75 | 54.85 | 受偿 |
| 辽宁 | -21.58 | 28.38 | 26.97 | 54.82 | 58.45 | 29.41 | 9.94 | 受偿 |
| 吉林 | 254.74 | 310.87 | 312.56 | 359.95 | 414.01 | 330.43 | 63.59 | 受偿 |
| 黑龙江 | 325.26 | 395.01 | 588.56 | 701.62 | 744.34 | 550.96 | 66.89 | 受偿 |
| 上海 | -33.67 | -40.95 | -47.93 | -52.05 | -52.30 | -45.38 | -74.07 | 支付 |
| 江苏 | -76.05 | -65.95 | -38.90 | -29.52 | -11.10 | -44.30 | -9.39 | 支付 |
| 浙江 | -67.65 | -80.54 | -86.36 | -91.66 | -98.75 | -84.99 | -54.31 | 支付 |
| 安徽 | 28.26 | 64.45 | 97.24 | 106.07 | 138.29 | 86.86 | 22.53 | 受偿 |
| 福建 | -47.91 | -52.43 | -56.51 | -56.99 | -58.52 | -54.47 | -46.36 | 支付 |
| 江西 | -5.26 | 19.10 | 37.23 | 41.77 | 53.75 | 29.32 | 13.52 | 受偿 |
| 山东 | 13.33 | 48.10 | 88.83 | 99.27 | 114.26 | 72.76 | 14.66 | 受偿 |
| 河南 | 96.97 | 169.78 | 263.45 | 291.86 | 326.58 | 229.73 | 30.89 | 受偿 |
| 湖北 | -9.00 | 4.60 | 12.66 | 26.03 | 31.20 | 13.10 | 5.41 | 受偿 |
| 湖南 | 11.71 | 40.05 | 58.24 | 65.05 | 64.58 | 47.92 | 12.31 | 受偿 |
| 广东 | -148.68 | -175.22 | -200.83 | -203.80 | -211.45 | -188.00 | -56.74 | 支付 |
| 广西 | -25.89 | -27.13 | -27.95 | -21.57 | -17.26 | -23.96 | -17.19 | 支付 |
| 海南 | -7.07 | -8.73 | -7.97 | -8.18 | -8.17 | -8.02 | -38.73 | 支付 |
| 重庆 | 2.57 | 3.29 | 10.25 | 8.12 | 6.61 | 6.17 | 3.89 | 受偿 |
| 四川 | 0.40 | 6.69 | 13.90 | 43.49 | 55.87 | 24.07 | 4.89 | 受偿 |
| 贵州 | -37.19 | -26.54 | -18.45 | -31.93 | -20.51 | -26.92 | -19.34 | 支付 |
| 云南 | -12.25 | -10.49 | -13.11 | -5.67 | 6.66 | -6.97 | -4.93 | 支付 |
| 西藏 | -0.24 | -1.19 | -1.75 | -2.20 | -2.20 | -1.52 | -11.31 | 支付 |
| 陕西 | -63.64 | -47.80 | -28.88 | -24.92 | -19.51 | -36.95 | -17.74 | 支付 |
| 甘肃 | -24.14 | -17.60 | -10.39 | 8.04 | 20.14 | -4.79 | -2.32 | 支付 |
| 青海 | -14.50 | -14.68 | -13.19 | -13.94 | -14.43 | -14.15 | -49.44 | 支付 |
| 宁夏 | 20.21 | 20.74 | 25.48 | 28.96 | 26.76 | 24.43 | 30.45 | 受偿 |
| 新疆 | 5.90 | 10.30 | 17.71 | 36.30 | 50.52 | 24.15 | 25.64 | 受偿 |
表3 区际农业生态补偿支付/受偿区域划分结果Tab. 3 Results of regional agricultural eco-compensation payment / compensation divisions |
| 受偿区域 | 支付区域 | |||||
|---|---|---|---|---|---|---|
| 高受偿区 | 较高受偿区 | 低受偿区 | 高支付区 | 较高支付区 | 低支付区 | |
| 净流出量>150万hm2 | 25万hm2<净流出量<90万hm2 | 净流出量<30万hm2 | 净流入量>50万hm2 | 20万hm2<净流入量<50万hm2 | 净流入量<20万hm2 | |
| 黑龙江、吉林、河南、内蒙古 | 安徽、山东、河北、湖南、辽宁、江西 | 重庆、湖北、四川、新疆、宁夏 | 浙江、广东、北京、福建 | 上海、江苏、陕西、天津、山西、贵州、广西 | 青海、海南、云南、甘肃、西藏 | |
表4 2001—2013年单位面积标准虚拟耕地补偿标准Tab. 4 Standard virtual cultivated land compensation standard for unit area standard in 2001-2013 |
| 年份 | 补偿标准(元/hm2) | 年份 | 补偿标准(元/hm2) | 年份 | 补偿标准(元/hm2) |
|---|---|---|---|---|---|
| 2001 | 4021.86 | 2002 | 4335.68 | 2003 | 4717.86 |
| 2004 | 6449.26 | 2005 | 6560.68 | 2006 | 6941.29 |
| 2007 | 7072.28 | 2008 | 8246.94 | 2009 | 8454.63 |
| 2010 | 7901.87 | 2011 | 9197.17 | 2012 | 10083.42 |
| 2013 | 10671.81 | 2014 | 11174.56 | 2015 | 11610.84 |
表5 2001—2015年全国31个省市农业生态补偿支付/受偿额度Tab. 5 Agricultural eco-compensation payment / compensation amount in 31 provincial-level areas of China in 2001-2015 |
| 分室 | 2001—2003年平均(亿元) | 2004—2006年平均(亿元) | 2007—2009年平均(亿元) | 2010—2012年平均(亿元) | 2013—2015年平均(亿元) | 2001—2015年平均(亿元) |
|---|---|---|---|---|---|---|
| 北京 | -39.26 | -60.91 | -72.30 | -93.11 | -128.08 | -78.73 |
| 天津 | -13.52 | -20.44 | -25.71 | -35.16 | -47.70 | -28.51 |
| 河北 | -6.04 | 5.00 | 35.08 | 59.85 | 96.46 | 38.07 |
| 山西 | -23.83 | -17.54 | -29.55 | -15.97 | -7.06 | -18.79 |
| 内蒙古 | 45.97 | 96.16 | 167.24 | 227.42 | 311.82 | 169.72 |
| 辽宁 | -9.11 | 18.85 | 20.54 | 51.42 | 64.79 | 29.30 |
| 吉林 | 111.27 | 206.89 | 248.16 | 327.55 | 462.02 | 271.18 |
| 黑龙江 | 141.31 | 263.23 | 469.11 | 637.19 | 830.52 | 468.27 |
| 上海 | -14.77 | -27.26 | -38.06 | -47.25 | -58.31 | -37.13 |
| 江苏 | -34.12 | -43.64 | -30.64 | -26.19 | -12.23 | -29.36 |
| 浙江 | -29.79 | -53.53 | -68.37 | -83.01 | -110.12 | -68.96 |
| 安徽 | 11.74 | 43.11 | 77.54 | 98.65 | 154.48 | 77.10 |
| 福建 | -21.00 | -34.90 | -44.73 | -51.65 | -65.29 | -43.51 |
| 江西 | -2.57 | 12.87 | 29.69 | 38.27 | 59.97 | 27.65 |
| 山东 | 5.30 | 32.42 | 70.73 | 90.47 | 127.66 | 65.32 |
| 河南 | 42.13 | 113.85 | 209.12 | 265.38 | 364.71 | 199.04 |
| 湖北 | -4.23 | 3.16 | 10.29 | 23.99 | 35.05 | 13.65 |
| 湖南 | 4.62 | 26.84 | 46.74 | 59.54 | 72.09 | 41.97 |
| 广东 | -65.03 | -116.62 | -159.57 | -184.17 | -235.75 | -152.23 |
| 广西 | -11.35 | -17.96 | -22.11 | -19.39 | -19.28 | -18.02 |
| 海南 | -3.08 | -5.80 | -6.32 | -7.36 | -9.11 | -6.33 |
| 重庆 | 1.27 | 1.74 | 8.30 | 7.14 | 7.35 | 5.16 |
| 四川 | 0.40 | 3.96 | 11.62 | 39.86 | 62.33 | 23.63 |
| 贵州 | -16.21 | -17.63 | -14.37 | -29.24 | -22.60 | -20.01 |
| 云南 | -5.38 | -6.97 | -10.21 | -4.56 | 7.46 | -3.93 |
| 西藏 | -0.11 | -0.80 | -1.40 | -1.98 | -2.45 | -1.35 |
| 陕西 | -27.69 | -31.73 | -22.31 | -22.17 | -21.98 | -25.17 |
| 甘肃 | -10.43 | -11.72 | -7.93 | 7.85 | 22.49 | -3.75 |
| 青海 | -6.34 | -9.78 | -10.45 | -12.66 | -16.10 | -11.07 |
| 宁夏 | 8.77 | 13.81 | 20.20 | 26.27 | 29.81 | 19.77 |
| 新疆 | 2.54 | 6.89 | 14.54 | 33.05 | 56.47 | 22.70 |
注:负值表示生态补偿支付;正值表示生态补偿受偿。 |
| [1] |
梁流涛, 曲福田, 冯淑怡 . 农村发展中生态环境问题及其管理创新探讨. 软科学, 2010,24(8):53-57.
[
|
| [2] |
陈敏鹏, 陈吉宁, 赖斯芸 . 中国农业和农村污染的清单分析与空间特征识别. 中国环境科学, 2006,26(6):751-755.
[
|
| [3] |
刘莹, 黄季焜 . 农村环境可持续发展的实证分析: 以农户有机垃圾还田为例. 农业技术经济, 2013,32(7):4-10.
[
|
| [4] |
梁流涛, 曲福田, 冯淑怡 . 经济发展与农业而源污染: 分解模型与实证研究. 长江流域资源与环境, 2013,22(10):1369-1374.
[
|
| [5] |
|
| [6] |
中国生态补偿机制与政策研究课题组. 中国生态补偿机制与政策研究. 北京: 科学出版社, 2007.
[ Research Group of Chinese Ecological Compensation Mechanism and Policy Research. Study on Ecological Compensation Mechanism and Policy of China. Beijing: Science Press, 2007.]
|
| [7] |
欧阳志云, 郑华, 谢高地 , 等. 生态资产、生态补偿及生态文明科技贡献核算理论与技术. 生态学报, 2016,36(22):7136-7139.
[
|
| [8] |
蔡银莺, 余亮亮 . 重点开发区域农田生态补偿的农户受偿意愿分析: 武汉市的例证. 资源科学, 2014,36(8):1660-1669.
[
|
| [9] |
李颖, 葛颜祥, 刘爱华 , 等. 基于粮食作物碳汇功能的农业生态补偿机制研究. 农业经济问题, 2014,35(10):33-40.
[
|
| [10] |
刘尊梅 . 中国农业生态补偿机制的路径选择与制度保障研究. 北京: 中国农业出版社, 2012.
[
|
| [11] |
王学, 李秀彬, 辛良杰 , 等. 华北地下水超采区冬小麦退耕的生态补偿问题探讨. 地理学报, 2016,71(5):829-839.
[
|
| [12] |
周颖, 周清波, 周旭英 , 等. 意愿价值评估法应用于农业生态补偿研究进展. 生态学报, 2015,35(24):7955-7964.
[
|
| [13] |
刘春腊, 刘卫东, 陆大道 , 等. 2004-2011年中国省域生态补偿差异分析. 地理学报, 2015,70(12):1897-1910.
[
|
| [14] |
孙新章, 谢高地, 张其仔 , 等. 中国生态补偿的实践及其政策取向. 资源科学, 2006,28(4):25-30.
[
|
| [15] |
刘春腊, 刘卫东 . 中国生态补偿的省域差异及影响因素分析. 自然资源学报, 2014,29(7):1091-1104.
[
|
| [16] |
李平星, 孙威 . 经济地理学角度的区域生态补偿机制研究. 生态环境学报, 2010,26(6):1507-1512.
[
|
| [17] |
刘春腊, 刘卫东, 陆大道 . 生态补偿的地理学特征及内涵研究. 地理研究, 2014,33(5):803-816.
[
|
| [18] |
|
| [19] |
杨欣, 蔡银莺, 张安录 , 等. 农田生态盈亏空间差异与跨区域均衡机制: 基于生态账户的武汉城市圈实证分析. 中国人口·资源与环境, 2013,23(12):57-64.
[
|
| [20] |
|
| [21] |
罗贞礼, 龙爱华, 黄璜 , 等. 虚拟土战略与土地资源可持续利用的社会化管理. 冰川冻土, 2004,26(5):624-631.
[
|
| [22] |
闫丽珍, 成升魁, 闵庆文 . 玉米南运的虚拟耕地资源流动及其影响分析. 中国科学院研究生院学报, 2006,23(3):342-348.
[
|
| [23] |
贲培琪, 吴绍华, 李啸天 , 等. 中国省际粮食贸易及其虚拟耕地流动模拟. 地理研究, 2016,35(8):1447-1456.
[
|
| [24] |
强文丽, 刘爱民, 成升魁 , 等. 中国农产品贸易的虚拟土地资源量化研究. 自然资源学报, 2013,28(8):1289-1296.
[
|
| [25] |
|
| [26] |
邹君, 刘文洁, 杨玉蓉 , 等. 中国农产品虚拟耕地与资源环境经济要素的时空匹配分析. 长江流域资源与环境, 2012,21(4):477-481.
[
|
| [27] |
樊鹏飞, 梁流涛, 许明军 , 等. 基于虚拟耕地流动视角的省际耕地生态补偿研究. 中国人口·资源与环境 , 2018,28(1):91-101.
[
|
| [28] |
|
| [29] |
|
| [30] |
|
| [31] |
孙才志, 韩雪, 秦晓楠 . 中国区际间主要农产品虚拟水流动格局稳定性. 地理研究, 2014,33(3):478-489.
[
|
| [32] |
张效军 . 耕地保护区域补偿机制研究. 南京: 南京农业大学博士论文, 2006.
[
|
| [33] |
|
| [34] |
|
| [35] |
唐俊华 . 中国居民合理膳食模式下的粮食供需平衡分析. 农业经济问题, 2012,33(9):1-3.
[
|
| [36] |
马述忠, 叶宏亮, 任婉婉 . 基于国内外耕地资源有效供给的中国粮食安全问题研究. 农业经济问题, 2015,36(6):9-19.
[
|
| [37] |
龙开胜, 赵亚莉, 张鸿辉 , 等. 中国生态地租空间分异及其影响因素分析. 地理学报, 2012,67(8):1125-1136.
[
|
| [38] |
龙开胜, 陈利根 . 1997-2007年中国生态地租变化分析. 中国人口·资源与环境, 2011,21(9):44-50.
[
|
| [39] |
龙开胜, 陈利根 . 基于生态地租的生态环境补偿理论建构及应用. 自然资源学报, 2012,27(12):2048-2056.
[
|
/
| 〈 |
|
〉 |