
中国高技能劳动力与一般劳动力的空间分布格局及其影响因素
|
刘晔(1986- ),男,广东广州人,教授,博士生导师,主要研究方向为人口地理、城市地理和社会地理。E-mail: liuye25@mail.sysu.edu.cn |
收稿日期: 2018-04-16
要求修回日期: 2018-06-22
网络出版日期: 2019-08-20
基金资助
国家自然科学基金国际(地区)交流与合作研究(41320104001)
国家自然科学基金项目(41871140)
国家自然科学基金项目(41501151)
版权
The spatial pattern and determinants of skilled laborers and less-skilled laborers in China: Evidence from 2000 and 2010 censuses
Received date: 2018-04-16
Request revised date: 2018-06-22
Online published: 2019-08-20
Copyright
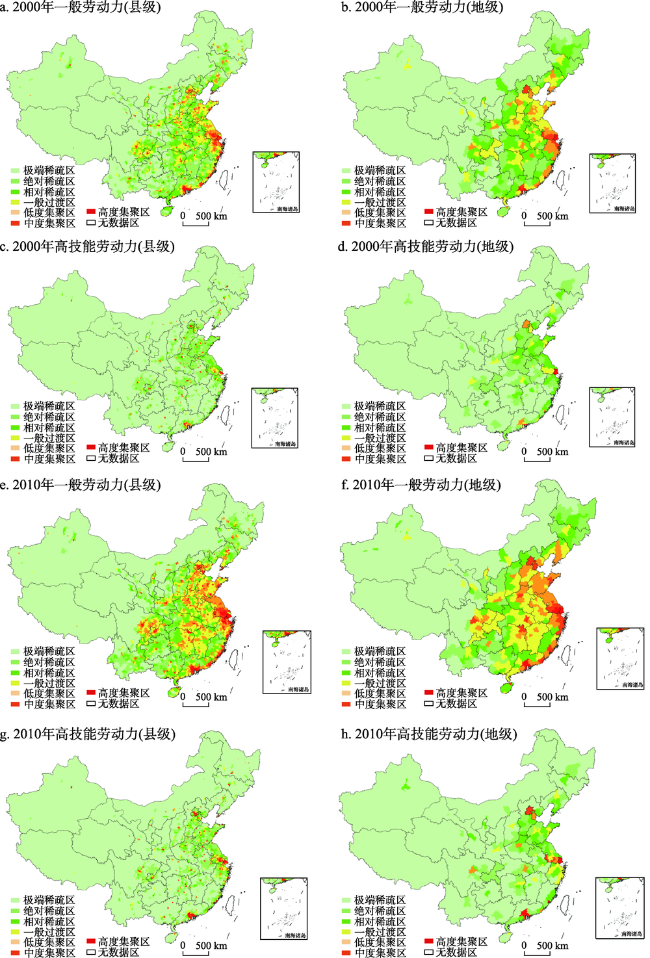
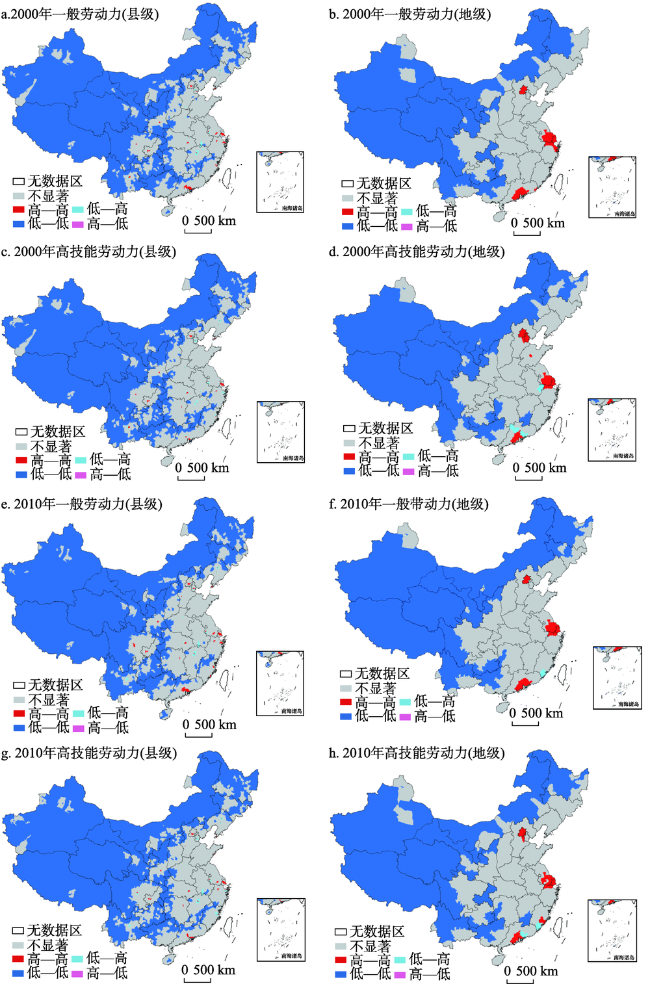
基于2000和2010年全国人口普查分县数据和地级行政单元数据,采用不均衡指数和空间自相关分析等方法,刻画中国高技能劳动力和一般劳动力的空间分布格局及其变化,并采用空间滞后模型,识别高技能劳动力与一般劳动力空间分布的决定因素及其变化。结果表明:① 两类劳动力总体的空间特征均为东南密集,西北稀疏;② 2000—2010年,高技能劳动力在空间分布上呈集中化的趋势,而一般劳动力呈分散化的趋势;③ 十年间高技能劳动力集聚区虹吸作用加强,其分布越发集中于沿海特大城市群,而一般劳动力集聚区回波作用加强,其分布越发均衡;④ 空间回归分析结果表明,职工平均工资、是否直辖市或省会、每万人在校高校学生、是否沿海城市、常住人口数和空间溢出效应在十年中一直都是决定高技能劳动力和一般劳动力空间分布的主要因素,而失业率、中学生师比、二氧化硫排放量和绿地率在2010年也成为影响两类劳动力空间分布的主要因素。对比两类劳动力的模型结果可得,高技能劳动力的空间分布受行政因素、高校因素和地区生活舒适度的影响更大,而一般劳动力的空间分布受劳动力市场因素的影响更大。
刘晔 , 王若宇 , 薛德升 , 曾经元 . 中国高技能劳动力与一般劳动力的空间分布格局及其影响因素[J]. 地理研究, 2019 , 38(8) : 1949 -1964 . DOI: 10.11821/dlyj020180391
Based on 2000 and 2010 county-level and city-level National Demographic Census data, we applied inequality index and spatial auto-correlation analysis to specify the spatial patterns of China's high-skilled and general labor force and its variation during the decade. We also use the SLM model to further analyze the main factors that contribute to the spatial patterns and the changes of them. The results are as follows: (1) The density of high-skilled labors and general laborers was high in southeastern China and low in northwestern regions. (2) From 2000 to 2010, the high-skilled labors had been accumulating spatially while the normal labors had been dispersing. (3) The siphon effects of the high-skilled-labor clusters, which were more inclined to accumulate in coastal metropolitan area compared with 10 years ago, also enhanced during the decade. On the contrary, the echo effect of general labor clusters strengthened and attained the uniform distribution. (4) Results of spatial regression analysis showed that the level of wages, urban administrative level, the number of ten thousand college students, the coastal cities, population and spatial spillover effects in the ten years were the main factors determining the spatial distribution of high-skilled and general labor force, while the unemployment rate, high school teacher ratio, concentration of sulfur dioxide and afforestation in 2010 became the main factors influencing the two types of labor distribution. Comparing the two types of labor model, we found that the spatial distribution of the high-skilled labors was more influenced by government forces, while the spatial distribution of general laborers was influenced by market forces.
表1 变量基本统计信息Tab. 1 Descriptive statistics of variables |
| 变量名 | 变量符号 | 样本量 | 2000年 | 2010年 | |||||||
|---|---|---|---|---|---|---|---|---|---|---|---|
| mean | sd | min | max | mean | sd | min | max | ||||
| 高技能劳动力密度(人/km2,对数) | lnsuperior | 286 | 2.36 | 0.99 | -1.07 | 5.53 | 2.50 | 1.11 | -1.06 | 6.32 | |
| 一般劳动力密度(人/km2,对数) | lnnormal | 286 | 3.61 | 1.18 | -0.16 | 7.76 | 4.12 | 1.20 | 0.01 | 8.13 | |
| 职工平均工资(元,对数) | lnwage | 286 | 8.97 | 0.26 | 8.44 | 10.04 | 10.20 | 0.23 | 9.45 | 11.06 | |
| 居民生活支出占收入比例 | cost | 286 | 0.57 | 0.14 | 0.10 | 0.97 | 0.40 | 0.08 | 0.24 | 0.79 | |
| 失业率(%) | uemp | 286 | 5.91 | 3.66 | 1.18 | 22.37 | 6.59 | 2.55 | 2.12 | 17.02 | |
| 人均外商直接投资(美元/人,对数) | lnfdi | 286 | 1.94 | 1.91 | -3.34 | 6.49 | 3.58 | 1.64 | -1.64 | 6.80 | |
| 直辖市或省会(1=是;0=否) | provcap | 286 | 0.11 | 0.31 | 0.00 | 1.00 | 0.11 | 0.31 | 0.00 | 1.00 | |
| 每万人在校高校学生人数(人,对数) | lnunistud | 286 | 2.74 | 1.50 | 0.00 | 5.87 | 4.38 | 1.19 | 0.00 | 6.87 | |
| 中学生师比 | studteacher | 286 | 18.2 | 3.05 | 9.64 | 32.05 | 15.25 | 2.97 | 5.06 | 24.25 | |
| 二氧化硫排放量(t/km2,对数) | lnso2em | 286 | 2.66 | 1.43 | 0.00 | 6.36 | 3.65 | 1.21 | 0.00 | 6.25 | |
| 绿地率(%) | green | 286 | 27.68 | 10.42 | 2.00 | 61.60 | 37.28 | 7.69 | 2.75 | 69.83 | |
| 年平均每日日照时数(h) | sun | 286 | 5.56 | 1.45 | 2.57 | 8.90 | 5.45 | 1.30 | 2.62 | 9.02 | |
| 沿海城市(1=是;0=否) | coast | 286 | 0.18 | 0.38 | 0.00 | 1.00 | 0.18 | 0.38 | 0.00 | 1.00 | |
| 常住人口数(人,对数) | lnpop | 286 | 14.98 | 0.72 | 11.98 | 17.23 | 15.06 | 0.70 | 12.35 | 17.18 | |
表2 2000—2010年中国高技能劳动力和一般劳动力县级密度分级单元面积比例和劳动力比例统计表Tab. 2 The proportion of area and population by the level of population density in China, 2000 and 2010 |
| 年份 | 2000年 | 2010年 | 2000—2010年变化 | 以2010年密度分区为基准,十年中人数和密度的变化 | |||||||||||||||||||
|---|---|---|---|---|---|---|---|---|---|---|---|---|---|---|---|---|---|---|---|---|---|---|---|
| 密度级 | 高技能劳动力 | 一般劳动力 | 高技能劳动力 | 一般劳动力 | 高技能劳动力 | 一般劳动力 | 高技能劳动力 | 一般劳动力 | |||||||||||||||
| 数量 (%) | 面积 (%) | 数量 (%) | 面积 (%) | 数量 (%) | 面积 (%) | 数量 (%) | 面积 (%) | 数量 (%) | 面积 (%) | 数量 (%) | 面积 (%) | 人数 (万人) | 密度 (人/km2) | 人数 (万人) | 密度 (人/km2) | ||||||||
| 高度集聚区 | 25.51 | 0.28 | 30.87 | 0.47 | 36.29 | 0.50 | 36.28 | 0.89 | 10.78 | 0.22 | 5.41 | 0.42 | 775.60 | 162 | 4211.40 | 492 | |||||||
| 中度集聚区 | 3.64 | 0.15 | 12.15 | 0.67 | 4.74 | 0.25 | 12.18 | 1.18 | 1.10 | 0.10 | 0.03 | 0.51 | 109.34 | 45 | 1455.06 | 128 | |||||||
| 低度集聚区 | 2.91 | 0.17 | 15.46 | 1.98 | 3.34 | 0.24 | 19.79 | 4.40 | 0.43 | 0.07 | 4.34 | 2.42 | 81.33 | 35 | 2843.00 | 67 | |||||||
| 一般过渡区 | 7.80 | 0.72 | 12.27 | 3.49 | 6.30 | 0.63 | 13.66 | 6.32 | -1.50 | -0.09 | 1.39 | 2.83 | 178.34 | 17 | 2399.86 | 29 | |||||||
| 相对稀疏区 | 12.27 | 2.26 | 14.99 | 9.10 | 13.42 | 2.81 | 10.48 | 10.64 | 1.15 | 0.55 | -4.51 | 1.54 | 122.32 | 5 | 943.84 | 12 | |||||||
| 绝对稀疏区 | 19.08 | 7.14 | 7.68 | 10.58 | 13.83 | 6.44 | 4.33 | 9.75 | -5.25 | -0.70 | -3.36 | -0.83 | 37.48 | 1 | 489.34 | 5 | |||||||
| 极端稀疏区 | 28.79 | 89.28 | 6.58 | 73.71 | 22.08 | 89.13 | 3.28 | 66.82 | -6.71 | -0.15 | -3.30 | -6.89 | -80.72 | 0 | 240.87 | 0 | |||||||
表3 中国高技能劳动力与一般劳动力分布的变异系数Tab. 3 The coefficient of variance of talents and general laborers in China |
| 2000年 | 2010年 | ||||
|---|---|---|---|---|---|
| 高技能劳动力 | 一般劳动力 | 高技能劳动力 | 一般劳动力 | ||
| 变异系数(县级) | 1.13 | 1.64 | 1.61 | 0.93 | |
| 变异系数(地级) | 1.47 | 2.55 | 2.09 | 2.30 | |
表4 计量模型的估计结果Tab. 4 Estimation results of econometric models |
| 模型1 2000 SLM | 模型2 2000 SLM | 模型3 2010 SLM | 模型4 2010 SLM | |
|---|---|---|---|---|
| 变量标签 | 高技能劳动力 | 一般劳动力 | 高技能劳动力 | 一般劳动力 |
| 职工平均工资 | 0.570**(0.240) | 1.093***(0.140) | 0.561**(0.270) | 1.427***(0.295) |
| 居民生活支出占收入比例 | -0.105(0.208) | -0.370(0.215) | -0.964(0.817) | -0.214(0.434) |
| 失业率 | -0.026*(0.008) | -0.010(0.009) | -0.050**(0.020) | -0.061**(0.023) |
| 直辖市或省会(参照组:非直辖市或省会) | 0.548***(0.200) | 0.241**(0.111) | 1.041***(0.225) | 0.821***(0.240) |
| 每万人在校高校学生 | 0.300***(0.040) | 0.217***(0.044) | 0.236***(0.060) | 0.215***(0.060) |
| 中学生师比 | -0.080(0.081) | -0.084(0.211) | -0.028**(0.011) | -0.023**(0.011) |
| 二氧化硫排放量 | -0.047(0.041) | -0.051(0.052) | -0.086**(0.034) | -0.074***(0.032) |
| 绿地率 | 0.012(0.009) | 0.011(0.013) | 0.029***(0.010) | 0.025***(0.010) |
| 年平均每日日照时数 | 0.027(0.022) | -0.042(0.043) | 0.106(0.126) | -0.135(0.327) |
| 人均外商直接投资 | 2.198(6.311) | 2.921(6.818) | 0.062(3.971) | 0.112(4.053) |
| 沿海城市(参照组:非沿海城市) | 0.649***(0.160) | 0.521***(0.140) | 0.928***(0.163) | 0.595***(0.089) |
| 常住人口数 | 0.351***(0.031) | 0.398***(0.050) | 0.230***(0.052) | 0.290***(0.050) |
| 空间滞后项 | 0.045***(0.008) | 0.093***(0.020) | 0.052***(0.008) | 0.065***(0.009) |
| 常数项 | 0.622(2.210) | -3.328(2.371) | -0.595(2.891) | 1.842**(3.971) |
| 观测数 | 286 | 286 | 286 | 286 |
| Robust LMLAG | 3.428*** | 2.159*** | 2.094*** | 2.796*** |
| Robust LMERR | 1.015 | 1.391 | 1.687 | 1.495 |
| AIC | 706.712 | 746.247 | 777.294 | 811.665 |
| R²-adjusted | 0.424 | 0.428 | 0.388 | 0.339 |
注:括号内为标准误。*P<0.1,**P<0.05,***P<0.01。 |
| [1] |
中共中央、国务院 . 党的十八届中央委员会向中国共产党第十九次全国代表大会的报告. , 2018-04-25.
[ The Central Committee of the Communist Party of China . China State Council. Secure a decisive victory in building a moderately prosperous society in all respects and strive for the great success of socialism with Chinese characteristics for a new era. , 2018-04-25.]
|
| [2] |
黄金川, 林浩曦, 陈明 . 2000—2013年中国城市群经济绩效动态实证分析: 基于DEA和Malmquist生产率指数法. 地理科学进展, 2017,36(6):685-696.
[
|
| [3] |
严浩坤 . 劳动力跨地区流动与地区差距. 地理科学, 2008,28(2):179-184.
[
|
| [4] |
|
| [5] |
刘晔, 沈建法, 刘于琪 . 西方高端人才跨国流动研究述评. 人文地理, 2013,28(2):7-12.
[
|
| [6] |
|
| [7] |
|
| [8] |
|
| [9] |
|
| [10] |
|
| [11] |
|
| [12] |
|
| [13] |
顾朝林, 蔡建明, 张伟 , 等. 中国大中城市流动人口迁移规律研究. 地理学报, 1999,54(3):204-212.
[
|
| [14] |
刘涛, 齐元静, 曹广忠 . 中国流动人口空间格局演变机制及城镇化效应: 基于2000和2010年人口普查分县数据的分析. 地理学报, 2015,70(4):567-581.
[
|
| [15] |
吕晨, 孙威 . 人口集聚区吸纳人口迁入的影响因素: 以东莞市为例. 地理科学进展, 2014,33(5):593-604.
[
|
| [16] |
戚伟, 刘盛和, 赵美风 . “胡焕庸线”的稳定性及其两侧人口集疏模式差异. 地理学报, 2015,70(4):551-566.
[
|
| [17] |
曹广忠, 刘涛 . 中国城镇化地区贡献的内陆化演变与解释: 基于1982-2008年省区数据的分析. 地理学报, 2011,66(12):1631-1643.
[
|
| [18] |
封志明, 杨艳昭, 游珍 , 等. 基于分县尺度的中国人口分布适宜度研究. 地理学报, 2014,69(6):723-737.
[
|
| [19] |
|
| [20] |
刘睿文, 封志明, 杨艳昭 , 等. 基于人口集聚度的中国人口集疏格局. 地理科学进展, 2010,29(10):1171-1177.
[
|
| [21] |
高远东, 花拥军 . 人力资本空间效应与区域经济增长. 地理研究, 2012,31(4):711-719.
[
|
| [22] |
胡兆量, 王恩涌, 韩茂莉 . 中国人才地理特征. 经济地理, 1998,18(1):8-14.
[
|
| [23] |
姜怀宇, 徐效坡, 李铁立 . 1990年代以来中国人才分布的空间变动分析. 经济地理, 2005,25(5):702-706.
[
|
| [24] |
|
| [25] |
罗守贵, 王爱民, 高汝熹 . 高级人才空间流动因素分析及建立反区域筛选机制的意义. 地理科学, 2009,29(6):779-786.
[
|
| [26] |
|
| [27] |
|
| [28] |
杨传开, 宁越敏 . 中国省际人口迁移格局演变及其对城镇化发展的影响. 地理研究, 2015,34(8):1492-1506.
[
|
| [29] |
马海涛 . 基于人才流动的城市网络关系构建. 地理研究, 2017,36(1):161-170.
[
|
| [30] |
|
| [31] |
|
| [32] |
|
| [33] |
|
| [34] |
|
| [35] |
|
/
| 〈 |
|
〉 |