
清代(1816—1911年)霍乱流行的时空特征、危险模拟与边界探测
|
李孜沫(1989-),男,安徽灵璧人,博士,讲师,主要从事健康地理、健康旅游研究。E-mail:zglzm1989@163.com |
收稿日期: 2018-06-27
要求修回日期: 2019-07-10
网络出版日期: 2020-03-20
基金资助
江西省高校人文社会科学研究项目(LS19206)
南昌师范学院博士科研启动基金资助项目(NSBSJJ201-8028)
版权
Spatial-temporal characteristics, danger simulation and boundary detection of cholera in the late Qing Dynasty (1816-1911)
Received date: 2018-06-27
Request revised date: 2019-07-10
Online published: 2020-03-20
Copyright
霍乱是清代1820年左右传入中国的新型烈性传染病,迄今仍是人类生命健康安全的重大威胁之一。本文运用ArcGIS时空分析、MaxEnt生态位模拟、BoundarySeer边界探测等方法对清代的霍乱流行进行分析,结果表明:① 清代霍乱的流行频度为77%,对整个清代疫灾的流行贡献了约21.32%的广度。② 霍乱在中国的适生范围广,东部沿海为最佳适生区;中国不同区域霍乱流行的危险等级差异显著,并呈现自东向西递减、南方高于北方的总体特征;距海距离、海拔高程、日照时数、最高气温是影响霍乱流行的主要因素,贡献率分别为29.3%、22.4%、16.1%和7.7%。③ 霍乱流行的边界性特征明显,第一边界是以凤阳为圆心,以凤阳-夹江直线距离为半径(约1300 km)与国界线或海岸线围合的圆弧圈,界内包含97.65%的霍乱流行事件;第二边界参照霍乱高适生度分布线,该线迤东包括中国东、中部省份;第三边界是由霍乱主要网络构成的围合区,总体上掩及环渤海、长三角和珠三角等东部沿海一线。
关键词: 霍乱; 时空特征; 危险模拟; 边界探测; 清代(1816—1911年)
李孜沫 . 清代(1816—1911年)霍乱流行的时空特征、危险模拟与边界探测[J]. 地理研究, 2020 , 39(1) : 129 -139 . DOI: 10.11821/dlyj020180636
Cholera was a new type of severe infectious disease which was introduced into China around 1820 in the Qing Dynasty (1644-1911), and the "localization" process was completed rapidly. At present, it is still one of the major threats to the health and safety of human life, and sometimes it causes heavy casualties. In this paper, the spatial-temporal analysis, danger simulation, and boundary detection methods are used to analyze the cholera epidemic in the late Qing Dynasty (1816-1911). The results showed that: 1) because of the strong intervention of cholera, the frequency of the cholera was 77% in the last 100 years in the late Qing Dynasty (1816-1911) which was equivalent to outbreak every 1.3 years, and the contribution rate to the epidemic breadth promotion in the late Qing Dynasty (1816-1911) was about 21.32%, which means that nearly a quarter of the epidemics in the whole Qing Dynasty (1644-1911) were caused by cholera. 2) Cholera had a wide range of suitable habitats in China of the late Qing Dynasty (1816-1911), and the eastern coast was the best suitable habitat. The risk level of cholera epidemic in China was high, and the risk level gradually decreased from east to west, and the risk level in the south was higher than that in the north. There were many factors influencing cholera epidemic, in which the distance from sea level, elevation, sunshine hours, and the maximum temperature were the main factors, and their contribution rates were 29.3%, 22.4%, 16.1% and 7.7%, respectively. This indicates that cholera epidemic was sensitive to geographic factors such as temperature, water source, sunshine and topography. 3) The borderline characteristics of cholera epidemic were obvious in the late Qing Dynasty (1816-1911). The first border was a circular arc with Fengyang as the center and Fengyang-Jiajiang as the radius (the linear distance about 1300 km), which contains about 97.65% of cholera epidemic in this area. The second border was the borderline of cholera high-suitability area, which includes eastern and central provinces of China, such as Anhui, Jiangxi, Hubei , Hunan, and so on. The third border is the enclosed area with the main cholera network as the standard, covering the Bohai Sea, central China, Yangtze River Delta and Pearl River Delta. Almost the entire eastern coastline was covered.
表1 清代基础环境数据指标释义Tab. 1 Interpretation of the indicators of the basic environmental data in the Qing Dynasty |
| 基础数据 | 指标 | 单位 | 指标释义 |
|---|---|---|---|
| 地理环境要素 | 海拔高程 | m | 反映海拔高度差异 |
| 河网密度 | km/km2 | 反映河流影响差异 | |
| 距海距离 | km | 反映海洋影响差异 | |
| 气候环境要素 | 年均气温 | ℃ | 反映平均气温变幅 |
| 最高气温 | ℃ | 反映极端高温影响 | |
| 最低气温 | ℃ | 反映极端低温影响 | |
| 暖季温度 | ℃ | 反映极端温度影响 | |
| 冷季温度 | ℃ | 反映极端温度影响 | |
| 湿季温度 | ℃ | 反映雨热同期影响 | |
| 干季温度 | ℃ | 反映雨热同期影响 | |
| 温度季节性 | - | 反映温度变异影响 | |
| 气温年较差 | - | 反映温差变异影响 | |
| 年均降水 | mm | 反映平均降水变幅 | |
| 暖季降水 | mm | 反映雨热同期影响 | |
| 冷季降水 | mm | 反映雨热同期影响 | |
| 湿季降水 | mm | 反映极端降水影响 | |
| 干季降水 | mm | 反映极端降水影响 | |
| 湿月降水 | mm | 反映极端降水影响 | |
| 干月降水 | mm | 反映极端降水影响 | |
| 降水季节性 | - | 反映降水变异影响 | |
| 日照时数 | h | 反映太阳光照差异 |
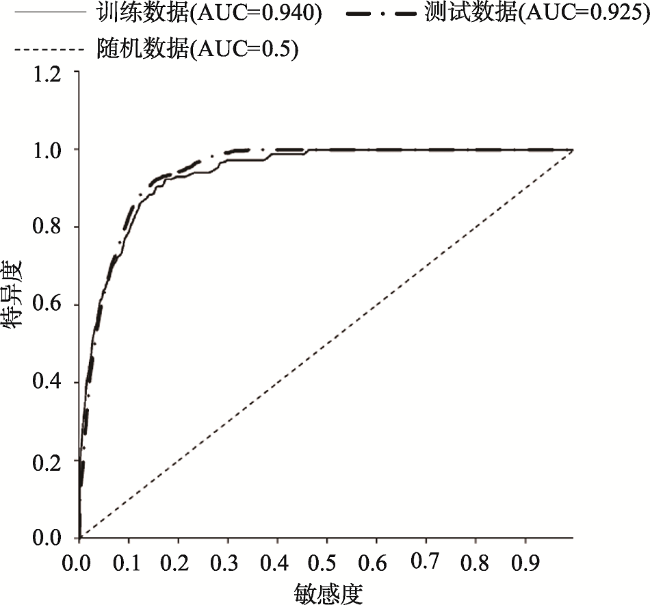
表2 生态位模型预测精度、适生范围与危险等级评价标准Tab. 2 Prediction accuracy, fitness range and risk level evaluation standard of MaxEnt |
| 预测精度(AUC) | 阈值标准 | 适生范围(适生度) | 阈值标准 | 危险等级(危险度) | 阈值标准 |
|---|---|---|---|---|---|
| 较差 | 0.5~0.7 | 低 | 0 | 低危 | ≤ 0.01 |
| 一般 | 0.7~0.8 | - - | - - | 中危 | 0.01~0.10 |
| 较高 | 0.8~0.9 | 高危 | 0.10~0.30 | ||
| 极高 | 0.9~1.0 | 高 | 1 | 特危 | ≥ 0.3 |
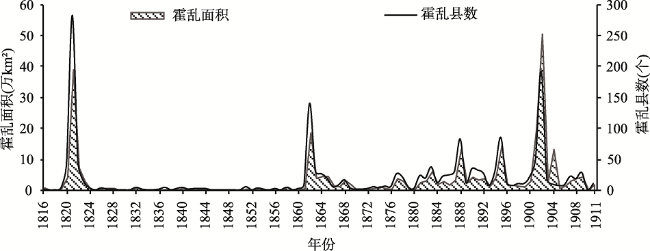
表3 清代霍乱流行季节与县数分布Tab. 3 The epidemic season of cholera and the distribution of county number in the Qing Dynasty |
| 疫灾 年份 | 疫灾季节 | 疫灾县数 (个) | 疫灾面积 (万km2) | 疫灾 年份 | 疫灾季节 | 疫灾县数 (个) | 疫灾面积 (万km2) | ||||||||
|---|---|---|---|---|---|---|---|---|---|---|---|---|---|---|---|
| 春 | 夏 | 秋 | 冬 | NA | 春 | 夏 | 秋 | 冬 | NA | ||||||
| 1816 | 1 | 1 | 0.77 | 1874 | 1 | 2 | 3 | 1.17 | |||||||
| 1819 | 1 | 2 | 2 | 0.63 | 1875 | 1 | 3 | 2 | 6 | 0.51 | |||||
| 1820 | 5 | 35 | 1 | 3 | 40 | 4.14 | 1876 | 4 | 1 | 5 | 0.32 | ||||
| 1821 | 4 | 133 | 208 | 10 | 2 | 282 | 38.94 | 1877 | 16 | 17 | 1 | 5 | 26 | 3.77 | |
| 1822 | 1 | 26 | 17 | 1 | 6 | 42 | 7.22 | 1878 | 10 | 17 | 4 | 1 | 21 | 2.93 | |
| 1823 | 12 | 3 | 13 | 2.92 | 1879 | 1 | 1 | 3 | 5 | 0.37 | |||||
| 1824 | 1 | 2 | 3 | 0.30 | 1880 | 1 | 2 | 2 | 0.29 | ||||||
| 1826 | 2 | 2 | 3 | 0.55 | 1881 | 2 | 8 | 17 | 3 | 23 | 2.50 | ||||
| 1827 | 1 | 1 | 1 | 0.64 | 1882 | 10 | 8 | 5 | 2 | 19 | 3.06 | ||||
| 1828 | 1 | 1 | 1 | 0.64 | 1883 | 19 | 32 | 2 | 1 | 37 | 6.00 | ||||
| 1832 | 2 | 1 | 1 | 4 | 0.82 | 1884 | 7 | 3 | 4 | 12 | 1.94 | ||||
| 1833 | 1 | 1 | 1 | 0.24 | 1885 | 7 | 17 | 2 | 2 | 22 | 2.84 | ||||
| 1836 | 1 | 1 | 0.06 | 1886 | 8 | 17 | 4 | 24 | 1.69 | ||||||
| 1837 | 4 | 4 | 0.19 | 1887 | 20 | 18 | 1 | 29 | 3.27 | ||||||
| 1839 | 2 | 2 | 0.17 | 1888 | 19 | 72 | 7 | 82 | 13.24 | ||||||
| 1840 | 4 | 4 | 0.59 | 1889 | 1 | 2 | 7 | 1 | 2 | 12 | 2.39 | ||||
| 1841 | 1 | 1 | 0.11 | 1890 | 9 | 29 | 4 | 34 | 4.20 | ||||||
| 1842 | 1 | 1 | 2 | 0.58 | 1891 | 15 | 30 | 1 | 2 | 32 | 3.32 | ||||
| 1843 | 1 | 1 | 1 | 1 | 2 | 0.21 | 1892 | 2 | 23 | 11 | 27 | 3.76 | |||
| 1844 | 2 | 2 | 0.10 | 1893 | 4 | 4 | 7 | 1.30 | |||||||
| 1851 | 2 | 5 | 1 | 5 | 0.37 | 1894 | 12 | 20 | 1 | 6 | 30 | 4.24 | |||
| 1853 | 2 | 1 | 3 | 0.58 | 1895 | 54 | 55 | 1 | 13 | 85 | 14.30 | ||||
| 1854 | 1 | 1 | 0.13 | 1896 | 7 | 10 | 12 | 1.69 | |||||||
| 1856 | 2 | 2 | 2 | 0.10 | 1897 | 4 | 4 | 3 | 7 | 1.57 | |||||
| 1858 | 1 | 3 | 4 | 1.03 | 1898 | 4 | 2 | 4 | 10 | 1.26 | |||||
| 1860 | 1 | 1 | 2 | 0.09 | 1899 | 1 | 8 | 8 | 10 | 1.08 | |||||
| 1861 | 1 | 3 | 4 | 7 | 0.49 | 1900 | 3 | 9 | 9 | 4 | 21 | 2.94 | |||
| 1862 | 6 | 74 | 78 | 1 | 21 | 140 | 18.56 | 1901 | 1 | 21 | 16 | 13 | 48 | 19.99 | |
| 1863 | 2 | 19 | 13 | 4 | 29 | 3.80 | 1902 | 13 | 115 | 86 | 2 | 34 | 192 | 50.49 | |
| 1864 | 8 | 15 | 4 | 26 | 4.47 | 1903 | 7 | 8 | 5 | 16 | 2.79 | ||||
| 1865 | 15 | 5 | 1 | 19 | 4.47 | 1904 | 5 | 2 | 4 | 9 | 13.17 | ||||
| 1866 | 2 | 1 | 3 | 5 | 1.46 | 1905 | 3 | 3 | 1 | 7 | 0.63 | ||||
| 1867 | 1 | 3 | 4 | 8 | 1.11 | 1906 | 5 | 2 | 1 | 8 | 1.36 | ||||
| 1868 | 13 | 9 | 1 | 16 | 3.15 | 1907 | 2 | 4 | 14 | 6 | 22 | 3.04 | |||
| 1869 | 3 | 3 | 1.74 | 1908 | 8 | 8 | 2 | 18 | 3.84 | ||||||
| 1870 | 1 | 1 | 0.05 | 1909 | 1 | 7 | 20 | 2 | 28 | 4.29 | |||||
| 1871 | 1 | 1 | 1 | 0.17 | 1910 | 7 | 3 | 1 | 2 | 11 | 2.13 | ||||
| 1872 | 2 | 2 | 0.26 | 1911 | 2 | 2 | 1 | 5 | 10 | 1.75 | |||||
| 1873 | 2 | 3 | 5 | 0.61 | 合计 | 52 | 787 | 1006 | 45 | 207 | 1662 | 291.87 | |||
说明:1)表中季节栏下的数字表示该季节发生疫灾的县数,NA表示疫灾季节不详的县数。2)春季为农历正、二、三月,其余季节类推。3)疫灾县数是该年发生疫灾的县的个数,不管疫灾发生在何季节,是一次发生还是多次发生,年内均不重复计算,因此不是各季节疫灾县数的累加;疫灾面积是该年所有发生疫灾的县的国土面积的总和。 |
表4 清代霍乱已知分布及预测危险等级Tab. 4 The known distribution and the forecast risk grade of cholera in the Qing Dynasty |
| 省区 | 已知霍乱分布 | 预测霍乱危险等级面积占比(%) | ||||
|---|---|---|---|---|---|---|
| 县数(个) | 面积(万km2) | 低危 | 中危 | 高危 | 特危 | |
| 河北 | 264 | 34.50 | 14.34 | 17.05 | 37.67 | 30.94 |
| 辽宁 | 81 | 23.20 | 2.61 | 43.87 | 15.16 | 38.36 |
| 吉林 | 6 | 1.94 | 0.55 | 92.73 | 5.89 | 0.83 |
| 黑龙江 | 5 | 43.28 | 37.97 | 61.99 | 0.02 | 0.03 |
| 山东 | 226 | 31.98 | 0.00 | 0.00 | 0.00 | 100.00 |
| 山西 | 43 | 7.44 | 6.02 | 9.43 | 63.22 | 21.34 |
| 河南 | 35 | 4.86 | 0.00 | 0.00 | 31.70 | 68.30 |
| 陕西 | 22 | 3.77 | 0.00 | 10.86 | 74.90 | 14.24 |
| 甘肃 | 9 | 4.44 | 65.10 | 24.51 | 9.16 | 1.24 |
| 内蒙古 | 0 | 0.00 | 73.58 | 20.44 | 5.21 | 0.77 |
| 青海 | 0 | 0.00 | 93.81 | 6.19 | 0.00 | 0.00 |
| 新疆 | 0 | 0.00 | 98.84 | 1.16 | 0.00 | 0.00 |
| 江苏 | 386 | 34.43 | 0.00 | 0.00 | 0.00 | 100.00 |
| 安徽 | 32 | 7.75 | 0.00 | 0.00 | 14.05 | 85.95 |
| 江西 | 22 | 4.52 | 0.00 | 0.05 | 48.65 | 51.30 |
| 福建 | 62 | 9.31 | 0.00 | 0.00 | 62.93 | 37.07 |
| 台湾 | 4 | 0.88 | 0.00 | 6.79 | 68.50 | 24.71 |
| 浙江 | 209 | 23.01 | 0.00 | 0.00 | 7.27 | 92.73 |
| 湖北 | 33 | 7.11 | 0.00 | 3.11 | 86.50 | 10.39 |
| 湖南 | 37 | 9.81 | 0.00 | 0.70 | 73.44 | 25.86 |
| 广东 | 79 | 16.24 | 0.00 | 0.38 | 63.31 | 36.31 |
| 广西 | 39 | 8.69 | 0.00 | 1.26 | 53.12 | 45.62 |
| 四川 | 48 | 7.67 | 35.78 | 21.60 | 21.12 | 21.51 |
| 贵州 | 16 | 4.86 | 0.00 | 10.10 | 79.48 | 10.42 |
| 云南 | 4 | 2.19 | 37.37 | 57.55 | 5.04 | 0.04 |
| 西藏 | 0 | 0.00 | 98.12 | 1.88 | 0.00 | 0.00 |
| 合计 | 1662 | 291.87 | 58.86 | 14.23 | 14.64 | 12.27 |
注:河北包含北京、天津;江苏包括上海;广东包括海南、香港、澳门;甘肃包括宁夏;四川包括重庆。(3)霍乱贡献度分析。霍乱贡献度是指不同环境要素对霍乱危险等级的影响程度。基于MaxEnt模型预测影响清代霍乱危险等级的环境要素,可以发现:影响清代霍乱危险等级的环境因素较多,但程度不一,其中距海距离、海拔高程等地理环境要素的贡献度高,分别达到29.3%和22.4%;日照时数、最高气温、干月降水量、河网密度等气候环境要素的贡献度高,分别达到16.1%、7.7%、4.4%和3.0%。这些影响因素及其贡献度高低是对清代霍乱由海外传入、多流行于夏秋季、多与水源污染有关的集中体现。 |
| [1] |
李兰娟, 任红 . 传染病学(第8版). 北京: 人民卫生出版社, 2013: 171.
[
|
| [2] |
李玉尚 . 霍乱在中国的流行(1817-1821). 历史地理, 2001, ( 17):316-336.
[
|
| [3] |
单丽 . 中国霍乱始发问题辨析. 中国历史地理论丛, 2014,29(1):48-55.
[
|
| [4] |
单丽 . 1902年霍乱在中国的流行. 青岛: 中国海洋大学硕士学位论文, 2008.
[
|
| [5] |
单丽 . 1902年广西霍乱大流行探析. 历史地理, 2011, ( 25):50-60.
[
|
| [6] |
李孜沫 . 清代疫灾流行的环境机理研究. 武汉: 华中师范大学博士学位论文, 2018.
[
|
| [7] |
余新忠 . 嘉道之际江南大疫的前前后后—基于近世社会变迁的考察. 清史研究, 2001, ( 2):1-18.
[
|
| [8] |
冯志阳 . 媒体、瘟疫与清末的健康卫生观念: 以<大公报>对1902年瘟疫的报道为中心. 史林, 2006, ( 6):96-103.
[
|
| [9] |
岳谦厚, 乔傲龙, 刘红彦 . 清光绪二十八年天津霍乱防治—以<大公报>有关此次疫情及防疫报道之研究. 天津师范大学学报: 社会科学版, 2008, ( 6):48-69.
[
|
| [10] |
李孜沫, 陈丹阳 . 清代卫生防疫机制的引建. 江西社会科学, 2019, ( 10):129-136.
[
|
| [11] |
王五一, 李海蓉, 杨林生 , 等. 典型鼠疫疫源地环境—健康脆弱性评价. 地理研究, 2001,20(3):290-297.
[
|
| [12] |
陈国阶 . 我国疾病类型与生态地理环境的关系. 地理研究, 1985,4(2):45-55.
[
|
| [13] |
龚胜生, 李孜沫 . 清代山西地区疫灾时空分布研究. 干旱区资源与环境, 2017,31(6):1-7.
[
|
| [14] |
徐敏, 曹春香, 王多春 , 等. 基于环境危险要素的中国霍乱分区预测. 科学通报, 2013,58(26):2798-2804.
[
|
| [15] |
龚胜生 . 中国三千年疫灾史料汇编·清代卷. 济南: 齐鲁书社, 2019: 503-1254.
[
|
| [16] |
龚胜生 . 中国疫灾的时空分布变迁规律. 地理学报, 2003,58(6):870-878.
[
|
| [17] |
龚胜生, 王晓伟, 张涛 . 明代江南地区的疫灾地理. 地理研究, 2014,33(8):1569-1578.
[
|
| [18] |
|
/
| 〈 |
|
〉 |
