
深圳市近20年城市景观格局演变及其驱动因素
|
吴健生(1965-),男,湖南新化人,博士,教授,博士生导师,研究领域为景观生态与GIS。E-mail: wujs@szpku.edu.cn |
收稿日期: 2019-07-02
要求修回日期: 2020-05-13
网络出版日期: 2020-10-20
基金资助
国家重点研发计划项目(2019YFB2102000)
国家自然科学基金项目(41671180)
版权
The evolution of urban landscape pattern and its driving forces of Shenzhen from 1996 to 2015
Received date: 2019-07-02
Request revised date: 2020-05-13
Online published: 2020-10-20
Copyright
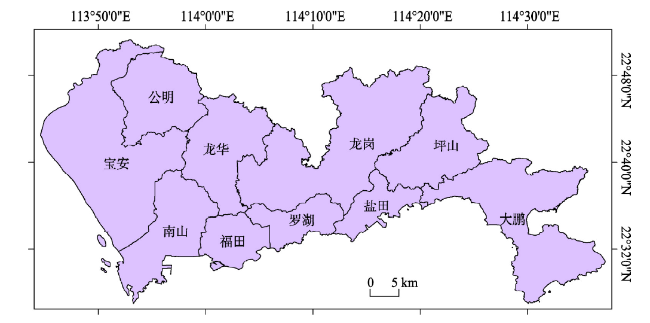
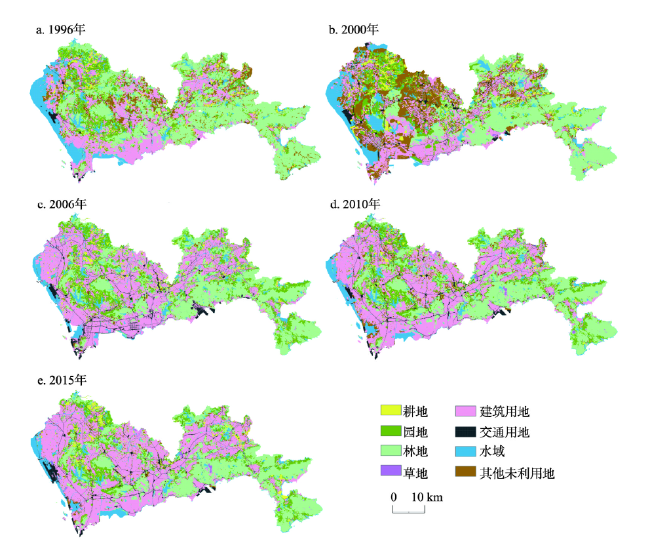
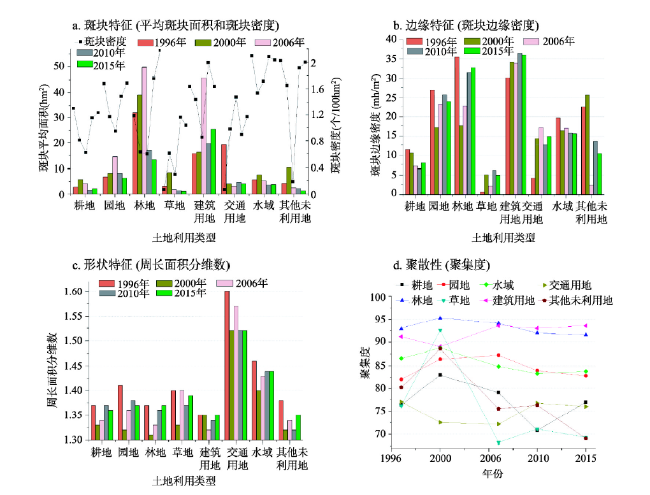
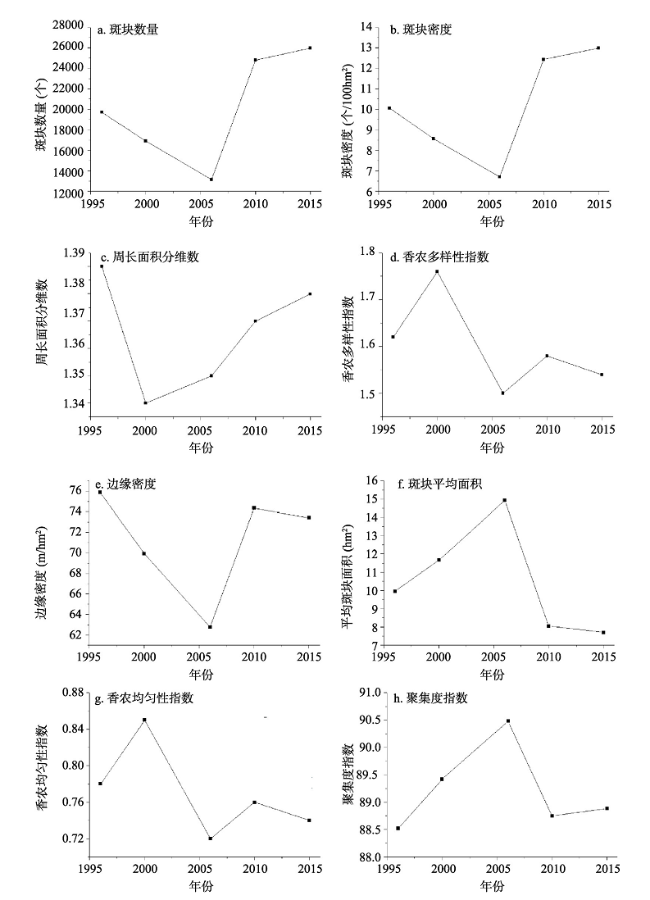
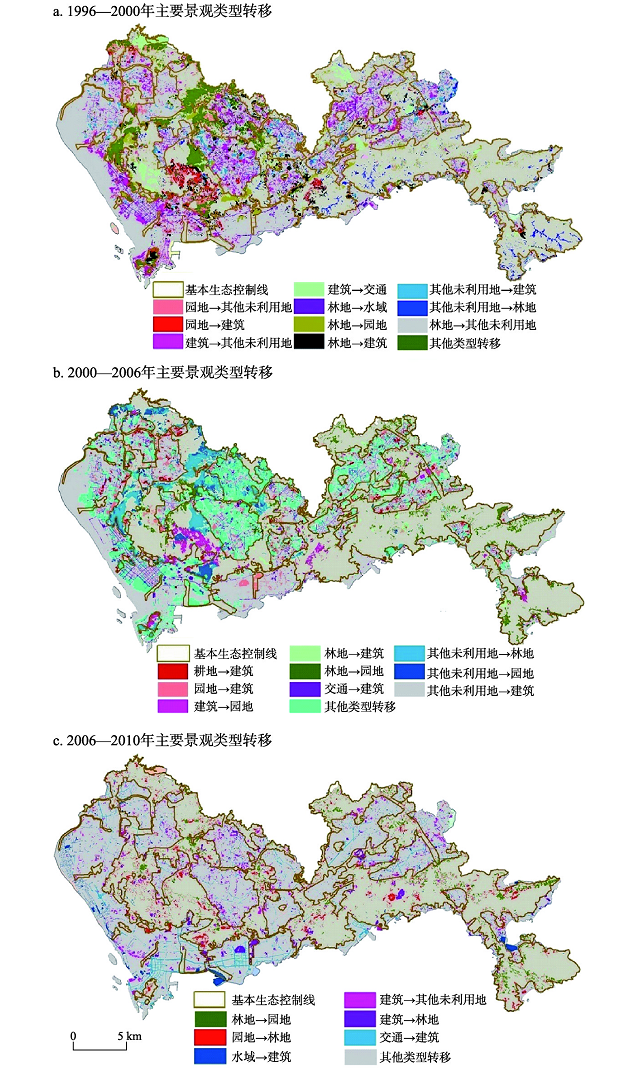
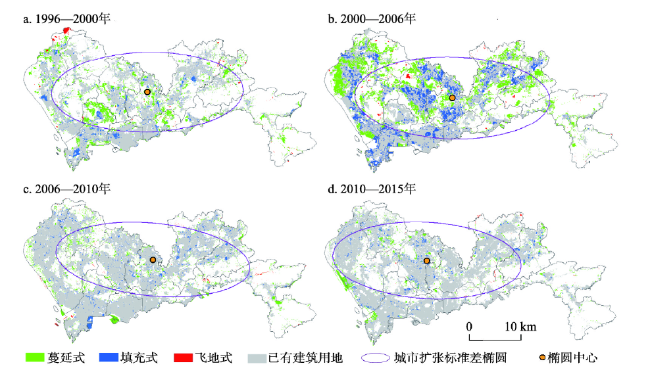
基于深圳市1996—2015年土地利用数据,利用景观指数、景观转移矩阵和景观扩张指数等方法探究了深圳市近20年景观格局时空变化、主要景观类型转移和建筑用地扩张模式,最后使用Binary Logit模型考察了市级和区级建筑用地景观扩张的主要驱动因素。结果表明:① 1996—2015年,深圳市建筑用地景观优势性逐步增强,面积增加15.81%,以蔓延式(61.9%)和填充式(36.27%)扩张为主;② 1996—2006年为城市化快速扩张期,建筑用地扩张呈集中开发形态,景观多样性和均匀性增加,城市扩张中心略微向北部和东部移动,2006—2015为城市化低速过渡期,景观破碎化加剧,城市扩张重心向北部和西部偏移;③ 在市级尺度上,GDP密度和人口密度对建筑用地景观扩张有显著正影响,生态控制线、高程、坡度和至道路的距离有着显著负影响。每单位生态控制线范围、坡度的增加分别将使建筑用地景观扩张的机会比率将平均减少到原来0.8168倍、0.8841倍。各驱动因素表现出区域和尺度差异性,GDP对宝安区、南山区和坪山区,人口增长对宝安区、龙华区,以及交通可达性对大鹏新区、龙岗区驱动分别最为突出。研究结果可以为中国城市快速扩张过程中的景观格局变化提供科学实践。
吴健生 , 罗可雨 , 赵宇豪 . 深圳市近20年城市景观格局演变及其驱动因素[J]. 地理研究, 2020 , 39(8) : 1725 -1738 . DOI: 10.11821/dlyj020190539
Since China's reform and opening up, Shenzhen has experienced rapid urbanization and dramatic changes in landscape patterns. On the basis of the land use dataset of Shenzhen city from 1996 to 2015, this study utilized landscape metrics, transition matrix and, expansion index to detect the spatiotemporal changes of urban landscape pattern, which analyzed the trend of landscape transfer and urban expansion. Also the major driving forces for landscape pattern changes on municipal and district scales were identified through the Binary Logit regression model. The results showed that: (1) the dominance of construction land landscape in Shenzhen gradually increased during the study period, with the construction land increasing by 15.81%, which occupied a large area of woodland (157.59 km²). The edge-expansion and infilling are the two main growth types of newly developed urban land, accounting for 61.19% and 36.27% respectively. (2) The rapid urbanization occurred from 1996 to 2006, during which landscape diversity and uniformity increased. (3) There was a low-speed urbanization transition from 2006 to 2015, during which landscape fragmentation intensified. The boundaries of the built-up areas became complex. However, due to the influence of land policy and red line of ecological protection, the rate of urban expansion slowed down. The pattern of urban expansion was mainly west-oriented, with the center continuing to shift northwards. (4) On the municipal scale, the GDP density and population density had a significant positive impact on the evolution of landscape pattern, while the ecological control line, elevation, slope and the distance to the road had a significant negative impact. The driving factors had the difference in scale and region, with GDP in Baoan, Nanshan and Pingshan districts, population growth in Baoan and Longhua districts, and traffic accessibility in Dapeng and Longgang districts being the most prominent drivers, respectively. This study can provide scientific practice for landscape pattern change in the process of rapid urban expansion in China.
表1 景观格局指数Tab. 1 Landscape pattern index |
| 景观格局指数 | 指标名称 | 指标意义 |
|---|---|---|
| CA | 斑块类型面积,单位:hm² | 反映景观中优势斑块类型。 |
| PLAND | 斑块类型所占景观面积的比例,单位:% | 反映景观面积的比例 |
| NP | 斑块个数,单位:个 | 反映景观异质性和破碎度。 |
| PD | 斑块密度,单位:个/100 hm2 | 斑块数量特征,反映景观异质性和破碎度。PD值越大,表明景观斑块破碎度越大。 |
| ED | 边缘密度,单位:m/hm² | 表征景观被边界分割的程度,ED值越大,表明斑块形状越复杂,景观被边界分割的程度越高。 |
| AREA_MN | 平均斑块面积,单位:hm² | 表征景观的破碎化程度,值减小说明景观的破碎化程度上升,反之则下降。 |
| AI | 聚集度指数 | 反映景观要素的聚集程度。AI的取值范围为[0, 100]。当AI接近于100时,斑块聚集越紧密,景观内部以少量大斑块为主或者斑块高度相连;当AI趋近于0时,景观中斑块离散程度越大,该类型景观由越多离散的小斑块组成。 |
| PAFRAC | 周长面积分维数 | 反映形状的复杂性,其值范围为[1, 2],PAFRAC接近于1表明景观边界形状非常简单,如正方形,接近于2表明边界形状非常复杂。 |
| SHDI | 香农多样性指数 | 体现景观水平复杂程度,斑块丰富度越大或不同斑块面积分布越均匀时,SHDI值越大。 |
| SHEI | 香农均匀度指数 | 表征城市土地利用的均质性的强弱。SHEI取值范围为[0, 1],SHEI越接近1表明斑块类型分布越均匀,多样性越强;SHEI趋于0时,景观分布极不均匀,优势斑块控制度强。 |
表2 深圳市城市景观变化驱动因素Tab. 2 Driving forces of urban landscape change in Shenzhen |
| 变量类别 | 变量 | 单位 |
|---|---|---|
| 社会经济 | GDP密度 | 万元/km2 |
| 人口密度 | 万人/km2 | |
| 土地政策 | 基本生态控制线 | - |
| 自然条件 | 高程 | m |
| 坡度 | ° | |
| 至水库、湖泊的距离 | m | |
| 至河流水系的距离 | m | |
| 可达性 | 至铁路、轻轨的距离 | m |
| 至公路的距离 | m | |
| 局地邻近 | 距离居街道居委会距离 | m |
表3 1996—2015年深圳市景观类型面积及其占比变化Tab. 3 Changes of landscape area and proportion in Shenzhen during 1996-2015 |
| 景观类型 | CA(km²) | PLAND(%) | |||||||||
|---|---|---|---|---|---|---|---|---|---|---|---|
| 1996年 | 2000年 | 2006年 | 2010年 | 2015年 | 1996年 | 2000年 | 2006年 | 2010年 | 2015年 | ||
| 耕地 | 70.68 | 90.75 | 50.39 | 43.85 | 50.41 | 3.61 | 4.63 | 2.54 | 2.20 | 2.51 | |
| 园地 | 221.19 | 185.22 | 269.73 | 236.83 | 207.86 | 11.28 | 9.44 | 13.76 | 11.87 | 10.39 | |
| 林地 | 736.02 | 571.96 | 581.57 | 586.62 | 578.43 | 37.52 | 29.03 | 29.68 | 29.41 | 28.92 | |
| 草地 | 4.16 | 5.33 | 10.26 | 32.88 | 25.03 | 0.21 | 0.27 | 0.52 | 1.65 | 1.25 | |
| 建筑用地 | 502.55 | 461.54 | 774.37 | 752.35 | 828.70 | 25.62 | 23.48 | 39.51 | 37.72 | 41.43 | |
| 交通用地 | 27.17 | 78.97 | 91.83 | 88.29 | 100.44 | 1.39 | 4.02 | 4.69 | 4.43 | 5.02 | |
| 水域 | 230.64 | 226.82 | 172.56 | 167.56 | 157.64 | 11.76 | 11.56 | 8.80 | 8.40 | 7.88 | |
| 其他未利用地 | 169.08 | 334 | 9.06 | 86.09 | 51.60 | 8.62 | 17.02 | 0.46 | 4.32 | 2.58 | |
表4 1996—2015年深圳市不同城市扩张模式面积与占比Tab. 4 The area and proportion of different urban expansion modes during 1996-2015 |
| 时期 | 飞地式(km2) | 蔓延式(km2) | 填充式(km2) | 总计(km2) | 占比(%) |
|---|---|---|---|---|---|
| 1996—2000年 | 8.29 | 139.23 | 51.05 | 198.57 | 23.18 |
| 2000—2006年 | 7.24 | 252.57 | 166.58 | 426.39 | 49.78 |
| 2006—2010年 | 4.45 | 76.37 | 53.69 | 134.51 | 15.71 |
| 2010—2015年 | 1.78 | 55.90 | 39.37 | 97.05 | 11.33 |
| 总计 | 21.76 | 524.07 | 310.69 | 856.52 | 100.00 |
| 占比(%) | 2.54 | 61.19 | 36.27 | 100.00 |
表5 Binary Logit回归模型参数与检验Tab. 5 Parameters and tests of Binary Logit regression models |
| 深圳区 | 宝安区 | 大鹏新区 | 福田区 | 光明区 | 龙岗区 | 龙华区 | 罗湖区 | 南山区 | 坪山区 | 盐田区 | ||||||||||||||||||||||
|---|---|---|---|---|---|---|---|---|---|---|---|---|---|---|---|---|---|---|---|---|---|---|---|---|---|---|---|---|---|---|---|---|
| 系数 | P值 | 系数 | P值 | 系数 | P值 | 系数 | P值 | 系数 | P值 | 系数 | P值 | 系数 | P值 | 系数 | P值 | 系数 | P值 | 系数 | P值 | 系数 | P值 | |||||||||||
| 常数项 | 1.715262 | 0.000 | -1.164249 | 0.143 | 4.261677 | 0.051 | -10.056060 | 0.262 | 2.886854 | 0.010 | 4.261600 | 0.000 | 0.500071 | 0.677 | 1.631017 | 0.551 | 4.987378 | 0.001 | -2.166807 | 0.244 | 1.079330 | 0.864 | ||||||||||
| GDP密度 | 0.000049 | 0.000 | 0.000128 | 0.000 | 0.000035 | 0.643 | -0.000276 | 0.258 | 0.000006 | 0.903 | 0.000006 | 0.722 | 0.000001 | 0.969 | 0.000030 | 0.827 | 0.000143 | 0.031 | 0.000091 | 0.024 | -0.000150 | 0.452 | ||||||||||
| 人口密度 | 0.000652 | 0.096 | 0.002423 | 0.019 | 0.002319 | 0.446 | 0.021365 | 0.125 | 0.000822 | 0.671 | -0.001277 | 0.121 | 0.003953 | 0.002 | -0.005364 | 0.165 | -0.012242 | 0.000 | 0.002201 | 0.275 | 0.012548 | 0.075 | ||||||||||
| 生态 控制线 | -0.202301 | 0.000 | -0.139287 | 0.004 | 0.155235 | 0.201 | -0.592863 | 0.065 | -0.154320 | 0.006 | -0.265578 | 0.000 | -0.295552 | 0.000 | 0.187390 | 0.383 | -0.383631 | 0.001 | -0.134058 | 0.055 | -0.329009 | 0.481 | ||||||||||
| 高程 | -0.007599 | 0.000 | -0.005788 | 0.007 | -0.023706 | 0.000 | -0.026796 | 0.204 | -0.006354 | 0.250 | -0.013953 | 0.000 | -0.011181 | 0.002 | -0.013120 | 0.003 | -0.020943 | 0.000 | -0.017451 | 0.000 | -0.025301 | 0.001 | ||||||||||
| 坡度 | -0.123176 | 0.000 | -0.142193 | 0.000 | -0.059052 | 0.038 | -0.133312 | 0.171 | -0.157702 | 0.000 | -0.142611 | 0.000 | -0.093219 | 0.000 | -0.053011 | 0.108 | -0.097448 | 0.002 | -0.079402 | 0.003 | -0.134423 | 0.010 | ||||||||||
| 至水库、湖泊距离 | 0.000002 | 0.769 | 0.000005 | 0.789 | -0.000304 | 0.001 | 0.000339 | 0.330 | -0.000099 | 0.005 | -0.000003 | 0.859 | -0.000019 | 0.663 | 0.000153 | 0.398 | 0.000194 | 0.046 | 0.000133 | 0.165 | 0.000527 | 0.074 | ||||||||||
| 至河流水系距离 | -0.000018 | 0.392 | 0.000144 | 0.018 | -0.000416 | 0.001 | -0.000330 | 0.483 | -0.000126 | 0.155 | -0.000048 | 0.478 | 0.000241 | 0.025 | 0.001081 | 0.041 | -0.000068 | 0.641 | -0.000138 | 0.114 | -0.000285 | 0.563 | ||||||||||
| 至铁路、轻轨距离 | -0.000053 | 0.000 | 0.000085 | 0.106 | -0.000090 | 0.021 | 0.001789 | 0.248 | -0.000095 | 0.187 | -0.000251 | 0.000 | -0.000031 | 0.613 | -0.001013 | 0.004 | -0.000033 | 0.851 | 0.000307 | 0.000 | -0.000375 | 0.359 | ||||||||||
| 至公路 距离 | -0.000151 | 0.000 | 0.000095 | 0.276 | -0.001015 | 0.001 | -0.001584 | 0.097 | -0.000449 | 0.000 | -0.000251 | 0.010 | -0.000239 | 0.217 | 0.000386 | 0.486 | -0.000024 | 0.880 | 0.000066 | 0.671 | 0.000696 | 0.219 | ||||||||||
| 至街道居委会距离 | -0.031493 | 0.180 | 0.036157 | 0.507 | 0.253103 | 0.196 | -0.215321 | 0.622 | 0.077001 | 0.442 | -0.013348 | 0.801 | -0.073638 | 0.232 | 0.085024 | 0.735 | 0.107835 | 0.386 | 0.050566 | 0.613 | -1.060136 | 0.096 | ||||||||||
| LRstatistic | 2449 | 696 | 310 | 63 | 257 | 695 | 328 | 53 | 241 | 375 | 88 | |||||||||||||||||||||
| P值(LR-statistic) | 0.000 | 0.000 | 0.000 | 0.000 | 0.000 | 0.000 | 0.000 | 0.000 | 0.000 | 0.000 | 0.000 | |||||||||||||||||||||
| ROC | 0.8449 | 0.8481 | 0.8472 | 0.9135 | 0.8438 | 0.8253 | 0.8091 | 0.8114 | 0.8590 | 8.8612 | 0.8664 | |||||||||||||||||||||
表6 深圳及各区的景观演变驱动力Tab. 6 Driving forces of landscape evolution in Shenzhen and its districts |
| 变量 | 深圳区 | 宝安区 | 大鹏新区 | 福田区 | 光明区 | 龙岗区 | 龙华区 | 罗湖区 | 南山区 | 坪山区 | 盐田区 |
|---|---|---|---|---|---|---|---|---|---|---|---|
| GDP密度 | ★ | ★ | ○ | ○ | ○ | ○ | ○ | ○ | ★ | ★ | ○ |
| 人口密度 | ★ | ★ | ○ | ○ | ○ | ○ | ★ | ○ | ☆ | ○ | ○ |
| 生态控制线 | ☆ | ☆ | ○ | ☆ | ☆ | ☆ | ☆ | ○ | ☆ | ☆ | ★ |
| 高程 | ☆ | ☆ | ☆ | ○ | ○ | ☆ | ☆ | ☆ | ☆ | ☆ | ☆ |
| 坡度 | ☆ | ☆ | ☆ | ○ | ☆ | ☆ | ☆ | ○ | ☆ | ☆ | ☆ |
| 至水库、湖泊距离 | ○ | ○ | ☆ | ○ | ☆ | ○ | ○ | ○ | ★ | ○ | ★ |
| 至河流水系距离 | ○ | ★ | ☆ | ○ | ○ | ○ | ★ | ★ | ○ | ○ | ○ |
| 至铁路、轻轨距离 | ☆ | ○ | ☆ | ○ | ○ | ☆ | ○ | ☆ | ○ | ★ | ○ |
| 至公路距离 | ☆ | ○ | ☆ | ☆ | ☆ | ☆ | ○ | ○ | ○ | ○ | ○ |
| 至街道居委会距离 | ○ | ○ | ☆ | ○ | ○ | ○ | ★ | ○ | ★ | ○ | ☆ |
注:★代表显著正影响(P<0.1);☆代表显著负影响(P<0.1);○代表无显著影响(P<0.1)。 |
真诚感谢匿名评审专家对本文引言梳理、驱动力分析部分的研究思路和科研论文措辞的修改意见,使本文获益匪浅。
| [1] |
|
| [2] |
|
| [3] |
|
| [4] |
|
| [5] |
谢启姣, 刘进华, 胡道华 . 武汉城市扩张对热场时空演变的影响. 地理研究, 2016,35(7):1259-1272.
[
|
| [6] |
|
| [7] |
陈喜东, 石培基, 王川 , 等. 不同情景下河谷型城市建设用地扩张的景观生态格局响应: 以兰州市为例. 生态学杂志, 2018,37(11):3381-3389.
[
|
| [8] |
阳文锐 . 北京城市景观格局时空变化及驱动力. 生态学报, 2015,35(13):4357-4366.
[
|
| [9] |
谢苗苗, 王仰麟, 李贵才 , 等. 不同城市化阶段景观演变的热环境效应动态: 以深圳西部地区为例. 地理研究, 2009,28(4):1085-1094.
[
|
| [10] |
刘小平, 黎夏, 陈逸敏 , 等. 景观扩张指数及其在城市扩展分析中的应用. 地理学报, 2009,64(12):1430-1438.
[
|
| [11] |
张安琪, 夏畅, 林坚 , 等. 景观演化特征指数及其应用. 地理科学进展, 2018,37(6):811-822.
[
|
| [12] |
|
| [13] |
Kovács, Zoltán, Farkas, et al. Urban sprawl and land conversion in post-socialist cities: The case of metropolitan Budapest. Cities, 2019,92:71-81.
|
| [14] |
林目轩, 师迎春, 陈秧分 , 等. 长沙市区建设用地扩张的时空特征. 地理研究, 2007,26(2):265-274, 426.
[
|
| [15] |
别小娟, 孙涛, 孙然好 , 等. 京津冀城市群空间扩张及其经济溢出效应. 生态学报, 2018,38(12):4276-4285.
[
|
| [16] |
陈江龙, 高金龙, 徐梦月 , 等. 南京大都市区建设用地扩张特征与机理. 地理研究, 2014,33(3):427-438.
[
|
| [17] |
|
| [18] |
黎夏, 刘小平 . 基于案例推理的元胞自动机及大区域城市演变模拟. 地理学报, 2007,62(10):1097-1109.
[
|
| [19] |
|
| [20] |
潘竟虎, 苏有才, 黄永生 , 等. 近30年玉门市土地利用与景观格局变化及其驱动力. 地理研究, 2012,31(9):1631-1639.
[
|
| [21] |
|
| [22] |
高金龙, 陈江龙, 袁丰 , 等. 南京市区建设用地扩张模式、功能演化与机理. 地理研究, 2014,33(10):1892-1907.
[
|
/
| 〈 |
|
〉 |