
粤港澳大湾区人口老龄化时空特征及其经济效应
|
李琼(1972-), 女, 湖南桑植人, 教授, 博导, 研究方向为区域经济。E-mail: sisi_9672@163.com |
收稿日期: 2020-05-06
要求修回日期: 2020-09-08
网络出版日期: 2020-11-20
基金资助
粤港澳大湾区战略研究院建设专项(2019GDASYL-0202001)
广东省科学院发展专项(2020GDASYL-20200102002)
湖南省自然科学基金面上项目(2020JJ4503)
版权
The spatio-temporal characteristics of the Guangdong-Hong Kong-Macao Greater Bay Area's population aging and its economic effects
Received date: 2020-05-06
Request revised date: 2020-09-08
Online published: 2020-11-20
Copyright
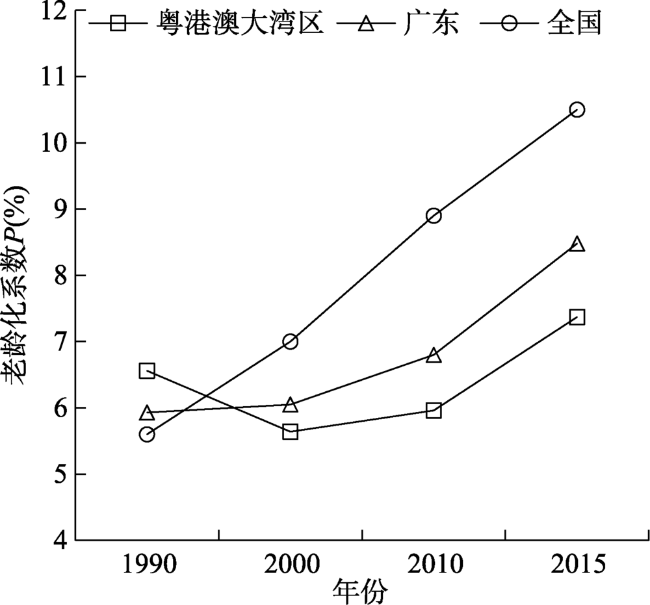
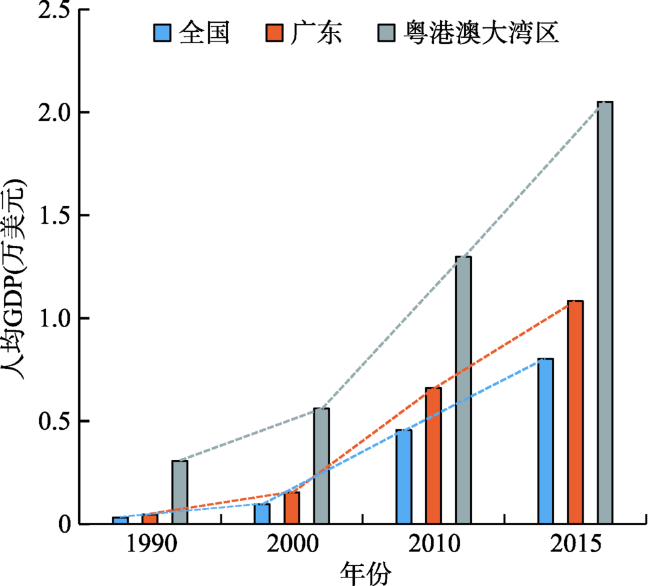
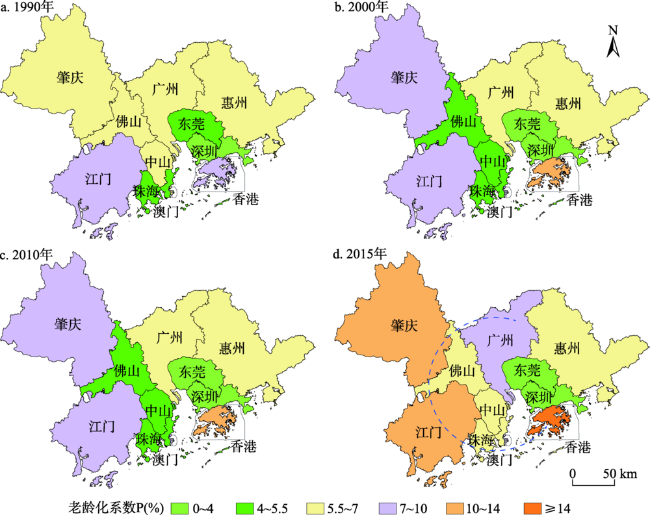
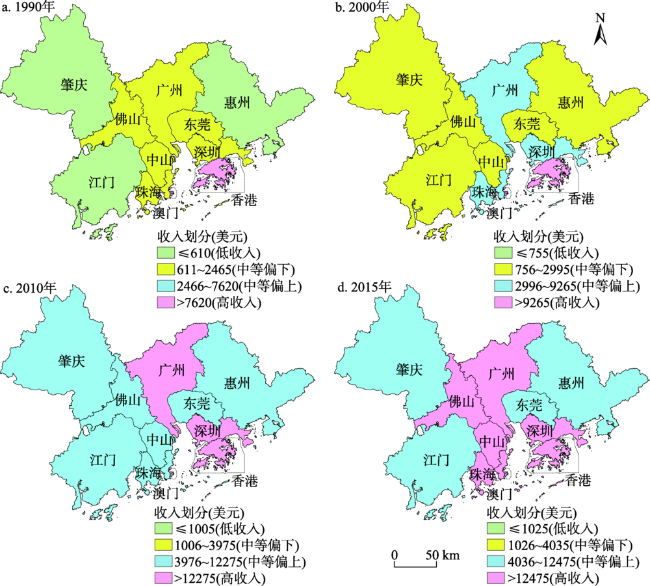
中国新时代“两个十五年”的现代化强国战略周期,恰恰是快速人口老龄化纵深发展期,人口年龄结构快速老龄化与经济社会之间的发展不平衡矛盾将日益严峻。本文利用广东省第四次、第五次、第六次人口普查资料、2015年广东省1%人口抽样调查资料、香港统计年刊和澳门统计年鉴数据,运用空间自相关分析法、柯布-道格拉斯生产函数和空间回归等方法,研究2000—2015年粤港澳大湾区人口老龄化的时空特征及其经济效应,结果表明:① 粤港澳大湾区人口老龄化进程慢于广东省,更慢于全国,但于2015年已进入老年型I期。② 粤港澳大湾区老龄化呈动态演变特征,空间上以香港和江门为起点,经西北向北扩散的“C”型分布模式,高收入城市以澳门和香港为起点向北扩散,最终形成中心-外围的空间分布格局。③ 粤港澳大湾区人口老龄化对经济增长具有负向影响,老龄人口增加1%,人均GDP降低3%。人均固定资本投入和人均人力资本投入有正的经济效应,人均人力资本投入带来的正向效应要大于人均固定资本投入。鉴于此,粤、港、澳三地应建立起协同治理模式,构建跨境的养老合作机制;促进产业结构升级,充分利用人力资本促进技术创新,并正确评估不同阶段人口老龄化对经济增长的影响,妥善处理好人口老龄化与经济之间的关系至关重要。
李琼 , 李松林 , 张蓝澜 , 李昊 , 刘毅 . 粤港澳大湾区人口老龄化时空特征及其经济效应[J]. 地理研究, 2020 , 39(9) : 2130 -2147 . DOI: 10.11821/dlyj020200360
The strategic cycle of "two fifteen years" of China's modernization in the new era is exactly the period of rapid population aging, and the imbalance between the rapid aging of the population age structure and the development of the economy and society will become increasingly serious. This paper uses the data of the fourth, fifth and sixth censuses of Guangdong Province, the sample survey data of 1% population in Guangdong Province in 2015, the data of Hong Kong Statistical Yearbook and Macao Statistical Yearbook. Spatial autocorrelation analysis, Cobb Douglas production function and spatial regression methods were used in this study, the spatio-temporal characteristics and economic effects of population aging in the Guangdong-Hong Kong-Macao Greater Bay Area from 2000 to 2015 were studied. The results of our study show that: (1) The aging process of population in the Greater Bay Area is slower than that of Guangdong and even slower than that of the whole country, but it transformed into the senile type I in 2015. (2) The aging coefficient of the study area shows a dynamic evolution feature. The spatial pattern of "C" type started from Hong Kong and Jiangmen of Guangdong and spread northward through the northwest. High income cities spread northward from Macao and Hong Kong, and finally formed a center-periphery distribution pattern. (3) The aging population in the Greater Bay Area has a negative impact on economic growth. The aging population increased by 1%, and the per capita GDP decreased by 3%. Per capita fixed capital investment and per capita human capital investment had positive effect on economic growth, and the positive effect of per capita human capital investment was greater than that of per capita fixed capital investment. In view of this, Guangdong, Hong Kong and Macao should establish a collaborative governance model and build a cross-border pension cooperation mechanism. It is essential to promote industrial restructuring and encourage technological innovation, assess the impact of population aging on economic growth at different stages, and handle the relationship between population aging and economy.
表1 老龄化系数与人口年龄结构Tab. 1 Aging coefficient and population age structure (%) |
| 老龄化系数(P) | 人口结构类型 | 老龄化系数(P) | 人口结构类型 |
|---|---|---|---|
| P < 4.0 | 年轻型 | 7~10 | 老年型I期 |
| 4.0~5.5 | 成年型I期 | 10~14 | 老年型II期 |
| 5.5~7.0 | 成年型II期 | P≥14.0 | 老年型III期 |
表2 1990—2015年粤港澳大湾区人口年龄结构演变情况Tab. 2 Evolution of population age structure in the Guangdong-Hong Kong-Macao Greater Bay Area from 1990 to 2015 |
| 1990年 | 2000年 | 2010年 | 2015年 | |
|---|---|---|---|---|
| 深圳 | 年轻型 | 年轻型 | 年轻型 | 年轻型 |
| 东莞 | 成年型I期 | 年轻型 | 年轻型 | 年轻型 |
| 惠州 | 成年型II期 | 成年型II期 | 成年型II期 | 成年型II期 |
| 中山 | 成年型II期 | 成年型I期 | 成年型I期 | 成年型II期 |
| 佛山 | 成年型II期 | 成年型I期 | 成年型I期 | 成年型II期 |
| 珠海 | 成年型I期 | 成年型I期 | 成年型I期 | 成年型II期 |
| 广州 | 成年型II期 | 成年型II期 | 成年型II期 | 老年型I期 |
| 肇庆 | 成年型II期 | 老年型I期 | 老年型I期 | 老年型II期 |
| 澳门 | 成年型II期 | 老年型I期 | 老年型I期 | 老年型I期 |
| 江门 | 老年型I期 | 老年型I期 | 老年型I期 | 老年型II期 |
| 香港 | 老年型I期 | 老年型II期 | 老年型II期 | 老年型III期 |
| 区域平均 | 成年型II期 | 成年型II期 | 成年型II期 | 老年型I期 |
| 全国 | 成年型II期 | 老年型I期 | 老年型I期 | 老年型II期 |
表3 粤港澳大湾区人均GDP与人口老龄化系数 |
| 地区 | 1990年 | 2000年 | 2010年 | 2015年 | |||||||
|---|---|---|---|---|---|---|---|---|---|---|---|
| 人均GDP | 老龄化系数 | 人均GDP | 老龄化系数 | 人均GDP | 老龄化系数 | 人均GDP | 老龄化系数 | ||||
| 广州 | 1038 | 6.30 | 3095 | 6.10 | 12918 | 6.67 | 21860 | 7.92 | |||
| 佛山 | 869 | 6.77 | 2443 | 5.25 | 11863 | 5.25 | 17383 | 6.79 | |||
| 肇庆 | 325 | 6.23 | 896 | 7.86 | 4134 | 9.08 | 7812 | 10.2 | |||
| 深圳 | 1321 | 2.22 | 3961 | 1.23 | 13929 | 1.79 | 25359 | 2.90 | |||
| 东莞 | 950 | 4.99 | 1652 | 2.09 | 7799 | 2.29 | 12137 | 3.74 | |||
| 惠州 | 418 | 5.94 | 1676 | 6.23 | 5709 | 5.91 | 10631 | 6.55 | |||
| 珠海 | 1057 | 4.62 | 3354 | 4.03 | 11505 | 5.01 | 20026 | 6.64 | |||
| 中山 | 733 | 6.28 | 1821 | 4.62 | 8980 | 4.43 | 15093 | 5.73 | |||
| 江门 | 509 | 7.94 | 1552 | 8.66 | 5262 | 9.08 | 7963 | 11.39 | |||
| 香港 | 13110 | 8.46 | 25319 | 10.94 | 32550 | 13.08 | 42430 | 15.29 | |||
| 澳门 | 10041 | 6.59 | 14879 | 7.08 | 52650 | 7.38 | 70795 | 8.98 | |||
| 区域平均 | 3070 | 6.56 | 5609 | 5.64 | 12980 | 5.96 | 20509 | 7.37 | |||
注:表中数据按照当年汇率将港币、澳门和人民币折算成美元,人口老龄化系数等于65岁人口与总人口之比。 |
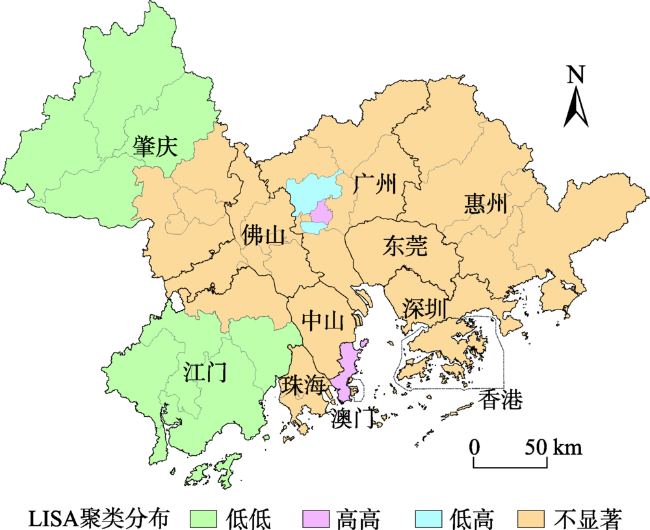
表4 粤港澳大湾区全局人均GDP Moran’s I统计量检验结果Tab. 4 Moran ’s I test results of the global per capita GDP of the Guangdong-Hong Kong-Macao Greater Bay Area |
| Moran’s I | E(I) | SD | Z值 | P值 |
|---|---|---|---|---|
| 0.2681 | -0.0233 | 0.1045 | 2.7832 | 0.0170 |
表5 粤港澳大湾区人口老龄化对经济增长影响的回归结果Tab. 5 Regression results of the impact of population aging on economic growth in the Guangdong-Hong Kong-Macao Greater Bay Area |
| 被解释变量:ln Y | |||
|---|---|---|---|
| Variable | OLS | SEM | SAR |
| Constant | -11.4904*** (1.93) | -13.4848*** (1.45) | -11.1651*** (1.81) |
| p | -0.0343** (0.02) | -0.0291** (0.01) | -0.0284* (0.02) |
| ln K | 0.5694*** (0.10) | 0.5799*** (0.08) | 0.5519*** (0.10) |
| ln L | 1.5501*** (0.18) | 1.7165*** (0.13) | 1.3829*** (0.20) |
| Rho | — | — | 0.1468 (1.17) |
| Lambda | — | -0.5047** (0.20) | — |
| Adj-R-squared | 0.7955 | — | — |
| AIC | 23.7043 | 19.9447 | 24.6494 |
| SC | 30.8411 | 27.0815 | 33.5703 |
| Log likelihood | -7.8522 | -5.9723 | -7.3247 |
注:括号内数值表示标准差;*、**、***分别表示在10%、5%和1%的显著性水平下显著。 |
表6 经济距离权重矩阵和地理距离权重矩阵下模型回归结果Tab. 6 Model regression results under economic distance weight matrix and geographical distance weight matrix |
| 被解释变量:ln Y | |||||
|---|---|---|---|---|---|
| Variable | 经济距离权重 | 地理距离权重 | |||
| SEM | SAR | SEM | SAR | ||
| Constant | -15.7945*** (2.46) | -10.7587*** (1.66) | -11.4904*** (1.90) | -22.2587*** (2.03) | |
| p | -0.0449*** (0.01) | -0.0459*** (0.01) | -0.0343** (0.02) | -0.0350** (0.02) | |
| lnK | 0.5545*** (0.08) | 0.548*** (0.08) | 0.5694*** (0.10) | 0.5815*** (0.09) | |
| lnL | 1.5381*** (0.15) | 1.5185*** (0.15) | 1.5501*** (0.17) | 1.5828*** (0.17) | |
| Rho | — | -0.3146*** (0.10) | — | 0.9091*** (0.06) | |
| Lambda | -0.3006*** (0.10) | — | 1.1000*** (0.07) | — | |
| Adj-R-squared | — | — | — | — | |
| AIC | 18.7555 | 18.8029 | 22.2710 | 24.2710 | |
| SC | 29.4607 | 29.5080 | 29.4077 | 33.1919 | |
| Log likelihood | -3.3778 | -3.4015 | -7.1355 | -7.1355 | |
注:括号内数值表示标准差;**、***分别表示在5%和1%的显著性水平下显著。 |
表7 1990—2018年香港人口年龄结构演变情况Tab. 7 Evolution of the age structure of Hong Kong's population from 1990 to 2018 |
| 年份 | 老龄化系数(%) | 类型 | 人均GDP(美元) | 年份 | 老龄化系数(%) | 类型 | 人均GDP(美元) |
|---|---|---|---|---|---|---|---|
| 1990 | 8.46 | 老年型I期 | 13110 | 2005 | 12.25 | 老年型II期 | 26093 |
| 1991 | 8.73 | 老年型I期 | 14955 | 2006 | 12.43 | 老年型II期 | 27697 |
| 1992 | 9.00 | 老年型I期 | 17356 | 2007 | 12.61 | 老年型II期 | 29902 |
| 1993 | 9.25 | 老年型I期 | 19659 | 2008 | 12.69 | 老年型II期 | 30871 |
| 1994 | 9.51 | 老年型I期 | 21673 | 2009 | 12.89 | 老年型II期 | 30696 |
| 1995 | 9.78 | 老年型I期 | 22765 | 2010 | 13.08 | 老年型II期 | 32550 |
| 1996 | 10.12 | 老年型II期 | 24702 | 2011 | 13.31 | 老年型II期 | 35142 |
| 1997 | 10.42 | 老年型II期 | 27169 | 2012 | 13.70 | 老年型II期 | 36732 |
| 1998 | 10.66 | 老年型II期 | 25507 | 2013 | 14.27 | 老年型III期 | 38403 |
| 1999 | 10.93 | 老年型II期 | 24713 | 2014 | 14.71 | 老年型III期 | 40315 |
| 2000 | 10.94 | 老年型II期 | 25319 | 2015 | 15.29 | 老年型III期 | 42430 |
| 2001 | 11.22 | 老年型II期 | 24771 | 2016 | 15.85 | 老年型III期 | 43735 |
| 2002 | 11.52 | 老年型II期 | 24120 | 2017 | 16.43 | 老年型III期 | 46221 |
| 2003 | 11.82 | 老年型II期 | 23293 | 2018 | 16.99 | 老年型III期 | 48672 |
| 2004 | 12.07 | 老年型II期 | 24454 |
注:表中数据按照当年汇率将港币换算成美元。 |
表8 ADF单位根检验Tab. 8 ADF unit root test |
| 变量 | ADF检验 | 各显著性水平的临界值 | ||
|---|---|---|---|---|
| 0.01 | 0.05 | 0.10 | ||
| lnY | -2.4939 | -4.6679 | -3.7332 | -3.3103 |
| D(lnY) | -3.4700 | -3.9591 | -3.0810 | -2.6813 |
| lnK | -2.6971 | -4.8000 | -3.7912 | -3.3423 |
| D(lnK) | -7.6940 | -4.8000 | -3.7912 | -3.3423 |
| lnL | -1.9862 | -4.6679 | -3.7332 | -3.3103 |
| D(lnL) | -4.0244 | -3.9591 | -3.0810 | -2.6813 |
| O | -2.1373 | -4.6679 | -3.7332 | -3.3103 |
| D(O) | -2.8201 | -4.7283 | -3.7597 | -3.3249 |
| D(D(O)) | -5.3735 | -4.0044 | -3.0989 | -2.6904 |
表9 Johansen协整检验结果Tab. 9 Johansen cointegration test results |
| 假设条件 | Eigenvalue | Trace Statistic | 5% Crititical Value | Prob. |
|---|---|---|---|---|
| None | 0.9827 | 99.2744 | 47.8561 | 0.0000 |
| At most 1 | 0.9094 | 42.4794 | 29.7971 | 0.0011 |
| At most 2 | 0.3907 | 8.8550 | 15.4947 | 0.3790 |
表10 人口老龄化对经济影响的回归结果Tab. 10 regression results of the impact of population aging on economy |
| Variable | Coefficient | Std.Error | t-statistic | Prob. |
|---|---|---|---|---|
| Constant | -27.3322 | 4.7933 | -5.7022 | 0.0001 |
| lnL | 2.4437 | 0.4038 | 6.0521 | 0.0001 |
| D(p) | -0.4053 | 0.1842 | -2.2004 | 0.0481 |
| lnK | 1.0160 | 0.1315 | 7.7271 | 0.0000 |
| R-squared | 0.9010 | Mean dependent var | 12.3441 | |
| Adjusted R-squared | 0.8763 | S.D. dependent var | 0.1869 | |
| S.E. of regression | 0.0657 | Akaike info criterion | -2.3937 | |
| Sum squared resid | 0.0519 | Schwarz criterion | -2.2005 | |
| Log likelihood | 23.1496 | Hannan-Quinn criter. | -2.3838 | |
| F-statistic | 36.4117 | Durbin-Watson stat | 2.0637 | |
| Prob(F-statistic) | 0.0000 | |||
| Sample(adjusted):1997:2012 | ||||
真诚感谢二位匿名专家在评审过程中所付出的时间和精力,评审专家对本文的研究方法、逻辑结构、结论与讨论方面的修改意见,使本文获益非浅。
| [1] |
孙鹃娟, 高秀文. 国际比较中的中国人口老龄化: 趋势、特点及建议. 教学与研究, 2018, (5): 59-66.
[
|
| [2] |
原新, 刘志晓, 金牛. 从追赶到超越: 中国老龄社会的演进与发展之路. 新疆师范大学学报: 哲学社会科学版, 2020, (2): 1-9.
[
|
| [3] |
曾通刚, 赵媛. 中国老龄事业发展水平时空演化及其与经济发展水平的空间匹配. 地理研究, 2019, 38(6): 1497-1511.
[
|
| [4] |
|
| [5] |
|
| [6] |
|
| [7] |
|
| [8] |
|
| [9] |
高晓路, 吴丹贤, 许泽宁, 等. 中国老龄化地理学综述和研究框架构建. 地理科学进展, 2015, 34(12): 1480-1494.
[
|
| [10] |
陆杰华, 刘芹. 改革开放40年来中国老龄研究的进展、创新及展望. 中共福建省委党校学报, 2018, (12): 76-85.
[
|
| [11] |
刘玉飞. 人口老龄化背景下城市化对劳动力供给的影响效应分析. 统计与决策, 2019, 35(18): 103-106.
[
|
| [12] |
豆建春. 老龄化对创新的影响: 效应、机制及其对中国的启示. 人口与经济, 2019, (5): 78-93.
[
|
| [13] |
刘成坤, 赵昕东. 人口老龄化对中国产业结构升级的影响研究. 区域经济评论, 2018, (4): 69-80.
[
|
| [14] |
周榕, 庄汝龙, 黄晨熹. 中国人口老龄化格局演变与形成机制. 地理学报, 2019, 74(10): 2163-2177.
[
|
| [15] |
梅林, 郭艳花, 陈妍. 吉林省人口老龄化时空分异特征及成因. 地理科学进展, 2018, 37(3): 352-362.
[
|
| [16] |
王利, 刘万波, 赵东霞, 等. 东北地区县域老年人口高龄化空间分异特征及驱动因素研究. 地理科学, 2019, 39(2): 267-276.
[
|
| [17] |
李少星, 王先芝, 纪小乐, 等. 乡镇尺度上的山东省人口老龄化空间格局演变与影响因素研究. 地理科学进展, 2019, 38(4): 567-576.
[
|
| [18] |
刘毅, 王云, 杨宇, 等. 粤港澳大湾区区域一体化及其互动关系. 地理学报, 2019, 74(12): 2455-2466.
[
|
| [19] |
王录仓, 武荣伟, 刘海猛, 等. 县域尺度下中国人口老龄化的空间格局与区域差异. 地理科学进展, 2016, 35(8): 921-931.
[
|
| [20] |
代金辉, 马树才. 人口老龄化对经济增长影响路径的统计检验. 统计与决策, 2019, 35(3): 110-113.
[
|
| [21] |
谢珍珠. 人口老龄化对河南经济发展的影响研究. 昆明: 云南财经大学硕士学位论文, 2019: 3-6.
[
|
| [22] |
杨振, 张小雷, 李建刚, 等. 中国地级单元城镇化与经济发展关系的时空格局: 基于2000年和2010年人口普查数据的探析. 地理研究, 2020, 39(1): 25-40.
[
|
| [23] |
李琼, 周宇, 田宇, 等. 2002-2015年中国社会保障水平时空分异及驱动机制. 地理研究, 2018, 37(9): 1862-1876.
[
|
| [24] |
冯长春, 曾赞荣, 崔娜娜. 2000年以来中国区域经济差异的时空演变. 地理研究, 2015, 34(2): 234-246.
[
|
| [25] |
刘晔, 王若宇, 薛德升, 等. 中国高技能劳动力与一般劳动力的空间分布格局及其影响因素. 地理研究, 2019, 38(8): 1949-1964.
[
|
| [26] |
王承云, 孙飞翔. 长三角城市创新空间的集聚与溢出效应. 地理研究, 2017, 36(6): 1042-1052.
[
|
| [27] |
张晓婧. 中国经济增长的影响要素分析: 基于柯布—道格拉斯生产函数. 中国市场, 2013, (41): 117-118+133.
[
|
| [28] |
陈霞. 湖北受教育程度人群与经济发展的关联性分析: 基于拓展的柯布-道格拉斯函数. 湖北民族学院学报: 哲学社会科学版, 2016, 34(4): 37-40+132.
[
|
| [29] |
朱平芳, 徐大丰. 中国城市人力资本的估算. 经济研究, 2007, (9): 84-95.
[
|
/
| 〈 |
|
〉 |