
2014—2019年中国秸秆焚烧火点的地理特征分析
|
涂心萌(1999-),女,湖北宜昌人,主修GIS空间建模。E-mail:napher@foxmail.com |
收稿日期: 2019-03-14
要求修回日期: 2020-02-20
网络出版日期: 2020-12-20
基金资助
国家自然科学基金项目(41801065)
版权
Analyzing geographical characteristics of straw burning in China during 2014-2019
Received date: 2019-03-14
Request revised date: 2020-02-20
Online published: 2020-12-20
Copyright
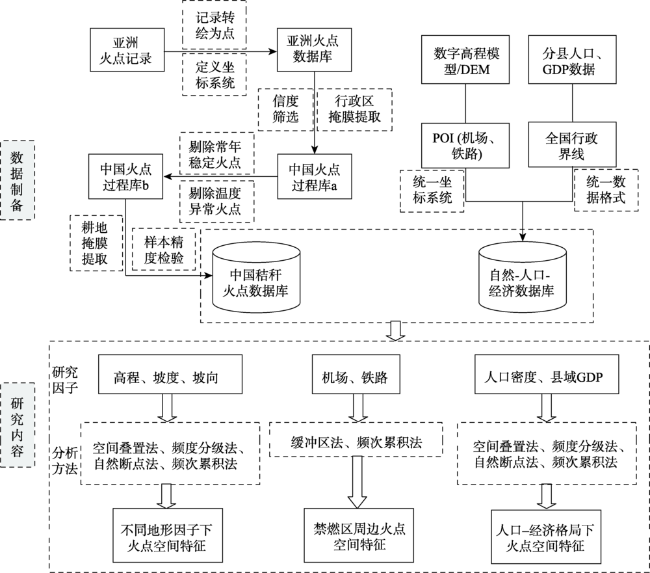
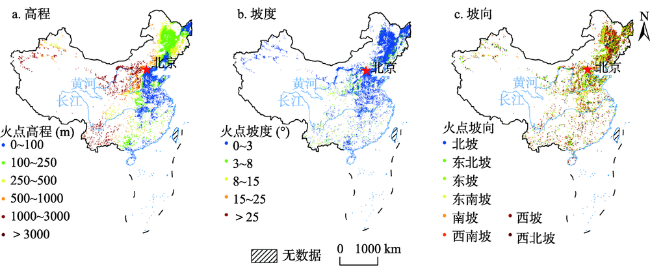
客观、精细地刻画秸秆火点的地理空间分布特征,对科学引导作物秸秆焚烧和提高行政监管效率具有重要意义。基于2014—2019年中国区域内Satsee-Fire火点数据集和地形、社会经济数据建立的中国秸秆火点数据库和自然-人口-经济数据库,本研究采用GIS分析工具和数理统计方法,剖析了中国秸秆火点在地形、公共交通和人口-经济三方面7个因子之下的空间格局特征,结果表明:① 秸秆焚烧现象集中发生在高程低于250 m、坡度低于8°的区域,而位于北向坡和南向坡的秸秆火点数分别占总数的42.65%、37.36%。② 秸秆焚烧现象在机场和铁路禁燃区内呈不同的空间格局特征。距机场愈远秸秆焚烧行为愈普遍,机场禁燃区的秸秆焚烧有近六成发生在距机场11~15 km处;而铁路禁燃区内的秸秆火点分布较为均衡,总体呈内部圈层较外部区域略微密集态势,空间上火点密度整体随纬度增加而逐步增加,山西、内蒙古、河北及东三省铁路禁燃区火点数占总数的76.88%。③ 近七成的秸秆火点发生在人口密度低于250人/km²的县域,而58.17%的秸秆火点发生在年GDP低于100亿元的县域;秸秆焚烧现象与县域人口密度、GDP水平存在负相关关系,即县域人口密度愈大、县域经济愈发达,发生秸秆焚烧的现象愈为鲜见。
涂心萌 , 杨绪红 , 张景源 , 栾心晨 , 宁可心 . 2014—2019年中国秸秆焚烧火点的地理特征分析[J]. 地理研究, 2020 , 39(10) : 2379 -2390 . DOI: 10.11821/dlyj020190189
Objectively and precisely depicting the spatial distribution characteristics of straw burning is of great significance to scientifically guide the prohibition of straw burning and improve the efficiency of administrative supervision. Based on Satsee-Fire point datasets in China during 2014-2019, natural environment and population-economy data, China's straw fire points database and nature-population-economics database established by terrain, social and economic data, this study used GIS analysis tools and mathematical statistics methods to examine the distribution characteristics of straw burning fire points in China during the 6 years under the influences of 7 factors in 3 aspects including terrain, public transport and the population-economy. The results showed that: (1) straw burning phenomenon concentrated in areas whose elevation was less than 250 m and gradient was less than 8°. And the number of fire points which are located on the north slope or the south slope accounted for 42.65% and 37.36% of the total, respectively. (2) Straw burning presented different spatial characteristics in the forbidden area of airports and railways. The farther away from the airport, the more common the straw burning was. Approximately 60% of the straw burning in the forbidden area of the airports took place 11-15 km away from the airport. However, the distribution of straw burning fire points in the forbidden area of railways were more balanced, and the internal circle was slightly more dense than the external region on the whole. In terms of space, the fire point density increased gradually with the increase of latitude. The number of fire points in the forbidden area of railways in Shanxi, Inner Mongolia, Hebei and the three provinces of Northeast China accounts for 76.88% of the total. (3) Nearly 70% of straw burning occurred in countied with a population density of less than 250 people /km², while 58.17% occurred in counties with annual GDP less than 10 billion yuan. There was a negative correlation between the phenomenon of straw burning and the population density and GDP level of the county, that is, the larger the population density and the more developed the county economy was, the rarer the phenomenon of straw burning was.
Key words: straw burning; geographical characteristic; spatial heterogeneity; China
表1 基础数据相关属性概述Tab. 1 Description of related attributes of basic data |
| 序号 | 数据名称 | 数据格式 | 时空尺度 | 数据源 |
|---|---|---|---|---|
| 1 | SatSee-Fire火点 | .csv | 亚洲区、2014年1月1日至 2019年12月31日 | http://satsee.radi.ac.cn:8080/index.html |
| 2 | 中国行政界线 | .shp | 分省 | http://www.resdc.cn/data.aspx?DATAID=200 |
| 3 | 数字高程模型 | .grid | 90 m × 90 m网格 | http://www.resdc.cn/data.aspx?DATAID=123 |
| 4 | 机场 | .shp | 2016年全国POI | http://www.resdc.cn/data.aspx?DATAID=240 |
| 5 | 铁路 | .shp | 2016年全国POI | http://www.resdc.cn/data.aspx?DATAID=236 |
| 6 | 中国人口和GDP | .grid | 1 km × 1 km网格,2015年 | http://www.resdc.cn/data.aspx?DATAID=252 |
| 7 | 中国耕地 | .grid | 1 km × 1 km网格,2015年 | http://www.resdc.cn/data.aspx?DATAID=184 |
图2 不同高程、坡度、坡向下火点空间分布特征注:此图基于国家自然资源部标准地图服务系统的标准地图(审图号GS(2020)4619号)绘制,底图无修改。 Fig. 2 Spatial distribution characteristics of fire points at different elevations (a), slopes (b), slope aspects (c) |
表2 火点在不同高程、坡度、坡向频段范围内分布情况Tab. 2 Distribution of fire points at different elevations, slopes, and slope aspects |
| 地形因子 | 单位 | 范围 | 火点数(个) | 比例(%) |
|---|---|---|---|---|
| 高程 | m | 0~100 | 9010 | 34.32 |
| 100~200 | 9159 | 34.88 | ||
| 200~300 | 2793 | 10.64 | ||
| 300~400 | 1193 | 4.54 | ||
| 400~500 | 1943 | 7.40 | ||
| 500~600 | 439 | 1.67 | ||
| 600~700 | 217 | 0.83 | ||
| 700~800 | 292 | 1.11 | ||
| 800~900 | 323 | 1.23 | ||
| 900~1000 | 886 | 3.37 | ||
| 坡度 | ° | 0~3 | 26901 | 93.53 |
| 3~8 | 1596 | 5.55 | ||
| 8~15 | 208 | 0.72 | ||
| 15~25 | 52 | 0.18 | ||
| > 25 | 4 | 0.01 | ||
| 坡向 | 北 | 6021 | 20.93 | |
| 东北 | 2924 | 10.17 | ||
| 东 | 3166 | 11.01 | ||
| 东南 | 4074 | 14.17 | ||
| 南 | 3709 | 12.90 | ||
| 西南 | 2960 | 10.29 | ||
| 西 | 2585 | 8.99 | ||
| 西北 | 3322 | 11.55 |
表3 全国机场、铁路禁燃区各缓冲区范围内火点情况Tab. 3 Distribution of fire points in each buffer in the forbidden area of nationwide airports and railways |
| 禁燃区因素 | 单位 | 范围 | 火点数(个) | 比例(%) |
|---|---|---|---|---|
| 机场 | km | 0~1 | 3 | 0.03 |
| 1~2 | 20 | 0.21 | ||
| 2~3 | 47 | 0.50 | ||
| 3~4 | 78 | 0.83 | ||
| 4~5 | 128 | 1.36 | ||
| 5~6 | 230 | 2.44 | ||
| 6~7 | 355 | 3.77 | ||
| 7~8 | 499 | 5.30 | ||
| 8~9 | 641 | 6.81 | ||
| 9~10 | 776 | 8.24 | ||
| 10~11 | 947 | 10.06 | ||
| 11~12 | 1139 | 12.10 | ||
| 12~13 | 1350 | 14.34 | ||
| 13~14 | 1477 | 15.69 | ||
| 14~15 | 1723 | 18.30 | ||
| 铁路 | m | 0~200 | 285 | 10.59 |
| 200~400 | 336 | 12.49 | ||
| 400~600 | 246 | 9.14 | ||
| 600~800 | 267 | 9.92 | ||
| 800~1000 | 292 | 10.85 | ||
| 1000~1200 | 271 | 10.07 | ||
| 1200~1400 | 267 | 9.92 | ||
| 1400~1600 | 260 | 9.66 | ||
| 1600~1800 | 236 | 8.77 | ||
| 1800~2000 | 231 | 8.58 |
表4 不同县域人口密度、县域GDP水平下的火点数Tab. 4 Distribution of fire points with different county population densities and county GDP |
| 社会经济因素 | 单位 | 范围 | 火点数(个) | 比例(%) |
|---|---|---|---|---|
| 县域人口密度 | 人/km² | 0~250 | 20030 | 69.85 |
| 250~500 | 4495 | 15.68 | ||
| 500~750 | 2386 | 8.32 | ||
| 750~1000 | 849 | 2.96 | ||
| 1000~1250 | 246 | 0.86 | ||
| 1250~1500 | 89 | 0.31 | ||
| 1500~1750 | 179 | 0.62 | ||
| 1750~2000 | 25 | 0.09 | ||
| 2000~2250 | 174 | 0.61 | ||
| >2250 | 202 | 0.70 | ||
| 县域GDP水平 | 百亿元 | 0~1.0 | 16679 | 58.17 |
| 1.0~2.0 | 6288 | 21.93 | ||
| 2.0~3.0 | 2917 | 10.17 | ||
| 3.0~5.0 | 1434 | 5.00 | ||
| 5.0~7.5 | 860 | 3.00 | ||
| 7.5~10.0 | 87 | 0.30 | ||
| 10.0~12.5 | 119 | 0.42 | ||
| 12.5~15.0 | 111 | 0.39 | ||
| 15.0~20.0 | 51 | 0.18 | ||
| >20.0 | 128 | 0.45 |
感谢匿名评审专家在论文评审中所付出的宝贵时间和精力,评审专家对本文文献综述写作方法、静态耕地数据误差、语言表述方面的修改意见,使本文受益匪浅。
| [1] |
郑凤英, 张英珊. 我国秸秆资源的利用现状及其综合利用前景. 西部资源, 2007,16(1):25-26.
[
|
| [2] |
国家统计局. 2010-2017年我国秸秆理论资源量及可收集资源量. https://baijiahao.baidu.com/s?id=1609929438736161928&wfr=spider&for=pc, 2018-08-28.
[ National Statistics. The theoretical resources of straw in China and the resources that can be collected from 2010 to 2017. https://baijiahao.baidu.com/s?id=1609929438736161928&wfr=spider&for=pc, 2018-08-28.]
|
| [3] |
贾秀飞, 叶鸿蔚. 秸秆焚烧污染治理的政策工具选择: 基于公共政策学、经济学维度的分析. 干旱区资源与环境, 2016,30(1):36-41.
[
|
| [4] |
何立明, 王文杰, 王桥, 等. 中国秸秆焚烧的遥感监测与分析. 中国环境监测, 2007,23(1):42-50.
[
|
| [5] |
彭立群, 张强, 贺克斌. 基于调查的中国秸秆露天焚烧污染物排放清单. 环境科学研究, 2016,29(8):1109-1118.
[
|
| [6] |
王书肖, 张楚莹. 中国秸秆露天焚烧大气污染物排放时空分布. 中国科技论文, 2008,3(5):329-333.
[
|
| [7] |
徐玉宏. 我国秸秆焚烧污染与防治对策. 环境与可持续发展, 2007, (3):21-24.
[
|
| [8] |
秸秆禁烧和综合利用管理办法. 资源节约和综合利用, 1999, (3):6-6.
[ Administrative measures on prohibition of burning and comprehensive utilization of straw. Resources Economization and Comprehensive Utilization, 1999, (3):6-6.]
|
| [9] |
厉青, 张丽娟, 吴传庆, 等. 基于卫星遥感的秸秆焚烧监测及对空气质量影响分析. 生态与农村环境学报, 2009,25(1):32-37.
[
|
| [10] |
|
| [11] |
|
| [12] |
|
| [13] |
|
| [14] |
张树誉, 李登科, 景毅刚. "3S"技术在关中地区秸秆焚烧遥感监测中的应用. 环境监测管理与技术, 2005,17(2):17-20.
[
|
| [15] |
胡梅, 齐述华, 舒晓波, 等. 华北平原秸秆焚烧火点的MODIS影像识别监测. 地球信息科学学报, 2008,10(6):802-807.
[
|
| [16] |
张彦, 刘婷, 李冰, 等. 基于MODIS数据的河南省秋季作物秸秆焚烧火点监测研究. 河南农业科学, 2016,45(11):149-154.
[
|
| [17] |
张丽娟, 厉青, 陈辉, 等. 2014—2015年夏秋收期间全国秸秆焚烧遥感监测结果对比分析. 环境与可持续发展, 2016,41(6):61-65.
[
|
| [18] |
毛慧琴, 张丽娟, 厉青, 等. 基于卫星遥感的东北三省露天秸秆焚烧及其排放研究. 中国农业资源与区划, 2018,39(4):59-66.
[
|
| [19] |
李佳, 李舒婷, 段平, 等. 基于MODIS的河南省秸秆焚烧遥感监测与分析. 测绘工程, 2018,27(1):42-46.
[
|
| [20] |
张景源, 杨绪红, 涂心萌, 等. 2014—2018年中国田间秸秆焚烧火点的时空变化. 农业工程学报, 2019,35(19):191-199.
[
|
| [21] |
杨存建, 刘纪远, 张增祥, 等. 不同高程带上的土壤侵蚀特征分析. 水土保持通报, 2001,21(4):15-18.
[
|
| [22] |
涂汉明, 刘振东. 中国地势起伏度研究. 测绘学报, 1991,20(4):311-319.
[
|
| [23] |
张庆忠. 秸秆焚烧缘何屡禁难止?. 世界环境, 2008(1):46-47.
[
|
| [24] |
中国航空报. 我国农机行业的国际化趋势. http://www.cannews.com.cn/2019/0131/189200.shtml, 2019-01-31.
[ China Aviation News. The internationalization trend of agricultural machinery industry in China. http://www.cannews.com.cn/2019/0131/189200.shtml, 2019-01-31.]
|
| [25] |
苏瑜, 黄连光, 王秀敏. 秸秆焚烧现状与对策探讨. 宁夏农林科技, 2012,53(3):113-114.
[
|
| [26] |
邬莉, 陈静, 朱晓东, 等. 农村秸秆焚烧的原因及对策研究. 中国人口·资源与环境, 2001,11(S1):111-113.
[
|
/
| 〈 |
|
〉 |