
中国海水养殖碳汇经济价值时空演化及影响因素分析
|
孙康(1963-),女,辽宁本溪人,博士,教授,硕士生导师,研究方向为产业经济学与生态保护。E-mail: sunkangdl@163.com |
收稿日期: 2019-08-26
要求修回日期: 2020-03-26
网络出版日期: 2021-01-19
基金资助
教育部人文社科重点研究基地重大项目(17JJD790010)
辽宁省教育厅人文社科研究项目(WJ2019016)
辽宁省社会科学规划基金项目(L19BJ006)
版权
Spatio-temporal evolution and influencing factors of the economic value for mariculture carbon sinks in China
Received date: 2019-08-26
Request revised date: 2020-03-26
Online published: 2021-01-19
Copyright
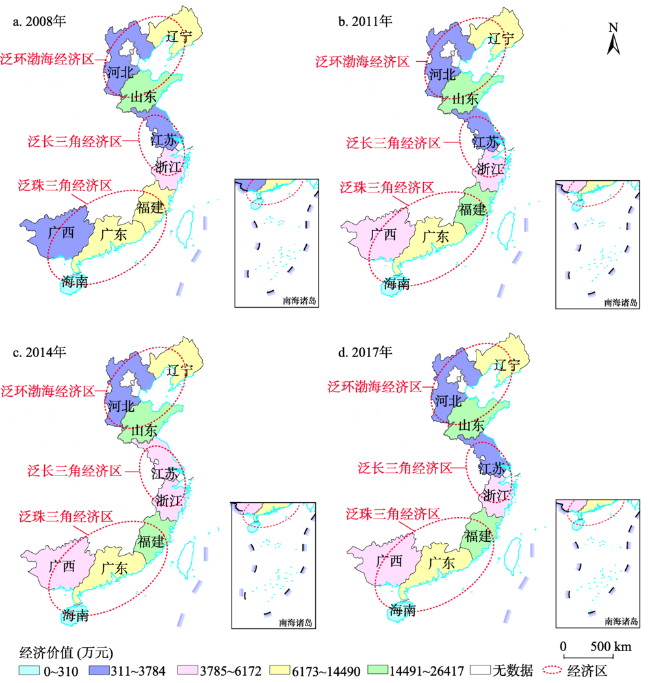
中国是全球海水养殖第一强国,养殖产量占世界总产量的70%以上。根据碳税法和人工造林法测算海水养殖碳汇经济价值,并探讨时空分异特征;采用LMDI指数分解法,分析海水养殖业碳汇能力影响因素。研究结果表明:① 2008—2017年碳汇量和经济价值均呈上升趋势,2017年经济价值达到91.8亿元;各省碳汇效率排名波动较大,效率和经济价值相对差异和绝对差异逐渐缩小,经济价值处于持续增长趋势。② 时空演化上,经济价值呈现出泛环渤海、泛长三角、泛珠三角三足鼎立分布态势,时空演化揭示了中国碳汇渔业在科学引导,合理布局,陆海统筹,试点先行,全国推广的演化机理,表明中国碳汇渔业发展态势趋好。③ 碳汇能力影响因素中,价值效应大于规模效应和结构效应,渔业相关的法律、法规对规模效应和结构效应的影响显著。研究海水养殖碳汇有利于促进海洋渔业高质量发展,以期为开发利用海洋渔业碳汇提供理论依据。
孙康 , 崔茜茜 , 苏子晓 , 王雁楠 . 中国海水养殖碳汇经济价值时空演化及影响因素分析[J]. 地理研究, 2020 , 39(11) : 2508 -2520 . DOI: 10.11821/dlyj020190731
China is the world's largest mariculture country, and its mariculture output accounts for more than 70% of the world's total. First, according to the data from China Fishery Statistical Yearbook, the carbon sinks of mariculture in each province from 2008 to 2017 are estimated. It is found that the carbon sinks of mariculture in China were on the rise, and the average carbon sink efficiency was stable at about 8.4%. After 2011, the value reached more than 1 million tons. Second, we adopted the carbon tax law and artificial afforestation method to calculate the economic value of mariculture carbon sink, and then examined the time-space differentiation characteristics. Besides, we used LMDI index decomposition method to analyze the factors influencing the carbon sink capacity of mariculture. The results show that: (1) Both carbon sink and economic value showed an upward trend from 2008 to 2017, and the economic value reached 9.18 billion yuan in 2017; the ranking of carbon sink efficiency of various provinces fluctuated greatly, and the relative and absolute differences in efficiency and economic value were gradually shrinking. The economic value keeps a continuous growth trend. (2) In terms of spatio-temporal evolution, economic value presents a three-legged distribution situation in the Pan-Bohai Rim, Pan-Yangtze River Delta, and Pan-Pearl River Delta. The spatio-temporal evolution reveals that carbon sink fishery is scientifically guided, rationally distributed, land-sea coordination, and pilot projects first in China, the evolutionary mechanism of national promotion indicates that the development trend of carbon sink fishery is getting better. (3) Among the influencing factors of carbon sink capacity, value effect is greater than scale effect and structure effect, and fishery-related laws and regulations have significant influence on scale effect and structure effect. Research on mariculture carbon sinks is conducive to promoting the high-quality development of marine fisheries, in order to provide a theoretical basis for the development and utilization of marine fishery carbon sinks.
表1 贝、藻类海产品碳汇量测算方法Tab. 1 Determination of carbon sink of shellfish algal products |
| 类别 | 碳汇量计算公式 |
|---|---|
| 贝类 | 海水养殖碳汇量=贝类碳汇量+藻类碳汇量 |
| 贝类碳汇量=软组织碳汇量+贝壳碳汇量 | |
| 软组织碳汇量=贝类产量×干湿系数×软组织占比×软组织含碳量 | |
| 贝壳碳汇量=贝类产量×干湿系数×贝壳占比×贝壳含碳量 | |
| 藻类 | 藻类碳汇量=藻类产量×干湿系数×含碳量 |
表2 海水养殖碳汇能力核算系数Tab. 2 Carbon sink capacity calculation coefficient for mariculture (%) |
| 种类 | 干湿系数 | 质量占比 | 碳含量 | |||
|---|---|---|---|---|---|---|
| 软组织 | 贝壳 | 软组织 | 贝壳 | |||
| 蛤 | 52.55 | 1.98 | 98.02 | 44.90 | 11.52 | |
| 扇贝 | 63.89 | 14.35 | 85.65 | 42.84 | 11.40 | |
| 牡蛎 | 65.10 | 6.14 | 93.86 | 45.98 | 12.68 | |
| 贻贝 | 75.28 | 8.47 | 91.53 | 44.40 | 11.76 | |
| 其他贝类 | 64.21 | 11.41 | 88.59 | 43.87 | 11.44 | |
| 海带 | 20.00 | 1.00 | 0 | 31.20 | 0 | |
| 裙带菜 | 20.00 | 1.00 | 0 | 26.40 | 0 | |
| 紫菜 | 20.00 | 1.00 | 0 | 27.39 | 0 | |
| 江蓠 | 20.00 | 1.00 | 0 | 20.60 | 0 | |
| 其他藻类 | 20.00 | 1.00 | 0 | 27.76 | 0 | |
表4 2008—2017年海水养殖碳汇总量及碳汇效率Tab. 4 Mariculture carbon aggregate amount and carbon sink efficiency from 2008 to 2017 |
| 年份 | 贝类碳汇(t) | 藻类碳汇(t) | 碳汇总量(t) | 碳汇效率(%) |
|---|---|---|---|---|
| 2008 | 884794 | 80382 | 965176 | 8.42 |
| 2009 | 926363 | 84325 | 1010688 | 8.43 |
| 2010 | 969686 | 89634 | 1059320 | 8.39 |
| 2011 | 1011520 | 92570 | 1104090 | 8.40 |
| 2012 | 1060971 | 101334 | 1162305 | 8.39 |
| 2013 | 1119883 | 106020 | 1225903 | 8.41 |
| 2014 | 1159357 | 119645 | 1279002 | 8.43 |
| 2015 | 1199393 | 121222 | 1320615 | 8.43 |
| 2016 | 1254977 | 125776 | 1380753 | 8.43 |
| 2017 | 1271929 | 128916 | 1400845 | 8.44 |
表5 2008—2017年沿海各省经济价值 |
| 年份 | 2008 | 2009 | 2010 | 2011 | 2012 | 2013 | 2014 | 2015 | 2016 | 2017 |
|---|---|---|---|---|---|---|---|---|---|---|
| 全国 | 63311 | 66296 | 69486 | 72423 | 76241 | 80413 | 83896 | 86626 | 90570 | 91888 |
| 河北 | 1551 | 1558 | 1835 | 1747 | 2201 | 2636 | 2891 | 2966 | 2962 | 3067 |
| 辽宁 | 9643 | 9983 | 10140 | 11391 | 12323 | 13357 | 13591 | 13836 | 14685 | 14489 |
| 山东 | 17150 | 18712 | 19609 | 20166 | 21406 | 22355 | 23751 | 25008 | 25879 | 26417 |
| 江苏 | 2940 | 3136 | 3321 | 3570 | 3681 | 3860 | 3785 | 3567 | 3611 | 3697 |
| 浙江 | 4280 | 3985 | 4308 | 4318 | 4080 | 4543 | 4683 | 4914 | 5361 | 6172 |
| 福建 | 14413 | 15110 | 15476 | 15903 | 16340 | 17248 | 18295 | 19199 | 20432 | 20962 |
| 广东 | 9821 | 10214 | 10843 | 11263 | 11426 | 11793 | 11917 | 12108 | 12301 | 11435 |
| 广西 | 3374 | 3530 | 3788 | 3849 | 4083 | 4319 | 4494 | 4766 | 5061 | 5338 |
| 海南 | 138 | 155 | 167 | 172 | 192 | 218 | 267 | 262 | 278 | 310 |
表6 2008—2016年海水养殖碳汇的结构效应STETab. 6 The structural effects STE of mariculture carbon sinks from 2008 to 2016 |
| 城市 | 2008 | 2009 | 2010 | 2011 | 2012 | 2013 | 2014 | 2015 | 2016 |
|---|---|---|---|---|---|---|---|---|---|
| 全国 | 0.9986 | 1.0008 | 0.9880 | 1.0268 | 0.9999 | 1.0303 | 1.0042 | 1.0421 | 0.9487 |
| 河北 | 0.9915 | 1.0763 | 0.9215 | 1.1876 | 0.9874 | 1.0518 | 0.9903 | 0.9807 | 0.9891 |
| 辽宁 | 0.9791 | 1.0064 | 1.2198 | 1.0190 | 0.9971 | 1.0188 | 0.9179 | 0.9439 | 0.8949 |
| 山东 | 0.9842 | 0.9792 | 0.9324 | 1.0452 | 0.9982 | 1.0923 | 0.9865 | 1.0085 | 0.8918 |
| 江苏 | 1.2607 | 0.7372 | 0.8378 | 0.7671 | 1.0977 | 0.7982 | 0.9090 | 1.0033 | 1.2339 |
| 浙江 | 1.0192 | 1.0227 | 0.9969 | 0.8605 | 1.0031 | 0.9566 | 1.0493 | 1.1405 | 1.4430 |
| 福建 | 1.0265 | 0.9933 | 0.9854 | 1.0113 | 0.9943 | 1.0270 | 1.0616 | 1.1058 | 0.9854 |
| 广东 | 1.0963 | 0.9955 | 1.0251 | 1.0073 | 0.9982 | 0.9293 | 0.9548 | 1.0237 | 0.8092 |
| 广西 | 0.9959 | 1.0155 | 0.9784 | 0.9963 | 1.0000 | 0.9988 | 1.0241 | 1.0379 | 1.0057 |
| 海南 | 0.9795 | 1.0277 | 0.9645 | 1.0968 | 1.0000 | 1.3689 | 0.9028 | 1.0789 | 13.0888 |
表7 2008—2016年海水养殖碳汇的规模效应SCETab. 7 The scale effect SCE of mariculture carbon sinks from 2008 to 2016 |
| 城市 | 2008 | 2009 | 2010 | 2011 | 2012 | 2013 | 2014 | 2015 | 2016 |
|---|---|---|---|---|---|---|---|---|---|
| 全国 | 1.0504 | 1.0497 | 1.0476 | 1.0587 | 1.0008 | 1.0456 | 1.0341 | 1.0215 | 1.0478 |
| 河北 | 1.0131 | 1.0925 | 1.0339 | 1.0610 | 0.9943 | 1.0430 | 1.0359 | 1.0183 | 1.0468 |
| 辽宁 | 1.0000 | 1.0120 | 1.0661 | 1.0548 | 1.0035 | 1.0253 | 1.0491 | 1.0266 | 1.0575 |
| 山东 | 1.0000 | 1.0588 | 1.0382 | 1.0644 | 1.0032 | 1.0486 | 1.0399 | 1.0204 | 1.0595 |
| 江苏 | 1.0000 | 1.0841 | 1.0511 | 1.1004 | 1.0292 | 1.0506 | 1.0344 | 1.0136 | 1.0297 |
| 浙江 | 1.0000 | 1.0558 | 1.0103 | 1.0608 | 0.9956 | 1.0427 | 1.0359 | 1.0214 | 1.0439 |
| 福建 | 1.0000 | 1.0396 | 1.0414 | 1.0454 | 0.9871 | 1.0435 | 1.0311 | 1.0200 | 1.0408 |
| 广东 | 1.0000 | 1.0561 | 1.0413 | 1.0552 | 1.0018 | 1.0372 | 1.0339 | 1.0208 | 1.0448 |
| 广西 | 1.0000 | 1.0566 | 1.0385 | 1.0648 | 1.0011 | 1.0420 | 1.0354 | 1.0231 | 1.0489 |
| 海南 | 1.0000 | 1.0575 | 1.0524 | 1.0631 | 1.0000 | 1.0489 | 1.0371 | 1.0234 | 0.7621 |
表8 2008—2016年海水养殖碳汇的价值效应VLETab. 8 The value effect VLE of mariculture carbon sinks from 2008 to 2016 |
| 2008 | 2009 | 2010 | 2011 | 2012 | 2013 | 2014 | 2015 | 2016 | |
|---|---|---|---|---|---|---|---|---|---|
| 全国 | 1.0453 | 1.0531 | 1.1164 | 0.9543 | 1.0500 | 1.0525 | 1.0240 | 1.0770 | 1.0506 |
| 河北 | 1.0165 | 1.1037 | 1.0029 | 1.1357 | 1.1956 | 1.1082 | 1.0160 | 1.0290 | 1.0714 |
| 辽宁 | 1.0513 | 1.0722 | 1.1647 | 0.9865 | 1.0700 | 1.0414 | 1.0039 | 1.0808 | 1.0257 |
| 山东 | 1.0598 | 1.0386 | 1.1454 | 0.9228 | 1.0440 | 0.9953 | 0.9334 | 1.0508 | 1.0733 |
| 江苏 | 0.9306 | 1.0796 | 1.0831 | 0.8568 | 1.1011 | 1.0427 | 1.0384 | 1.1233 | 1.1960 |
| 浙江 | 1.0472 | 1.0334 | 1.1053 | 0.9385 | 1.0570 | 1.0715 | 1.0460 | 1.1007 | 1.0658 |
| 福建 | 1.0679 | 1.0447 | 1.1093 | 0.9574 | 1.0402 | 1.0667 | 1.0368 | 1.0680 | 1.0527 |
| 广东 | 1.0401 | 1.0603 | 1.1189 | 0.9200 | 1.0255 | 1.0240 | 1.0074 | 1.0474 | 0.9638 |
| 广西 | 1.0443 | 1.0707 | 1.0929 | 0.9566 | 1.0562 | 1.0533 | 1.0498 | 1.0891 | 1.0883 |
| 海南 | 1.0438 | 1.0682 | 1.1040 | 1.0043 | 1.1298 | 1.2031 | 0.9697 | 1.0896 | 1.0183 |
真诚感谢二位匿名评审专家在论文评审中所付出的时间和精力,评审专家对本文对策建议的系统性、以及与高质量发展匹配性方面的修改意见,使本文获益匪浅。
| [1] |
杜群. 气候变化的国际法发展: 《<联合国气候变化框架公约>京都议定书》述评. 环境资源法论丛, 2003, (6):236-257.
[
|
| [2] |
刘芳明, 刘大海, 郭贞利. 海洋碳汇经济价值核算研究. 海洋通报, 2019,38(11):88-13+19.
[
|
| [3] |
唐启升. 碳汇渔业与又好又快发展现代渔业. 江西水产科技, 2011, (2):5-7.
[
|
| [4] |
于梦璇, 田天, 马云瑞. 浅析碳汇渔业所需的碳交易市场规模: 基于海洋渔业生产数据的测算. 海洋开发与管理, 2018,35(7):88-93.
[
|
| [5] |
徐敬俊, 覃恬恬, 韩立民. 海洋“碳汇渔业”研究述评. 资源科学, 2018,40(1):161-172.
[
|
| [6] |
张永雨, 张继红, 梁彦韬, 等. 中国近海养殖环境碳汇形成过程与机制. 中国科学: 地球科学, 2017,47(12):1414-1424.
[
|
| [7] |
张继红, 方建光, 唐启升. 中国浅海贝藻养殖对海洋碳循环的贡献. 地球科学进展, 2005,20(3):359-365.
[
|
| [8] |
齐占会, 王珺, 黄洪辉, 等. 广东省海水养殖贝藻类碳汇潜力评估. 南方水产科学, 2012,8(1):30-35.
[
|
| [9] |
李昂, 刘存歧, 董梦荟, 等. 河北省海水养殖贝类与藻类碳汇能力评估. 南方农业学报, 2013,44(7):1201-1204.
[
|
| [10] |
卢振彬, 黄美珍. 福建近海主要经济渔业生物营养级和有机碳含量研究. 台湾海峡, 2004,23(2):153-158.
[
|
| [11] |
宋金明, 李学刚, 袁华茂, 等. 中国近海生物固碳强度与潜力. 生态学报, 2008,28(2):551-558.
[
|
| [12] |
许国栋, 王萍萍, 纪建悦, 等. 基于LMDI方法的海水养殖贝类碳汇分解研究: 山东省2008-2012年的经验数据. 中国渔业经济, 2015,33(1):71-76.
[
|
| [13] |
邵桂兰, 刘冰, 李晨. 我国主要海域海水养殖碳汇能力评估及其影响效应: 基于我国9个沿海省份面板数据. 生态学报, 2019,39(7):2614-2625.
[
|
| [14] |
纪建悦, 王萍萍. 海水养殖贝类碳汇分解研究: 基于修正的Laspeyres指数分解法. 中国渔业经济, 2016,34(5):79-84.
[
|
| [15] |
岳冬冬. 海带养殖结构变动与海藻养殖碳汇量核算的情景分析. 福建农业学报, 2012,27(4):432-436.
[
|
| [16] |
邵桂兰, 孔海峥, 李晨. 中国海水养殖的净碳汇及其与经济耦合关系. 资源科学, 2019,41(2):277-288.
[
|
| [17] |
邵桂兰, 任肖嫦, 李晨. 基于B-S期权定价模型的碳汇渔业价值评估: 以海水养殖藻类为例. 中国渔业经济, 2017,35(5):76-82.
[
|
| [18] |
|
| [19] |
|
| [20] |
肖寒, 欧阳志云, 赵景柱, 等. 森林生态系统服务功能及其生态经济价值评估初探: 以海南岛尖峰岭热带森林为例. 应用生态学报, 2000,11(4):481-484.
[
|
| [21] |
杨美丽, 褚宏洋, 庄皓明, 等. 森林碳汇经济价值评估研究: 以山东省为例. 山东农业大学学报: 社会科学版, 2017,19(2):77-84.
[
|
| [22] |
许文强. 森林碳汇价值评价. 昆明: 西南林学院硕士学位论文, 2006: 38-45.
[
|
| [23] |
黄方. 森林碳汇的经济价值. 广西林业, 2006, (5):42-44.
[
|
| [24] |
涂慧萍, 陈世清, 陈建群. 对森林碳汇及试点的思考. 林业资源管理, 2004, (6):18-21.
[
|
| [25] |
[
|
| [26] |
成克武, 崔国发, 王建中, 等. 北京喇叭沟门林区森林生物多样性经济价值评估. 北京林业大学学报, 2000,22(4):66-71.
[
|
| [27] |
|
| [28] |
李金昌. 生态价值论. 重庆: 重庆大学出版社, 1999: 165-167.
[
|
| [29] |
中国生物多样性国情研究报告编写组. 中国生物多样性国情研究报告. 北京: 中国环境科学出版社, 1997: 191-209.
[ China Biodiversity National Conditions Research Report Writing Group. China Biodiversity National Conditions Research Report. Beijing: China Environmental Science Press, 1997: 191-209.]
|
| [30] |
候元兆. 中国森林资源核算研究. 北京: 中国林业出版社, 1995: 136.
[
|
| [31] |
施溯筠, 李光, 张三焕, 等. 长白山区森林固定CO2价值的评估. 延边大学学报(自然科学版), 2002,28(2):134-137.
[
|
| [32] |
郭朝先. 中国碳排放因素分解: 基于LMDI分解技术. 中国人口·资源与环境, 2010,20(12):4-9.
[
|
| [33] |
郑德凤, 郝帅, 孙才志, 等. 中国大陆生态效率时空演化分析及其趋势预测. 地理研究, 2018,37(5):1034-1046.
[
|
| [34] |
农业农村部渔业渔政管理局, 全国水产技术推广总站, 中国水产学会. 中国渔业统计年鉴. 北京: 中国农业出版社, 2008-2018.
[ Fisheries and Fisheries Administration of the Ministry of Agriculture and Rural Affairs, National Aquatic Technology Extension Station, China Fisheries Society. China Fishery Statistics Yearbook. Beijing: China Agriculture Press, 2008-2018.]
|
| [35] |
国家统计局. 中国统计年鉴. 北京: 中国统计出版社, 2008-2018.
[ National Bureau of Statistics. China Statistical Yearbook. Beijing: China Statistics Press, 2008-2018.]
|
| [36] |
胡锦涛. 坚定不移沿着中国特色社会主义道路前进为全面建成小康社会而奋斗: 在中国共产党第十八次全国代表大会上的报告. 新华网, http://news.xinhuanet.com/18cpcnc/2012-11/17/c_113711665.html, 2019-12-04.
[
|
/
| 〈 |
|
〉 |