
基于国际公路运输链的“一带一路”区域公路通达性分析
|
李晓丽(1994-),女,山东莒县人,硕士,主要从事区域发展与运输地理研究。E-mail: lixiaoli17@mails.ucas.ac.cn |
收稿日期: 2019-09-06
要求修回日期: 2019-11-20
网络出版日期: 2021-01-19
基金资助
中国科学院战略性先导科技专项(A类子课题XDA20010101)
国家自然科学基金项目(41871122)
国家自然科学基金项目(41701141)
版权
Analyzing the highway accessibility in the Belt and Road region based on international highway transport chain
Received date: 2019-09-06
Request revised date: 2019-11-20
Online published: 2021-01-19
Copyright
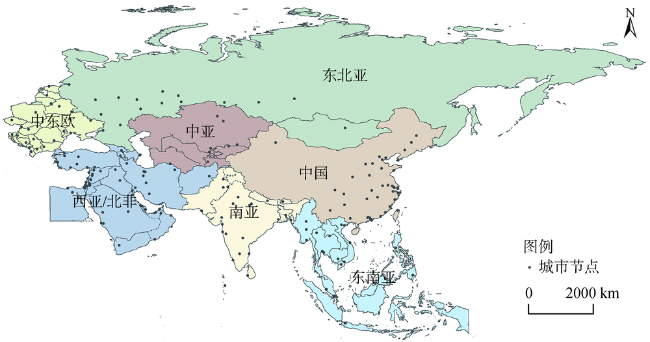
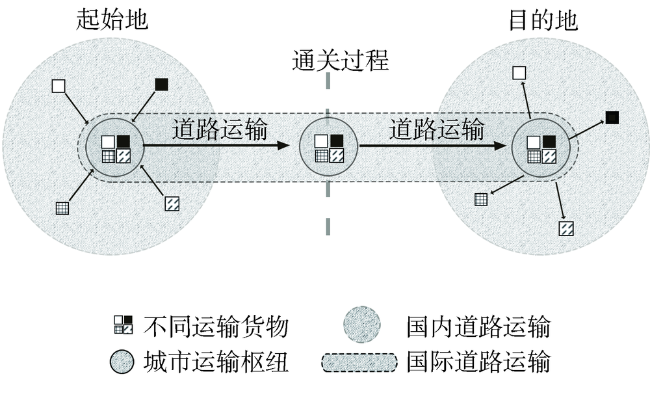
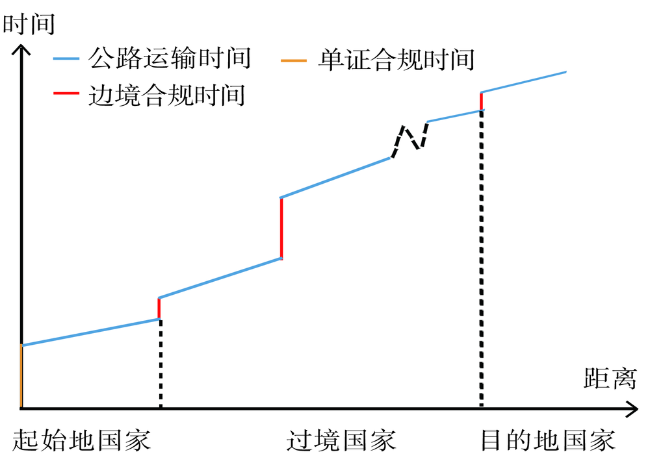
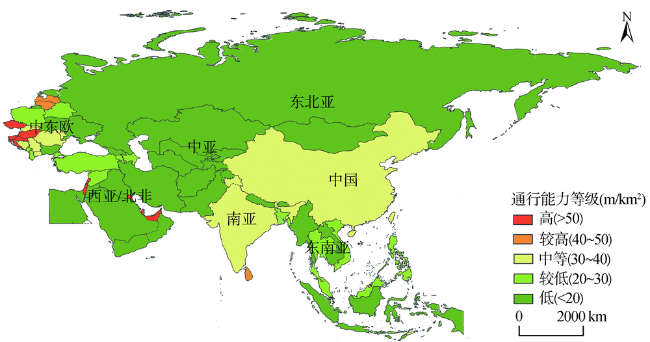
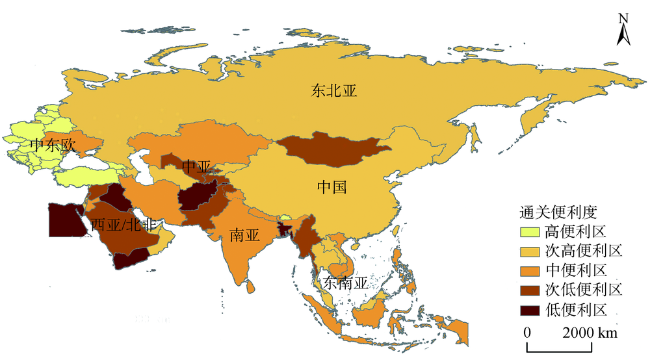
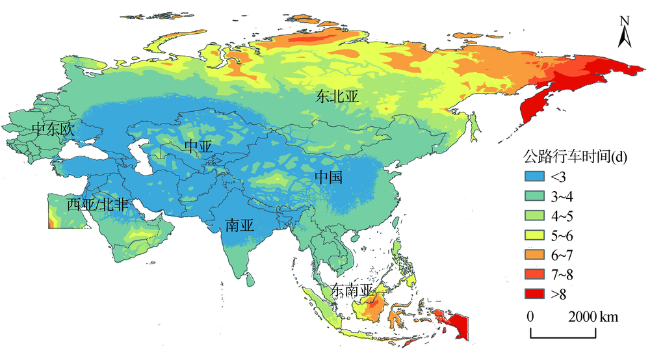
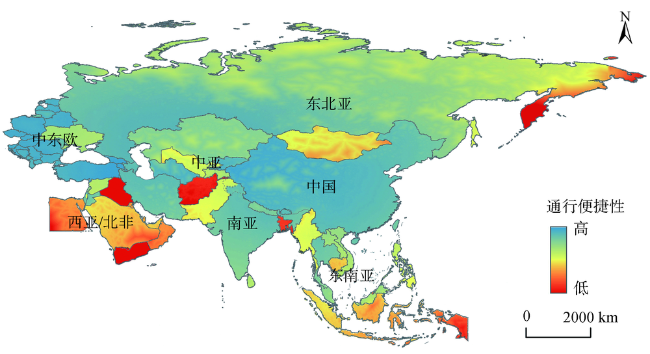
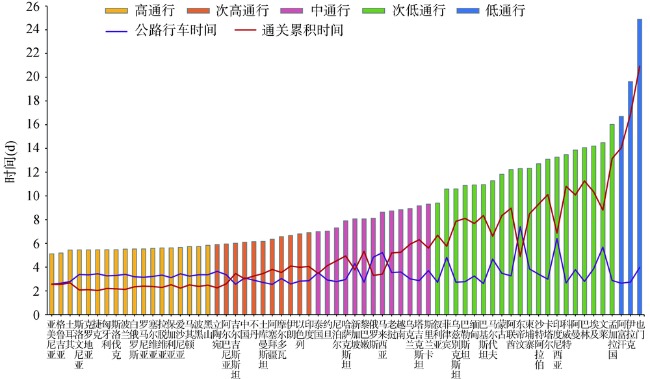
国际公路运输作为“一带一路”倡议之互联互通的重要部分,是沿线国家经贸往来的重要载体。本文基于国际公路运输链的角度,结合行车时间和通关耗时,从公路通行能力和通行便捷性两方面分析“一带一路”区域公路通达性。研究表明:① “一带一路”区域公路通行能力分布状况存在不平衡现象,中东欧、中国、印度形成“三极”,通行能力明显高于其他区域,中亚、西亚、东北亚等地区由于公路覆盖率低、缺少高等级公路成为通行能力薄弱区域。② 受累积空间距离、跨境通关时间、公路网的完善程度以及政治局势等因素影响,“一带一路”区域通行便捷性在空间分布上大致呈现“中东欧-中国”双峰结构;区域之间乃至区域内部国家间通行便捷性差异显著,从高通行便捷性到低通行便捷性,通达时间由公路行车时间主导过渡到通关累积时间主导,国家间的通关障碍在很大程度上降低了“一带一路”区域公路运输整体通达性水平。
李晓丽 , 吴威 , 刘玮辰 . 基于国际公路运输链的“一带一路”区域公路通达性分析[J]. 地理研究, 2020 , 39(11) : 2552 -2567 . DOI: 10.11821/dlyj020190773
As a vital part of the Belt and Road Initiative, international highway transport is an important carrier of economic and trade cooperation among the countries along the Belt and Road. Since the initiative was proposed in 2013, China and the countries along the routes have actively promoted cooperation in highway infrastructure connectivity. However, there are still many challenges to achieve regional highway accessibility in the Belt and Road region. Based on highway international transportation chain, this paper incorporates driving time and cross-border customs clearance time to analyze accessibility of highway transport in the Belt and Road area from highway traffic capacity and traffic convenience. The results indicate that: (1) Highway traffic capacity presents an uneven spatial distribution pattern in the Belt and Road area, where Central and Eastern Europe, China, and India form “three poles” with a significantly higher capacity than other regions. Central Asia, West Asia, and Northeast Asia have low traffic capacity because of low road coverage and insufficient high-grade roads. (2) The clearance facilitation in various regions of the Belt and Road area is quite different. The high degree of integration makes the customs clearance of Central and Eastern European countries an absolute advantage in the whole region, but there are great obstacles of it in West Asia and North Africa. (3) The spatial structure of highway driving facilitation is a “central-peripheral” one. The regional geometric center coincides with the optimal area of driving facilitation. In addition to the location factor of the node, natural constraints such as natural terrain and climatic conditions become the main obstacles to highway transportation. (4) Due to the cumulative space distance, cross-border customs clearance time, highway network and political situation, the spatial distribution of highway traffic convenience presents the “Central and Eastern Europe-China” bimodal structure. There are significant differences in highway traffic convenience between regions and even between countries within the region. From high to low-traffic convenience, the travel time is gradually transferred from driving time to customs clearance time. Therefore, the barriers to cross-border clearance between countries have largely reduced the accessibility of international highway transport.
表2 中国及64个沿线国家公路基础数据Tab. 2 Basic highway data of China and 64 countries along the Belt and Road |
| 地区 | 国家 | 公路里程 (km) | 公路密度 (m/km2) | 地区 | 国家 | 公路里程 (km) | 公路密度 (m/km2) |
|---|---|---|---|---|---|---|---|
| 中国 | 1384284.93 | 147.10 | 东北亚 | 蒙古 | 13651.56 | 8.73 | |
| 俄罗斯 | 571598.98 | 33.68 | |||||
| 中东欧 | 阿尔巴尼亚 | 4337.49 | 154.74 | 东南亚 | 文莱 | 1189.92 | 208.15 |
| 白俄罗斯 | 24190.23 | 116.58 | 柬埔寨 | 8786.41 | 48.53 | ||
| 波黑 | 9176.93 | 177.04 | 东帝汶 | 3794.91 | 251.62 | ||
| 保加利亚 | 11248.35 | 99.75 | 印度尼西亚 | 135976.39 | 72.33 | ||
| 克罗地亚 | 20868.90 | 378.90 | 老挝 | 9566.91 | 41.94 | ||
| 捷克 | 25304.06 | 321.28 | 马来西亚 | 41084.16 | 125.30 | ||
| 爱沙尼亚 | 4855.65 | 109.94 | 缅甸 | 30379.93 | 45.81 | ||
| 匈牙利 | 28939.16 | 310.50 | 菲律宾 | 44905.16 | 153.14 | ||
| 拉脱维亚 | 19445.42 | 301.12 | 新加坡 | 2394.31 | 4690.10 | ||
| 立陶宛 | 625.59 | 9.63 | 泰国 | 76614.98 | 148.92 | ||
| 马其顿 | 4802.23 | 193.06 | 越南 | 53663.29 | 163.16 | ||
| 摩尔多瓦 | 7546.02 | 227.24 | 西亚/北非 | 亚美尼亚 | 4025.00 | 136.03 | |
| 黑山 | 1932.64 | 142.57 | 阿塞拜疆 | 10652.67 | 123.51 | ||
| 波兰 | 37617.75 | 120.12 | 巴林 | 630.94 | 1078.62 | ||
| 塞尔维亚 | 17409.63 | 196.75 | 埃及 | 40728.31 | 40.68 | ||
| 罗马尼亚 | 48175.88 | 203.81 | 格鲁吉亚 | 6984.80 | 100.40 | ||
| 斯洛伐克 | 9273.17 | 191.37 | 伊朗 | 132854.36 | 81.88 | ||
| 斯洛文尼亚 | 5482.93 | 269.73 | 伊拉克 | 32882.99 | 75.18 | ||
| 乌克兰 | 60614.40 | 106.22 | 以色列 | 9580.97 | 440.56 | ||
| 中亚 | 哈萨克斯坦 | 44934.00 | 16.58 | 约旦 | 6731.15 | 76.21 | |
| 吉尔吉斯斯坦 | 6854.92 | 34.45 | 科威特 | 3783.15 | 216.51 | ||
| 塔吉克斯坦 | 1334.72 | 9.38 | 黎巴嫩 | 4984.86 | 498.49 | ||
| 土库曼斯坦 | 8972.51 | 19.18 | 阿曼 | 14218.96 | 45.69 | ||
| 乌兹别克斯坦 | 15620.27 | 35.57 | 巴勒斯坦 | 2663.65 | 435.22 | ||
| 南亚 | 孟加拉国 | 17552.14 | 128.21 | 卡特尔 | 4005.84 | 359.27 | |
| 不丹 | 2582.49 | 63.98 | 沙特阿拉伯 | 88518.49 | 46.06 | ||
| 印度 | 484581.46 | 153.66 | 叙利亚 | 23157.27 | 124.54 | ||
| 马尔代夫 | 15.45 | 142.07 | 土耳其 | 109398.01 | 140.24 | ||
| 尼泊尔 | 10682.55 | 72.62 | 阿富汗 | 19899.26 | 30.99 | ||
| 巴基斯坦 | 69971.92 | 80.16 | 也门 | 17252.70 | 38.08 | ||
| 斯里兰卡 | 15368.49 | 231.83 | 阿拉伯联合酋长国 | 14951.21 | 210.33 |
注:公路里程和公路密度仅包含Motorway、Trunk、Primary、Secondary四类公路。 |
表3 “一带一路”区域公路通行能力权重Tab. 3 Weights of highway traffic capacity in the Belt and Road Initiative area |
| 高速公路/快速公路 | 主干公路 | 主要公路 | 次要公路 | |
|---|---|---|---|---|
| 权重 | 0.4 | 0.3 | 0.2 | 0.1 |
表4 各级公路时速和时间成本Tab. 4 Speed and time cost of highways |
| 高速公路/快速公路 | 主干公路 | 主要公路 | 次要公路 | 水路 | 陆地 | |
|---|---|---|---|---|---|---|
| 速度(km/h) | 100 | 80 | 60 | 50 | 30 | 5 |
| 时间成本(min) | 0.60 | 0.75 | 1.00 | 1.20 | 2.00 | 12.00 |
衷心感谢匿名评审专家在论文评审中所付出的时间和精力。评审专家在文献评述、方法修正、结果分析、结论梳理及细节等方面提出的修改意见,使本文获益匪浅。
| [1] |
|
| [2] |
王成, 王茂军, 杨勃. 港口航运关联与港城职能的耦合关系研判: 以“21世纪海上丝绸之路”沿线主要港口城市为例. 经济地理, 2018,38(11):158-165.
[
|
| [3] |
牟乃夏, 廖梦迪, 张恒才, 等. “海上丝绸之路”沿线重要港口区位优势度评估. 地球信息科学学报, 2018,20(5):613-622.
[
|
| [4] |
王姣娥, 王涵, 焦敬娟. “一带一路”与中国对外航空运输联系. 地理科学进展, 2015,34(5):554-562.
[
|
| [5] |
|
| [6] |
莫辉辉, 王姣娥, 宋周莺. 丝绸之路经济带国际集装箱陆路运输的经济适应范围. 地理科学进展, 2015,34(5):581-588.
[
|
| [7] |
曹小曙, 李涛, 杨文越, 等. 基于陆路交通的丝绸之路经济带可达性与城市空间联系. 地理科学进展, 2015,34(6):657-664.
[
|
| [8] |
王姣娥, 焦敬娟, 景悦, 等. “中欧班列”陆路运输腹地范围测算与枢纽识别. 地理科学进展, 2017,36(11):1332-1339.
[
|
| [9] |
|
| [10] |
初楠臣, 张平宇. 基于可达性的中俄跨国班列沿线城市经济联系: 以中俄K19/K20班列为例. 经济地理, 2018,38(6):10-18.
[
|
| [11] |
吴威, 曹有挥, 张璐璐, 等. 基于供给侧的区域交通发展水平综合评价: 以中国三大城市群为例. 地理科学, 2018,38(4):495-503.
[
|
| [12] |
|
| [13] |
孟嘉铭. 港口公路集疏运货运交通量预测及交通配流研究. 北京: 北京交通大学硕士学位论文, 2012.
[
|
| [14] |
[
|
| [15] |
宋周莺, 车姝韵, 王姣娥, 等. 中国沿边口岸的时空格局及功能模式. 地理科学进展, 2015,34(5):589-597.
[
|
| [16] |
国家信息中心. “一带一路”贸易合作大数据报告(2018). 大连: 大连翰闻咨询有限公司, 2018.
[ State Information Center. Big Data Report on Trade Cooperation under the Belt and Road Initiative. Dalian: SINOIMEX, 2018.]
|
| [17] |
|
| [18] |
|
| [19] |
|
| [20] |
|
| [21] |
曹小曙, 薛德升, 阎小培. 中国干线公路网络联结的城市通达性. 地理学报, 2005,60(6):903-910.
[
|
| [22] |
王成金, 程佳佳. 中国高速公路网的可达性格局及演化. 地理科学, 2016,36(6):803-812.
[
|
| [23] |
吴威, 曹有挥, 曹卫东, 等. 长江三角洲公路网络的可达性空间格局及其演化. 地理学报, 2006,61(10):1065-1074.
[
|
| [24] |
梅志雄, 徐颂军, 欧阳军. 珠三角公路网络可达性空间格局及其演化. 热带地理, 2014,34(1):27-33, 103.
[
|
| [25] |
蒋晓威, 曹卫东, 罗健, 等. 安徽省公路网络可达性空间格局及其演化. 地理科学进展, 2012,31(12):1591-1599.
[
|
| [26] |
蒋海兵, 张文忠, 祁毅, 等. 基于可达性分析的高速公路投资空间溢出效应. 地理研究, 2014,33(1):71-82.
[
|
| [27] |
李晨曦, 吴克宁, 高星, 等. 基于潜力模型的城市公路网络可达性及经济联系分析: 以唐山市为例. 现代城市研究, 2017, (2):108-113.
[
|
| [28] |
|
| [29] |
|
| [30] |
刘贤腾. 空间可达性研究综述. 城市交通, 2007, (6):36-43.
[
|
| [31] |
|
| [32] |
寇培颖, 牛铮, 刘正佳, 等. 基于自发地理信息的“一带一路”区域陆路交通状况分析. 地球信息科学学报 , 2018,20(8):1074-1082.
[
|
| [33] |
|
| [34] |
罗路长, 刘波, 刘雪朝. Open Street Map路网数据质量评价及应用分析. 江西科学, 2017,35(1):151-157.
[
|
| [35] |
吴威, 曹有挥, 梁双波, 等. 中国铁路客运网络可达性空间格局. 地理研究, 2009,28(5):1389-1400.
[
|
| [36] |
王武林, 杨文越, 曹小曙. 中国集中连片特困地区公路交通优势度及其对经济增长的影响. 地理科学进展, 2015,34(6):665-675.
[
|
| [37] |
王振波, 徐建刚, 朱传耿, 等. 中国县域可达性区域划分及其与人口分布的关系. 地理学报, 2010,65(4):416-426.
[
|
| [38] |
|
| [39] |
潘竟虎, 从忆波. 中国4A级及以上旅游景点(区)空间可达性测度. 地理科学, 2012,32(11):1321-1327.
[
|
/
| 〈 |
|
〉 |