
中国电子机械制造业产品内出口贸易空间布局
|
李振发(1993-),男,河北承德人,博士研究生,研究方向为经济地理和区域发展。E-mail: zhenfa.li.19@ucl.ac.uk |
收稿日期: 2019-09-30
录用日期: 2020-05-25
网络出版日期: 2021-03-10
基金资助
国家自然科学基金项目(41731278)
版权
Spatial distribution of intra-product export trade of electronic machinery manufacturing products in China
Received date: 2019-09-30
Accepted date: 2020-05-25
Online published: 2021-03-10
Copyright
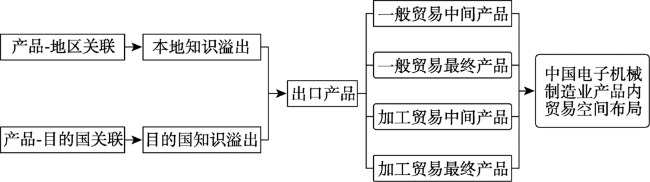
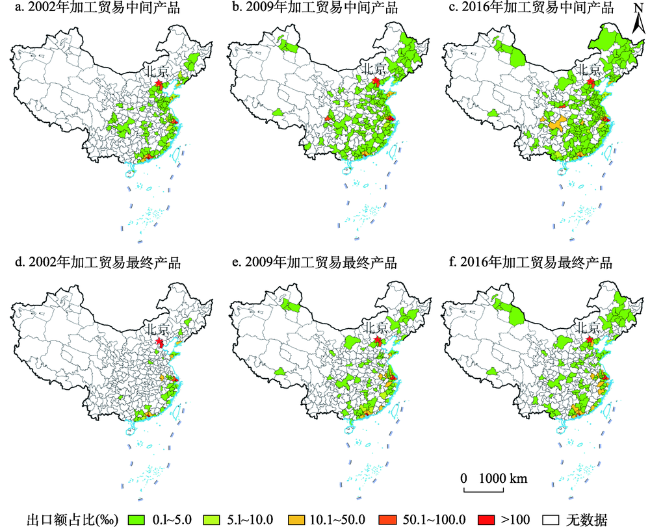
电子机械制造业产品在中国对外贸易中占有重要地位,以产品内贸易视角研究其出口空间布局有助于剖析中国出口体系结构特征。在区分中间、最终产品,一般、加工贸易的前提下,本文观察了出口所在地和目的国两个维度中国电子机械制造业产品出口企业空间布局,并基于技术关联探讨了其动态演化的驱动因素。结果如下:① 在全国层面,除加工贸易最终产品外,一般贸易中间产品、加工贸易中间产品和一般贸易最终产品与某地产品结构的技术关联程度越高,对应的出口企业越可能到该地进行出口。在东部地区,上述关系在4类产品中均存在,而在中部和西部地区,其只存在于一般贸易产品。② 一般贸易产品与某国从中国进口的产品结构技术关联程度越高,对应企业越倾向于出口到该国。但依据收入水平将目的国分组后,这种促进关系在高收入国家中不存在。加工贸易产品出口企业目的国布局与对应技术关联程度无明显关系。
李振发 , 贺灿飞 . 中国电子机械制造业产品内出口贸易空间布局[J]. 地理研究, 2021 , 40(1) : 119 -137 . DOI: 10.11821/dlyj020190854
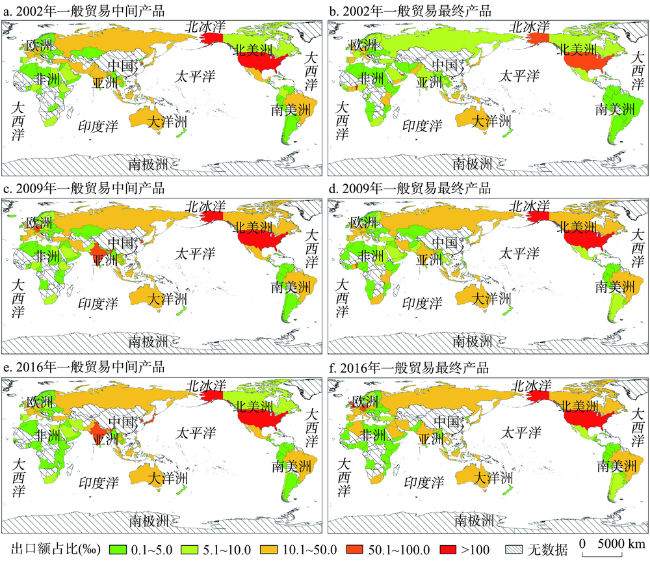
Electronic machinery manufacturing products have occupied a crucial position in trading activities of China and studying the spatial pattern of such products from the perspective of intra-product trade can help to understand the Chinese trading system better. After differentiating intermediate/final products and general/processing trading modes, this study analyzes the spatial distribution of enterprises in China exporting electronic machinery manufacturing products in the aspects of export places and trading partners, and explains the distribution based on the technological relatedness. The findings are as follows. As for the descriptive part, firstly, firms of the general trading mode are located in more cities than those trading processing products, in which the latter prefers to agglomerate in the eastern region. Similarly, firms exporting intermediate products are more scattered in the inner areas. Secondly, firms exporting intermediate products export to most of countries, while those with final products mainly concentrate in developing countries. In other words, developed countries, mainly in America and Europe, import more intermediate products from China. In addition, the firms with final products, particularly the ones under the general trading mode, tend to export more to the developing countries represented by those in Africa and South America. As for the empirical part based on econometric models, first of all, at the national level, for enterprises with intermediate products under both the general and processing modes, and the ones with final products under the general mode, the higher degree of their technological relatedness to the local product structure, the greater chances they come to this place to export. In the eastern region of China, such positive correlation also exists in firms with final products under the processing mode. When it comes to the central and western regions, this promoting effect of technological relatedness on exporting behaviors only exists in the general-trade enterprises. Next, for firms exporting products under the general mode, the higher degree of their technological relatedness to the product structure imported from China of a certain country, the easier they select the country as one of the trading partners. This relation is not robust for firms with products under the processing mode. Moreover, when dividing countries into different groups by income levels, such promoting effect is validated in general-trade firms exporting to countries of middle- and low-income groups, while it is insignificant in the high-income destinations.
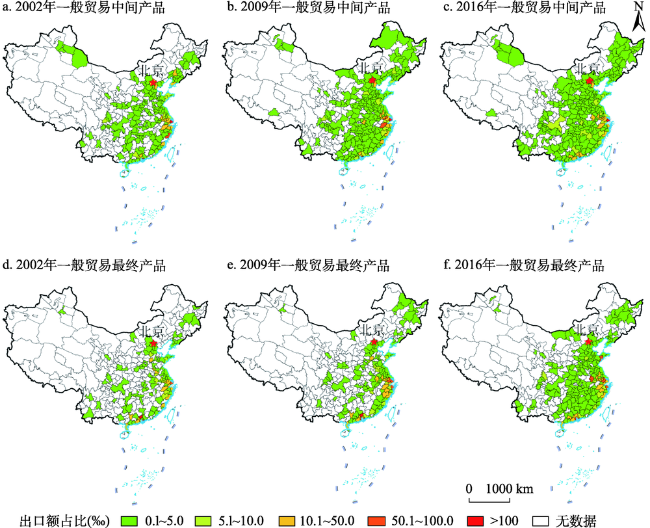
图2 中国一般贸易电子机械制造业中间、最终产品出口额占比注:此图基于国家自然资源部标准地图服务系统的标准地图(审图号:GS(2020)3183号)绘制,底图无修改。 Fig. 2 The proportion of total export of electronic machinery products under the general mode in China |
图4 中国一般贸易电子机械制造业中间、最终产品出口额占比(目的国维度)注:此图基于国家自然资源部标准地图服务系统的标准地图(审图号:GS(2016)1667号)绘制,底图无修改 Fig. 4 The proportion of total export of electronic machinery products under the general mode of China (trading country dimension) |
表1 出口地维度回归结果Tab. 1 Empirical results of export places |
| 变量 | 一般贸易中间产品 | 加工贸易中间产品 | |||||
|---|---|---|---|---|---|---|---|
| 模型(1) | 模型(2) | 模型(3) | 模型(1) | 模型(2) | 模型(3) | ||
| Density | 3.804*** | 2.152** | |||||
| Labor_edu | -0.002** | -0.002* | -0.002* | 0.003*** | 0.003*** | 0.003** | |
| GY_porp | -0.240 | -0.276 | -0.302 | 0.098* | 0.102* | 0.100* | |
| SY_porp | -0.318** | -0.294** | -0.278* | -0.061 | -0.031 | -0.018 | |
| WZ_porp | -0.309* | -0.305 | -0.303 | 0.003 | 0.002 | 0.002 | |
| lnGLLC | 0.141 | 0.142 | 0.132 | 0.102 | 0.098 | 0.078 | |
| Zone_all | 0.028 | 0.027 | 0.025 | 0.013 | 0.012 | 0.008 | |
| lnZZYB_value | 0.023* | 0.012 | |||||
| lnFDI | 0.015 | 0.021 | 0.113* | 0.115* | |||
| lnZZJG_value | 0.020 | 0.009 | |||||
| lnLoan | -0.094 | 0.350* | |||||
| _cons | -1.178 | -2.180 | -1.755 | -2.141 | -2.403* | -3.561** | |
| N | 2274 | 2178 | 2153 | 2993 | 2909 | 2891 | |
| 变量 | 一般贸易最终产品 | 加工贸易最终产品 | |||||
| 模型(1) | 模型(2) | 模型(3) | 模型(1) | 模型(2) | 模型(3) | ||
| Density | 6.027*** | 0.165 | |||||
| Labor_edu | -0.001 | 0.000 | -0.001 | 0.003*** | 0.003*** | 0.003*** | |
| GY_porp | -0.320* | -0.330* | -0.295 | 0.008 | 0.003 | -0.002 | |
| SY_porp | -0.277** | -0.166 | -0.151 | 0.007 | 0.007 | 0.008* | |
| WZ_porp | -0.229 | -0.240 | -0.177 | -0.048 | -0.038 | -0.028 | |
| lnGLLC | 0.163 | 0.132 | 0.173 | 0.277 | 0.208 | 0.265 | |
| Zone_all | 0.004 | 0.012 | 0.009 | 0.024 | 0.019 | 0.019 | |
| lnZZYB_value | 0.028** | 0.032* | |||||
| lnFDI | 0.093* | 0.090* | 0.182** | 0.150* | |||
| lnZZJG_value | 0.016* | 0.038*** | |||||
| lnLoan | 0.137 | 0.109 | |||||
| _cons | -1.452 | -1.535 | -2.270 | -3.866 | -5.877* | -7.108* | |
| N | 2543 | 2482 | 2454 | 2603 | 2560 | 2543 | |
注:*、**、***分别表示p<0.05、p<0.01、p<0.001。下同。 |
表2 出口地维度回归结果(东部地区)Tab. 2 Empirical results of export places (the eastern region) |
| 变量 | 一般贸易中间产品 | 加工贸易中间产品 | |||||
|---|---|---|---|---|---|---|---|
| 模型(1) | 模型(2) | 模型(3) | 模型(1) | 模型(2) | 模型(3) | ||
| Density | 5.294** | 4.633*** | |||||
| Labor_edu | -0.006*** | -0.006*** | -0.007** | 0.001 | 0.000 | 0.000 | |
| GY_porp | -0.517 | -0.535 | -0.428 | 0.157** | 0.167** | 0.161** | |
| SY_porp | -0.146 | -0.114 | -0.116 | -0.019 | -0.021 | -0.011 | |
| WZ_porp | 0.221 | 0.042 | 0.134 | 0.050 | 0.051 | 0.055 | |
| lnGLLC | 1.706** | 1.540* | 1.545* | 0.148 | 0.114 | 0.072 | |
| Zone_all | 0.006 | 0.001 | 0.003 | -0.041 | -0.042 | -0.046 | |
| lnZZYB_value | 0.055* | 0.040** | |||||
| lnFDI | 0.094 | 0.126 | 0.117 | 0.115 | |||
| lnZZJG_value | 0.043 | 0.015 | |||||
| lnLoan | 0.460 | 0.365 | |||||
| _cons | -12.710** | -12.520** | -14.390** | -1.466 | -2.048 | -3.553 | |
| N | 432 | 432 | 426 | 920 | 920 | 914 | |
| 变量 | 一般贸易最终产品 | 加工贸易最终产品 | |||||
| 模型(1) | 模型(2) | 模型(3) | 模型(1) | 模型(2) | 模型(3) | ||
| Density | 7.704*** | 7.548*** | |||||
| Labor_edu | -0.003** | -0.003** | -0.003** | 0.001 | 0.001 | 0.001 | |
| GY_porp | -0.382 | -0.357 | -0.356 | 0.223 | 0.296 | 0.239 | |
| SY_porp | -0.157 | -0.144 | -0.073 | -0.003 | -0.003 | -0.001 | |
| WZ_porp | -0.091 | -0.089 | -0.015 | -0.229 | -0.285 | -0.228 | |
| lnGLLC | 1.049*** | 1.071** | 1.075*** | 0.246 | 0.321 | 0.263 | |
| Zone_all | 0.008 | 0.017 | 0.007 | 0.003 | 0.007 | -0.002 | |
| lnZZYB_value | 0.0470* | 0.070* | |||||
| lnFDI | 0.122 | 0.096 | 0.119 | 0.058 | |||
| lnZZJG_value | 0.014 | 0.051** | |||||
| lnLoan | 0.505 | 0.377 | |||||
| _cons | -8.404*** | -9.742*** | -11.410*** | -5.360 | -6.145 | -7.903 | |
| N | 822 | 822 | 816 | 1059 | 1059 | 1053 | |
表3 出口地维度回归结果(中部地区)Tab. 3 Empirical results of export places (the central region) |
| 变量 | 一般贸易中间产品 | 加工贸易中间产品 | |||||
|---|---|---|---|---|---|---|---|
| 模型(1) | 模型(2) | 模型(3) | 模型(1) | 模型(2) | 模型(3) | ||
| Density | 3.034* | 0.158 | |||||
| Labor_edu | 0.000 | 0.000 | 0.000 | 0.003** | 0.003** | 0.003* | |
| GY_porp | -0.250 | -0.223 | -0.220 | -0.014 | -0.016 | -0.021 | |
| SY_porp | -0.301 | -0.282 | -0.278 | 0.065 | 0.076 | 0.134 | |
| WZ_porp | -0.293 | -0.266 | -0.309 | 0.005* | 0.005* | 0.005** | |
| lnGLLC | 0.007 | -0.049 | -0.058 | 0.234 | 0.221 | 0.156 | |
| Zone_all | 0.039 | 0.045 | 0.043 | 0.084** | 0.084** | 0.084** | |
| lnZZYB_value | 0.012 | -0.005 | |||||
| lnFDI | -0.015 | -0.017 | 0.001 | -0.006 | |||
| lnZZJG_value | 0.012 | -0.017 | |||||
| lnLoan | 0.182 | 0.708 | |||||
| _cons | -3.005 | -2.455 | -3.294 | -5.222* | -5.073 | -9.376* | |
| N | 1126 | 1120 | 1106 | 1266 | 1261 | 1253 | |
| 变量 | 一般贸易最终产品 | 加工贸易最终产品 | |||||
| 模型(1) | 模型(2) | 模型(3) | 模型(1) | 模型(2) | 模型(3) | ||
| Density | 5.630** | -1.391 | |||||
| Labor_edu | -0.001 | -0.001 | -0.001 | 0.004*** | 0.005*** | 0.005** | |
| GY_porp | -0.315 | -0.316 | -0.297 | -0.993*** | -1.000*** | -1.066*** | |
| SY_porp | -0.091 | 0.004 | -0.040 | -0.057 | -0.085 | -0.195 | |
| WZ_porp | -0.496 | -0.513 | -0.428 | -0.271 | -0.276 | -0.304 | |
| lnGLLC | -0.194 | -0.234 | -0.217 | -0.101 | -0.092 | 0.001 | |
| Zone_all | -0.002 | 0.003 | 0.004 | 0.009 | 0.009 | 0.012 | |
| lnZZYB_value | 0.018 | 0.003 | |||||
| lnFDI | 0.017 | 0.008 | 0.062 | 0.074 | |||
| lnZZJG_value | 0.020 | 0.048** | |||||
| lnLoan | 0.205 | 0.201 | |||||
| _cons | 1.385 | 1.477 | 0.359 | -3.338 | -4.225 | -6.899 | |
| N | 1093 | 1088 | 1080 | 996 | 994 | 986 | |
表4 出口地维度回归结果(西部地区)Tab. 4 Empirical results of export places (the western region) |
| 变量 | 一般贸易中间产品 | 加工贸易中间产品 | |||||
|---|---|---|---|---|---|---|---|
| 模型(1) | 模型(2) | 模型(3) | 模型(1) | 模型(2) | 模型(3) | ||
| Density | 4.144* | 1.588 | |||||
| Labor_edu | -0.003 | -0.003 | -0.003 | 0.003* | 0.003 | 0.002 | |
| GY_porp | -0.197 | -0.410 | -0.462 | -0.035 | 0.045 | 0.105 | |
| SY_porp | -0.431* | -0.424* | -0.391* | -0.227 | -0.130 | -0.151 | |
| WZ_porp | -0.608 | -0.592 | -0.597 | -0.003 | -0.003 | -0.003 | |
| lnGLLC | -0.291 | -0.245 | -0.271 | 0.454 | 0.481 | 0.631 | |
| Zone_all | -0.080 | -0.098 | -0.089 | -0.018 | -0.033 | -0.067 | |
| lnZZYB_value | 0.015 | 0.009 | |||||
| lnFDI | 0.024 | 0.028 | 0.079 | 0.087 | |||
| lnZZJG_value | 0.003 | 0.057* | |||||
| lnLoan | -0.029 | 1.467** | |||||
| _cons | 6.331* | 5.797 | 6.246 | -6.916* | -7.588* | -17.330*** | |
| N | 716 | 626 | 621 | 807 | 728 | 724 | |
| 变量 | 一般贸易最终产品 | 加工贸易最终产品 | |||||
| 模型(1) | 模型(2) | 模型(3) | 模型(1) | 模型(2) | 模型(3) | ||
| Density | 5.097* | -4.390 | |||||
| Labor_edu | 0.001 | 0.001 | 0.001 | 0.004** | 0.004* | 0.003* | |
| GY_porp | -0.488 | -0.522 | -0.483 | -0.279 | -0.368 | -0.417 | |
| SY_porp | -1.070*** | -0.809*** | -0.798*** | 0.026 | 0.028* | 0.033* | |
| WZ_porp | -0.285 | -0.313 | -0.283 | -2.141* | -2.233** | -2.472** | |
| lnGLLC | -0.110 | -0.323 | -0.219 | 1.314** | 0.758 | 1.014 | |
| Zone_all | -0.064 | -0.072 | -0.084 | 0.094* | 0.081 | 0.081 | |
| lnZZYB_value | 0.021 | 0.028 | |||||
| lnFDI | 0.145* | 0.155* | 0.274** | 0.258* | |||
| lnZZJG_value | 0.003 | 0.041* | |||||
| lnLoan | 0.068 | 0.437 | |||||
| _cons | -1.943 | -1.574 | -2.558 | -10.740*** | -9.448* | -12.580** | |
| N | 628 | 572 | 558 | 548 | 507 | 504 | |
表5 目的国维度回归结果Tab. 5 Empirical results of trading countries |
| 变量 | 一般贸易中间产品 | 加工贸易中间产品 | 一般贸易最终产品 | 加工贸易最终产品 | |||||||
|---|---|---|---|---|---|---|---|---|---|---|---|
| 模型(1) | 模型(2) | 模型(1) | 模型(2) | 模型(1) | 模型(2) | 模型(1) | 模型(2) | ||||
| Density | 7.847*** | 7.831*** | 5.796** | 4.396 | 6.334*** | 6.313*** | 5.553* | 5.531 | |||
| lntbt | 0.002 | -0.009 | -0.014 | 0.014 | |||||||
| lnGEOdist | 7.471* | -3.648 | 0.652 | -2.049 | -0.633 | -0.791 | 3.807 | -3.343 | |||
| lnINSTdist | -0.495 | -0.412 | 0.030 | 0.963 | -0.269 | 0.213 | 0.684 | 0.492 | |||
| lnpgdp | 0.079 | 0.078 | 0.191* | 0.178* | -0.055 | -0.057 | 0.284*** | 0.284*** | |||
| lnadp | -0.019 | 0.032 | -0.004 | 0.041 | |||||||
| cons | -63.050* | 31.850 | -7.130 | 14.160 | 4.599 | 5.844 | -34.550 | 25.330 | |||
| N | 962 | 870 | 1485 | 1399 | 1317 | 1198 | 1892 | 1742 | |||
表6 目的国维度回归结果(高收入国家)Tab. 6 Empirical results of trading countries (the high-income group) |
| 变量 | 一般贸易中间产品 | 加工贸易中间产品 | 一般贸易最终产品 | 加工贸易最终产品 | |||||||
|---|---|---|---|---|---|---|---|---|---|---|---|
| 模型(1) | 模型(2) | 模型(1) | 模型(2) | 模型(1) | 模型(2) | 模型(1) | 模型(2) | ||||
| Density | -9.289 | -12.370 | 3.920 | 4.164 | -1.209 | 0.211 | 6.579 | 7.001 | |||
| lntbt | -0.266 | 0.038 | 0.125 | 0.016 | |||||||
| lnGEOdist | -50.630* | -38.210 | -1.986 | -2.131 | -1.892* | -1.441 | 3.077 | 3.245 | |||
| lnINSTdist | 4.290 | 6.548 | 1.562 | 1.376 | 2.090 | 0.922 | -1.790 | -1.997 | |||
| lnadp | 106.700*** | 0.005 | 0.104 | -0.040 | |||||||
| _cons | 487.800* | 362.800 | 16.040 | 17.580 | 16.420* | 13.370 | -27.330 | -28.710 | |||
| N | 54 | 54 | 186 | 186 | 192 | 192 | 294 | 294 | |||
表7 目的国维度回归结果(中等收入国家)Tab. 7 Empirical results of trading countries (the middle-income group) |
| 变量 | 一般贸易中间产品 | 加工贸易中间产品 | 一般贸易最终产品 | 加工贸易最终产品 | |||
|---|---|---|---|---|---|---|---|
| Density | 8.034** | 0.269 | 7.725*** | 2.308 | |||
| lntbt | 0.014 | -0.016 | -0.013 | -0.008 | |||
| lnadp | 0.000 | 0.209*** | 0.239*** | 0.054 | |||
| lnGEOdist | -6.204* | -8.509*** | 2.891 | -4.771 | |||
| lnINSTdist | -0.609 | 0.594 | -0.322 | -0.341 | |||
| _cons | 53.440* | 69.310*** | -26.310 | 39.450 | |||
| N | 392 | 934 | 560 | 920 |
表8 目的国维度回归结果(低收入国家)Tab. 8 Empirical results of trading countries (the low-income group) |
| 变量 | 一般贸易中间产品 | 加工贸易中间产品 | 一般贸易最终产品 | 加工贸易最终产品 |
|---|---|---|---|---|
| Density | 12.890** | 5.575 | 2.130* | 1.370 |
| lntbt | 0.310 | 0.034 | 0.070 | 0.085 |
| lnGEOdist | 1.292 | -0.632* | 1.235 | -0.439 |
| lnINSTdist | -2.576* | -0.856 | 0.782 | -0.476 |
| _cons | -11.340 | 2.988 | -12.240 | 2.725 |
| N | 221 | 374 | 308 | 347 |
衷心感谢二位匿名评审专家在论文评审中提出的宝贵建议,令文章在题目、研究框架、结论与建议部分逻辑更加清晰;模型变量、全文语言、全国与世界图件部分表达更加精炼与规范,令本文受益匪浅。
| [1] |
|
| [2] |
|
| [3] |
施振荣. “微笑曲线”. 竞争力·三联财经, 2010, (4):50-52
[
|
| [4] |
|
| [5] |
|
| [6] |
卢锋. 产品内分工. 经济学(季刊), 2004,4(1):55-82
[
|
| [7] |
|
| [8] |
|
| [9] |
胡昭玲. 产品内国际分工对中国工业生产率的影响分析. 中国工业经济, 2007, (6):30-37
[
|
| [10] |
闫小培, 林耿, 普军, 等. 大珠江三角洲的产业升级与国际竞争力. 经济地理, 2007,27(6):61-65
[
|
| [11] |
杨继军, 张如庆, 张二震. 承接国际服务外包与长三角产业结构升级. 南京社会科学, 2008, (5):1-7
[
|
| [12] |
|
| [13] |
段学军, 虞孝感, 陆大道, 等. 克鲁格曼的新经济地理研究及其意义. 地理学报, 2010,65(2):131-138
[
|
| [14] |
|
| [15] |
|
| [16] |
|
| [17] |
|
| [18] |
张纪. 基于要素禀赋理论的产品内分工动因研究. 世界经济研究, 2013, (5):3-9, 87
[
|
| [19] |
|
| [20] |
|
| [21] |
|
| [22] |
|
| [23] |
|
| [24] |
|
| [25] |
|
| [26] |
|
| [27] |
卢锋. 中国国际收支双顺差现象研究: 对中国外汇储备突破万亿美元的理论思考. 世界经济, 2006,29(11):3-10
[
|
| [28] |
|
| [29] |
|
| [30] |
|
| [31] |
|
| [32] |
|
| [33] |
|
| [34] |
|
| [35] |
|
| [36] |
郭琪. 中国制造业出口多样化及其空间动态演化研究. 北京: 北京大学博士学位论文, 2016: 45
[
|
| [37] |
罗芊. 中国对外出口市场新企业进入研究. 北京: 北京大学硕士学位论文, 2018
[
|
| [38] |
|
| [39] |
|
| [40] |
|
| [41] |
|
| [42] |
|
| [43] |
李振发, 贺灿飞, 黎斌. 中国出口产品地区专业化. 地理科学进展, 2018,37(7):101-113
[
|
| [44] |
张彬, 桑百川. 中国中间产品出口与产业升级研究. 亚太经济, 2013, (6):105-111
[
|
| [45] |
马风涛, 李俊. 国际中间产品贸易的发展及其政策含义. 国际贸易, 2011, (9):12-17
[
|
| [46] |
|
| [47] |
张杰, 郑文平, 翟福昕. 中国出口产品质量得到提升了么? 经济研究, 2014, (10):46-59
[
|
| [48] |
李瑞琴, 王汀汀, 胡翠. FDI与中国企业出口产品质量升级: 基于上下游产业关联的微观检验. 金融研究, 2018,456(6):95-112
[
|
| [49] |
陈琳, 陈敏. 金融抑制是否促进了中国的加工贸易. 财贸研究, 2017, 28(168): 32-40+104
[
|
| [50] |
|
| [51] |
|
| [52] |
袁冬梅, 魏后凯, 于斌. 中国地区经济差距与产业布局的空间关联性: 基于Moran指数的解释. 中国软科学, 2012, (12):90-102
[
|
| [53] |
孔炯炯. 出口产品多样化与贸易绩效: 基于引力模型的分析. 经济与管理, 2009,23(1):9-14
[
|
| [54] |
卢姗. 出口多样性对新兴经济体出口绩效的影响: 基于跨国数据的实证分析. 世界经济研究, 2009, (7):45-49
[
|
/
| 〈 |
|
〉 |