
“人才争夺战”背景下人才流动的空间特征及影响因素——以中国“一流大学”毕业生为例
|
王一凡(1995-),女,安徽合肥人,硕士,研究方向为城市地理。E-mail: vanyeewang@163.com |
收稿日期: 2020-05-20
录用日期: 2020-12-18
网络出版日期: 2021-05-10
基金资助
国家自然科学基金与荷兰研究理事会合作研究项目(72061137072)
国家自然科学基金与荷兰研究理事会合作研究项目(482.19.607)
上海市科技计划项目(20692192100)
中国科学院区域可持续发展分析与模拟重点实验室开放基金(KF2020-10)
版权
Migration of human capital in the context of vying for talent competition: A case study of China's "first-class" university graduates
Received date: 2020-05-20
Accepted date: 2020-12-18
Online published: 2021-05-10
Copyright
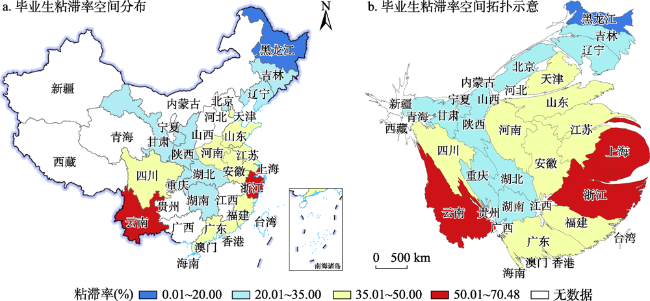
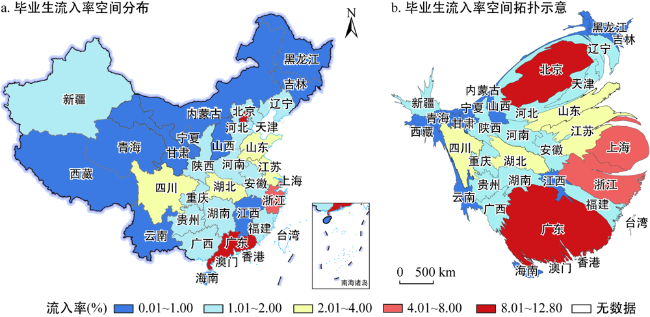
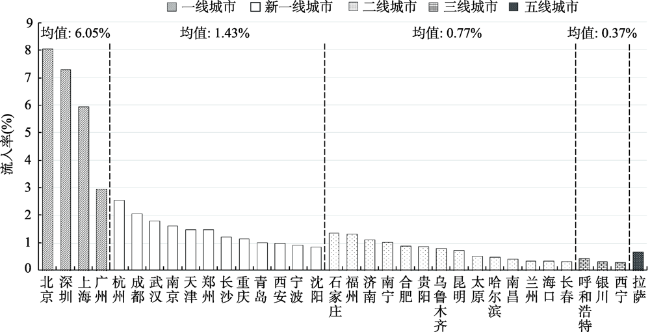
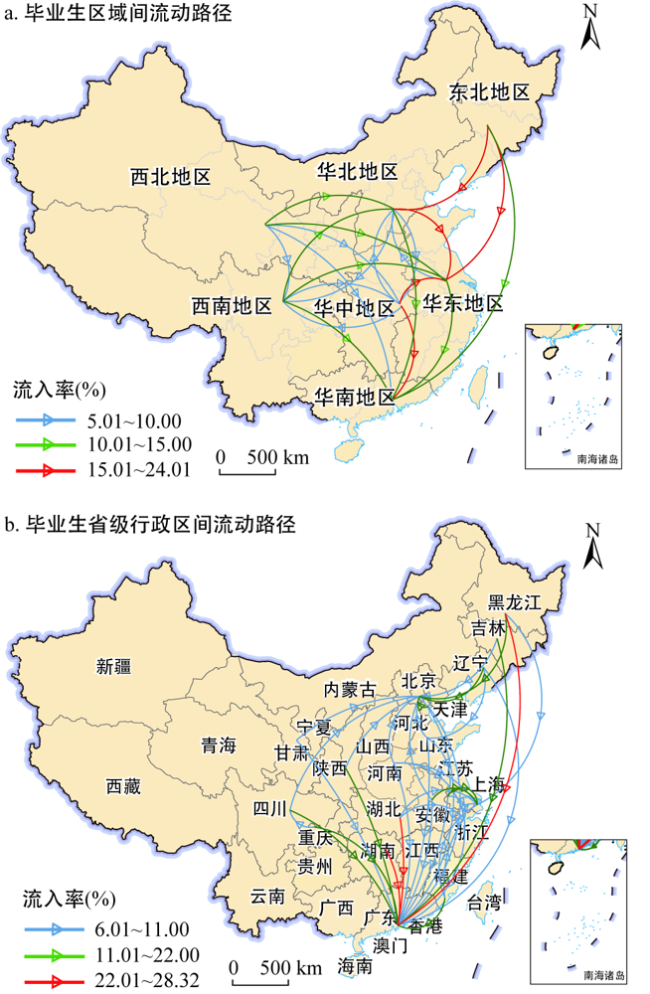
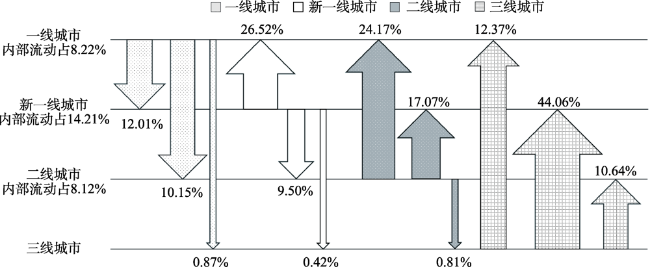
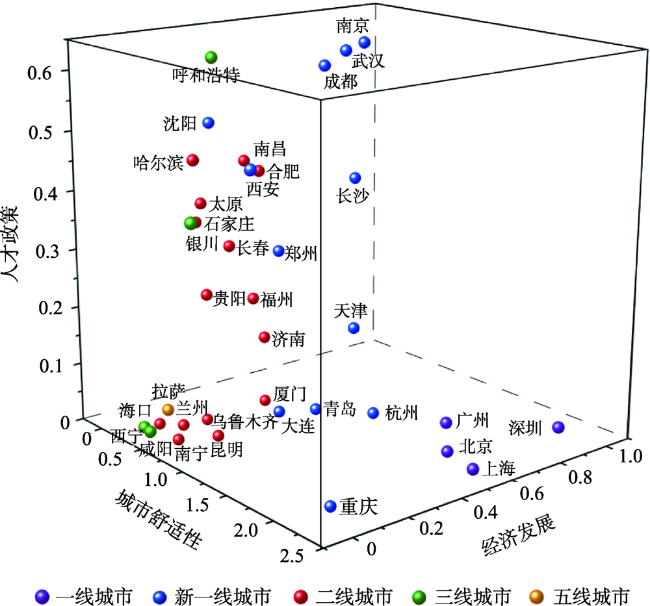
自2017年以来,“人才争夺战”如火如荼,城市步入以人才为核心要素的高维竞争阶段。作为人才争夺战的主要目标和人力资本的重要承载者,本文聚焦中国“一流大学”毕业生,基于2018年《毕业生就业质量报告》,运用Cartogram地图呈现了毕业生的空间流动特征,并梳理政府人才政策文件构建了人才政策评价指标体系,运用有向迁移模型剖析毕业生流动的影响因素。结果表明:① 就学地存在粘滞性,但区域差异显著,毕业生向一线城市集聚。② 城市吸引力水平分异明显,部分城市通过发布人才政策以补充地方经济、舒适性吸引力的不足。③ 经济维度要素与城市舒适性均能有效吸引毕业生流入,较高房价收入比会引发“挤出效应”。人才政策中,落户政策对毕业生流入起激励作用。
王一凡 , 崔璨 , 王强 , 宁越敏 , 杨振山 . “人才争夺战”背景下人才流动的空间特征及影响因素——以中国“一流大学”毕业生为例[J]. 地理研究, 2021 , 40(3) : 743 -761 . DOI: 10.11821/dlyj020200437
Human capital is the key driver of urban innovation and development. In 2017, the "vying for talent" competition was initiated by some second-tier cities, since then cities have been competing each other fiercely for recruiting and retaining talent. This paper focuses on China′s "first-class" university graduates, who are regarded as the main target of the "vying for talent" competition and an important carrier of human capital. Based on 2018 Graduate Employment Reports, this paper demonstrates the spatial mobility of graduates using Cartogram. In addition, an evaluation system for assessing talent policy is constructed through analyses of the talent policies issued by different cities. With a directional migration model, the determinants of graduate mobility are explored. The results reveal that there are significant regional disparities in retention rates, with the geographical patterns of the Y-shaped low-value areas in the northeastern, northwestern, and central regions, and the U-shaped high-value areas covering east coast to southwest. Graduates have been accumulating spatially, and the T-shaped cluster along east coast and the Yangtze River Economic Belt has formed. The spatial patterns of "neighborhood interaction" and "long-distance unidirectional flow" are presented between the city of university and the city of employment. Moreover, the differences in city attractiveness are remarkable. First-tier cities are preferred by graduates, even though limited talent policies have been implemented there. Some second-tier cities have issued talent policies to make up for the lack of attractiveness in economy and amenities. The findings suggest that economic factors, such as income level and technological innovation, as well as amenities including natural and cultural environment, educational resources, and public transportation are positively associated with the volume of graduates inflow. It has been found that a higher ratio of house price to income has squeezed out university graduates. With regard to talent policies, only relaxed hukou policy has a strong effect on attracting graduates, whereas the effects of housing and employment policies are relatively limited. However, it needs to be noted that talent policies may take a longer time to show effects, which requires follow-up investigation. In addition, heterogeneity at the individual level in terms of place of origin, major, etc. should be explored in the future studies.
Key words: university graduates; migration; vying for talent; city attraction
表1 城市人才政策评价指标体系及打分标准Tab. 1 The talent policy indicator system and scoring criteria |
| 要素指标 | 属性指标 | 权重 | 评判标准 | 得分标准 |
|---|---|---|---|---|
| 政策影响面 | 针对对象 | 0.0920 | 全日制本科毕业生 | 5 |
| 有年龄限制的全日制本科毕业生 | 4 | |||
| 限定专业的全日制本科毕业生 | 3 | |||
| 已落户并签订劳动合同的全日制本科毕业生 | 2 | |||
| 已落户、限制专业的全日制本科毕业生 | 1 | |||
| 无优惠政策 | 0 | |||
| 人才落户 | 落户方式 | 0.0991 | 零门槛 | 2 |
| 先就业/缴纳社保再落户 | 1 | |||
| 无落户优惠政策 | 0 | |||
| 人才安居 | 购房补贴 | 0.1453 | 15%~20%(包含20%) | 4 |
| 10%~15%(包含15%) | 3 | |||
| 5%~10%(包含10%) | 2 | |||
| 0%~5%(包含5%) | 1 | |||
| 0% | 0 | |||
| 生活补贴及租房补贴 | 0.1235 | 2000元以上 | 5 | |
| 1500~2000元(包含2000元) | 4 | |||
| 1000~1500元(包含1500元) | 3 | |||
| 600~1000元(包含1000元) | 2 | |||
| 0~600元(包含600元) | 1 | |||
| 0元 | 0 | |||
| 实物配租 | 0.1390 | 政策中有涉及 | 1 | |
| 政策中无涉及 | 0 | |||
| 人才就业创业 | 人才驿站或面试补贴 | 0.1673 | 政策中有涉及 | 1 |
| 政策中无涉及 | 0 | |||
| 就业机会及补贴 | 0.1288 | 针对以下措施政策有涉及:提供基层公共服务岗位/补贴、就业奖励、建设就业见习基地、鼓励企业提供见习岗位/补贴、灵活就业补贴 | 1 | |
| 针对以下措施政策无涉及:提供基层公共服务岗位/补贴、就业奖励、建设就业见习基地、鼓励企业提供见习岗位/补贴、灵活就业补贴 | 0 | |||
| 创业帮扶 | 0.1050 | 针对以下措施政策有涉及:创业场地免租/物业补贴、创业补贴、贷款扶持、创新创业比赛奖励、创新培养培训 | 1 | |
| 针对以下措施政策无涉及:创业场地免租/物业补贴、创业补贴、贷款扶持、创新创业比赛奖励、创新培养培训 | 0 |
注:购房补贴标准,按照购房补贴占当地60平米商品房售价的比例评判。生活补贴及租房补贴为月度标准。 |
表2 城市人才政策得分Tab. 2 Scores of talent policy |
| 城市 | 总指数 | 针对 对象 | 落户 方式 | 购房 补贴 | 生活及 租房补贴 | 实物 配租 | 面试 补贴 | 就业机会 及补贴 | 创业 帮扶 |
|---|---|---|---|---|---|---|---|---|---|
| 成都 | 0.64 | 0.09 | 0.10 | 0.00 | 0.12 | 0.14 | 0.17 | 0.00 | 0.02 |
| 南京 | 0.63 | 0.07 | 0.10 | 0.00 | 0.02 | 0.14 | 0.17 | 0.04 | 0.08 |
| 武汉 | 0.63 | 0.07 | 0.10 | 0.15 | 0.02 | 0.14 | 0.00 | 0.04 | 0.10 |
| 呼和浩特 | 0.61 | 0.09 | 0.10 | 0.07 | 0.00 | 0.14 | 0.17 | 0.00 | 0.04 |
| 沈阳 | 0.53 | 0.07 | 0.10 | 0.04 | 0.02 | 0.00 | 0.17 | 0.09 | 0.04 |
| 哈尔滨 | 0.48 | 0.09 | 0.10 | 0.00 | 0.02 | 0.14 | 0.00 | 0.09 | 0.04 |
| 西安 | 0.46 | 0.07 | 0.10 | 0.00 | 0.00 | 0.14 | 0.00 | 0.09 | 0.06 |
| 南昌 | 0.45 | 0.09 | 0.10 | 0.00 | 0.02 | 0.00 | 0.00 | 0.13 | 0.10 |
| 合肥 | 0.44 | 0.07 | 0.10 | 0.00 | 0.10 | 0.00 | 0.00 | 0.09 | 0.08 |
| 长沙 | 0.41 | 0.09 | 0.10 | 0.00 | 0.02 | 0.00 | 0.00 | 0.09 | 0.10 |
| 太原 | 0.38 | 0.09 | 0.10 | 0.07 | 0.07 | 0.00 | 0.00 | 0.00 | 0.04 |
| 石家庄 | 0.38 | 0.09 | 0.10 | 0.07 | 0.05 | 0.00 | 0.00 | 0.00 | 0.06 |
| 银川 | 0.34 | 0.02 | 0.00 | 0.11 | 0.05 | 0.14 | 0.00 | 0.00 | 0.02 |
| 长春 | 0.32 | 0.04 | 0.00 | 0.07 | 0.02 | 0.14 | 0.00 | 0.00 | 0.04 |
| 郑州 | 0.32 | 0.09 | 0.10 | 0.04 | 0.02 | 0.00 | 0.00 | 0.00 | 0.06 |
| 贵阳 | 0.23 | 0.09 | 0.10 | 0.00 | 0.00 | 0.00 | 0.00 | 0.04 | 0.00 |
| 福州 | 0.22 | 0.07 | 0.10 | 0.00 | 0.00 | 0.00 | 0.00 | 0.04 | 0.00 |
| 天津 | 0.17 | 0.07 | 0.10 | 0.00 | 0.00 | 0.00 | 0.00 | 0.00 | 0.00 |
| 济南 | 0.14 | 0.09 | 0.05 | 0.00 | 0.00 | 0.00 | 0.00 | 0.00 | 0.00 |
注:未发布人才政策的城市得分均为0,此表中省略。 |
表3 模型变量描述Tab. 3 Description of independent variables in the models |
| 变量 | 指标 | 具体指标(单位) |
|---|---|---|
| 人才政策 | 人才落户 | 人才落户指数 |
| 人才安居 | 人才安居指数 | |
| 人才就业创业指数 | 人才就业指数 | |
| 经济发展 | 平均收入 | 2017年在岗职工平均工资(万元) |
| 就业机会 | 2017年登记失业率(%) | |
| 科技创新 | 2017年人均专利授权数量(个/万人) | |
| 生活成本 | 2017年房价收入比(1/m2) | |
| 城市舒适性 | 自然环境 | 平均温差(℃) |
| 文化资源 | 人均电影院数量(个/百万人) | |
| 教育资源 | 普通小学生师比(万人/人) | |
| 交通资源 | 人均公共汽车运营数量(辆/万人) | |
| 控制变量 | 人口规模 | 2017年常住人口数量(千万人) |
| 人力资本 | 2010年6岁以上人口中大专及以上学历人口占比(%) | |
| 地理距离 | 城市间欧氏距离(100 km) |
表4 有向迁移模型结果Tab. 4 Results of directional migration model |
| 具体指标 | 模型1 | 模型2 | 模型3 | 模型4 | 模型5 |
|---|---|---|---|---|---|
| 人才政策总指数 | -0.405** | ||||
| (0.159) | |||||
| 人才落户指数 | 4.810*** | ||||
| (0.950) | |||||
| 人才安居指数 | -1.001*** | ||||
| (0.351) | |||||
| 人才就业创业指数 | -2.140*** | ||||
| (0.473) | |||||
| 平均工资 | 0.130*** | 0.090*** | 0.054* | 0.055* | |
| (0.023) | (0.025) | (0.029) | (0.028) | ||
| 失业率 | -0.039 | 0.087* | 0.147*** | 0.094* | |
| (0.047) | (0.045) | (0.051) | (0.051) | ||
| 人均专利授权数量 | 0.044*** | 0.026*** | 0.030*** | 0.020*** | |
| (0.005) | (0.005) | (0.005) | (0.005) | ||
| 房价收入比 | 0.108 | -2.127*** | -3.000*** | -2.115*** | |
| (0.666) | (0.768) | (0.837) | (0.814) | ||
| 平均温差 | 0.067*** | 0.071*** | 0.069*** | ||
| (0.008) | (0.008) | (0.008) | |||
| 人均电影院数量 | 0.052*** | 0.051*** | 0.084*** | ||
| (0.010) | (0.010) | (0.011) | |||
| 普通小学生师比 | -0.059*** | -0.061*** | -0.093*** | ||
| (0.016) | (0.016) | (0.016) | |||
| 人均公共汽车运营数量 | 0.043*** | 0.049*** | 0.035*** | ||
| (0.014) | (0.014) | (0.014) | |||
| 常住人口 | 0.047* | -0.067*** | -0.146*** | -0.146*** | -0.151*** |
| (0.028) | (0.023) | (0.023) | (0.023) | (0.023) | |
| 大专以上学历占比 | 0.034*** | -0.063*** | -0.022** | -0.011 | -0.005 |
| (0.007) | (0.008) | (0.009) | (0.010) | (0.009) | |
| 欧式距离 | -0.044*** | -0.035*** | -0.049*** | -0.051*** | -0.051*** |
| (0.008) | (0.006) | (0.006) | (0.006) | (0.006) | |
| Constant | -2.835*** | -2.806*** | -2.723*** | -2.688*** | -2.713*** |
| (0.113) | (0.087) | (0.078) | (0.078) | (0.076) | |
| Observations | 540 | 540 | 540 | 540 | 540 |
| R-squared | 0.097 | 0.487 | 0.599 | 0.604 | 0.630 |
注:***p<0.01,**p<0.05,*p<0.1;括号内为标准误差。 |
真诚感谢二位匿名评审专家在论文评审中所付出的时间和精力,评审专家对本文结果分析、模型变量选取、结论和理论贡献梳理等方面的修改意见,使本文获益匪浅。
| [1] |
|
| [2] |
夏怡然, 陆铭. 跨越世纪的城市人力资本足迹: 历史遗产、政策冲击和劳动力流动. 经济研究, 2019,54(1):132-149.
[
|
| [3] |
杨钋, 门垚, 马莉萍. 高校毕业生就业流动现状的分析. 国家教育行政学院学报, 2011, (4):75-80.
[
|
| [4] |
|
| [5] |
|
| [6] |
|
| [7] |
何仲禹, 翟国方. 我国大学生就业城市选择意愿及其影响因素分析. 人文地理, 2015,30(2):37-42+102.
[
|
| [8] |
聂晶鑫, 刘合林. 中国人才流动的地域模式及空间分布格局研究. 地理科学, 2018,38(12):1979-1987.
[
|
| [9] |
葛玉好, 牟小凡, 刘峰. 大学生就业地域选择的影响因素分析: 基于扩展的托达罗人口流动模型. 中国人民大学教育学刊, 2011, (4):81-89.
[
|
| [10] |
朱迪. 北上广还是二线?: 大学毕业生就业区域流向分析. 中国青年研究, 2015, (11):96-102.
[
|
| [11] |
Higher Education Statistics Agency. Destinations of leavers from higher education2016/17. (2018-07-19)[2020-05-20]. https://www.hesa.ac.uk/data-and-analysis/publications/destinations-2016-17.
|
| [12] |
|
| [13] |
|
| [14] |
马莉萍, 潘昆峰. 留还是流?: 高校毕业生就业地选择与生源地、院校地关系的实证研究. 清华大学教育研究, 2013,34(5):118-124.
[
|
| [15] |
|
| [16] |
|
| [17] |
|
| [18] |
|
| [19] |
刘晔, 王若宇, 薛德升, 等. 中国高技能劳动力与一般劳动力的空间分布格局及其影响因素. 地理研究, 2019,38(8):1949-1964.
[
|
| [20] |
|
| [21] |
|
| [22] |
张抗私, 周晓蒙. 大学毕业生就业的省际流动特征及其影响因素. 人口与经济, 2018, (1):69-78.
[
|
| [23] |
赵晶晶, 盛玉雪, 蒋承. 区域差距、就业选择与人力资本流动: 基于高校毕业生的实证研究. 人口与发展, 2016,22(1):28-37.
[
|
| [24] |
|
| [25] |
马莉萍, 岳昌君, 闵维方. 高等院校布局与大学生区域流动. 教育发展研究, 2009,29(23):31-36.
[
|
| [26] |
岳昌君, 邱文琪. 高校毕业生城际流动的特征分析. 北京大学教育评论, 2019,17(3):88-104+189-190.
[
|
| [27] |
岳昌君, 李欣. 高校毕业生跨省流动的特征分析. 教育与经济, 2016, (4):11-20.
[
|
| [28] |
周亮, 张亚. 中国顶尖学术型人才空间分布特征及其流动趋势: 以中国科学院院士为例. 地理研究, 2019,38(7):1749-1763.
[
|
| [29] |
猎聘大数据研究院. 2018二季度大数据报告: 人才大战中的人才红利热点及流向. (2018-08-08)[2020-05-20]. http://www.sohu.com/a/245900149_189918.
[ Liepin big data research institute. Big data report for the second quarter of 2018: Hotspots and trends of talent dividends in the talent war.]
|
| [30] |
周川. 一流大学的一流德行. 高等教育研究, 2020,41(8):4-12.
[
|
| [31] |
第一财经. 2017中国城市商业魅力排行榜. (2017-05-25)[2020-05-20]. https://yicai.smgbb.cn/live/5290679.html.
[ China business network. Ranking of cities’ business attractiveness in 2017.]
|
| [32] |
吕拉昌, 廖倩, 黄茹. 基于期刊论文的中国地级以上城市知识专业化研究. 地理科学, 2018,38(8):1245-1255.
[
|
| [33] |
袁振杰, 郭隽万果, 杨韵莹, 等. 中国优质基础教育资源空间格局形成机制及综合效应. 地理学报, 2020,75(2):318-331.
[
|
| [34] |
张凡, 宁越敏, 娄曦阳. 中国城市群的竞争力及对区域差异的影响. 地理研究, 2019,38(7):1664-1677.
[
|
| [35] |
|
| [36] |
戚伟, 刘盛和, 金凤君. 东北三省人口流失的测算及演化格局研究. 地理科学, 2017,37(12):1795-1804.
[
|
| [37] |
刘旭阳, 金牛. 城市“抢人大战”政策再定位: 聚焦青年流动人才的分析. 中国青年研究, 2019, (9):47-53.
[
|
| [38] |
郭鑫鑫, 杨河清. 中国省际人才分布影响因素的实证研究. 人口与经济, 2018, (3):47-55.
[
|
| [39] |
李辉, 王良健. 房价、房价收入比与流动人口长期居留意愿: 来自流动人口的微观证据. 经济地理, 2019,39(6):86-96.
[
|
| [40] |
王若宇, 薛德升, 刘晔, 等. 基于空间杜宾模型的中国高学历人才时空分异研究. 世界地理研究, 2019,28(4):134-143.
[
|
/
| 〈 |
|
〉 |
