
长江、黄河流域生态系统服务变化及权衡协同关系研究
|
方露露(1996-),女,安徽六安人,硕士,研究方向为生态系统服务。E-mail: 1512734211@qq.com |
收稿日期: 2020-01-20
录用日期: 2020-03-02
网络出版日期: 2021-05-10
基金资助
国家自然科学基金青年项目(41801021)
版权
The study of ecosystem services and the comparison of trade-off and synergy in Yangtze River Basin and Yellow River Basin
Received date: 2020-01-20
Accepted date: 2020-03-02
Online published: 2021-05-10
Copyright
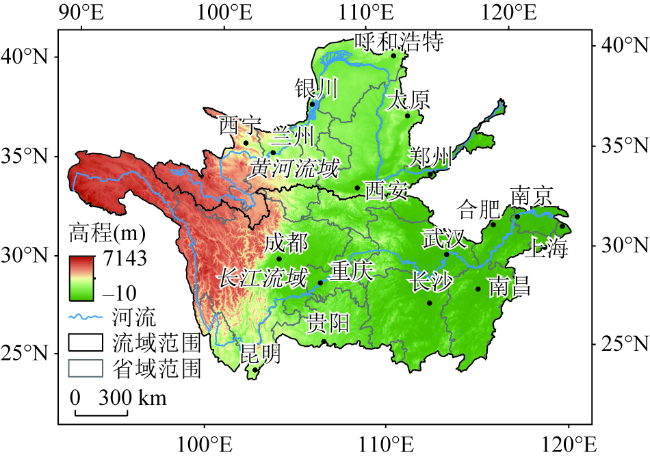
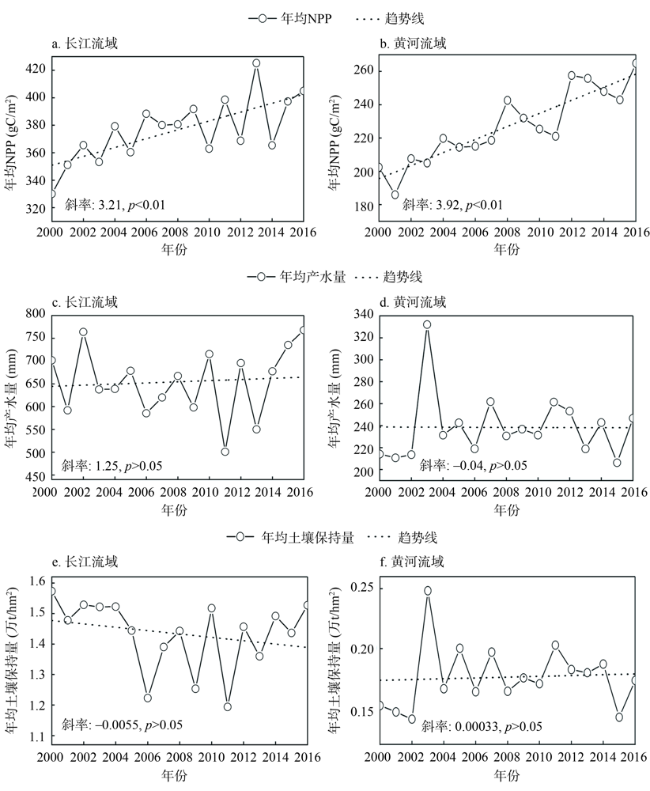
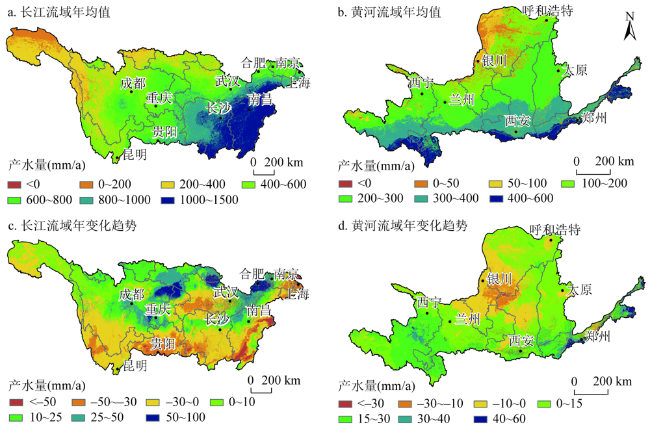
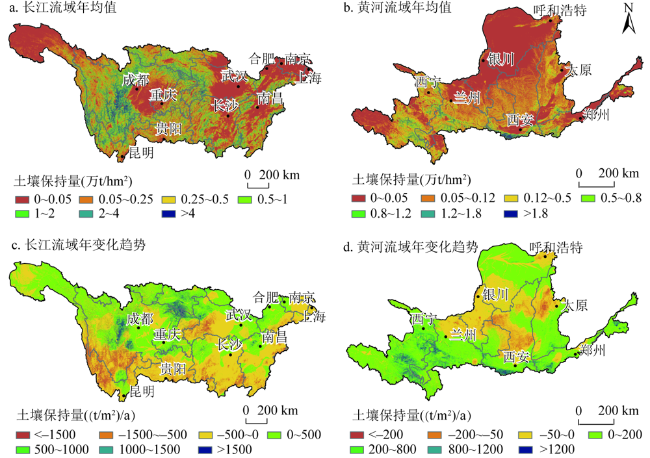
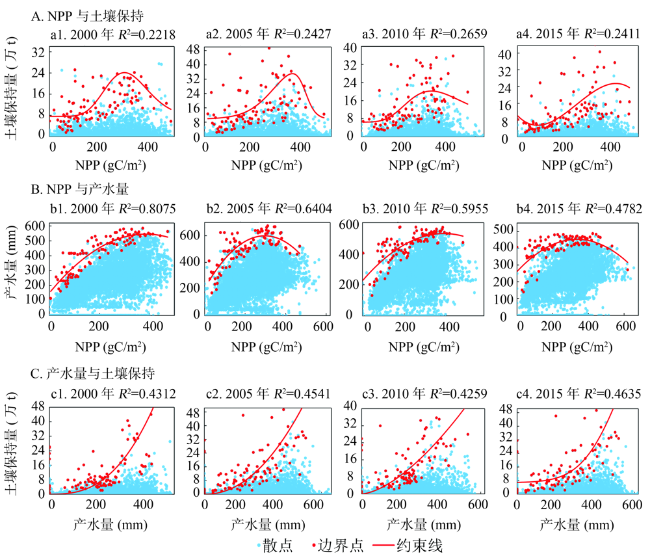
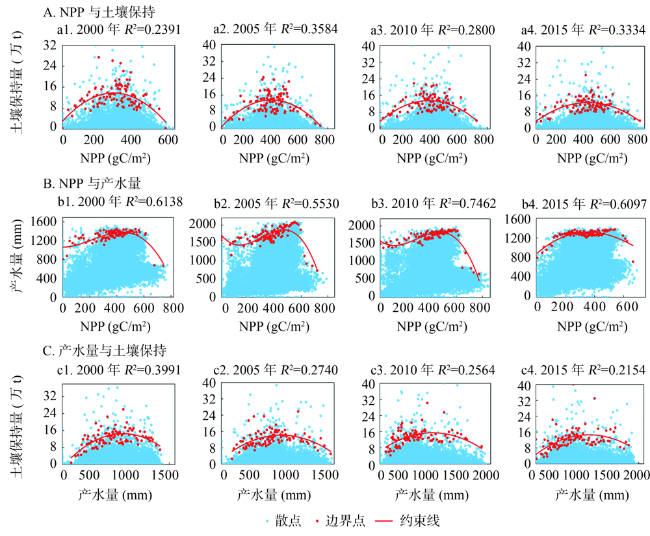
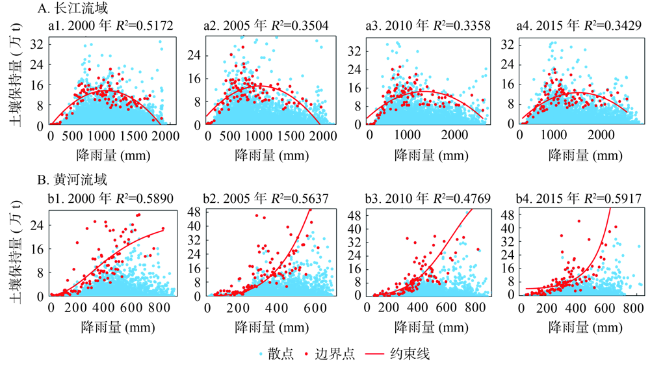
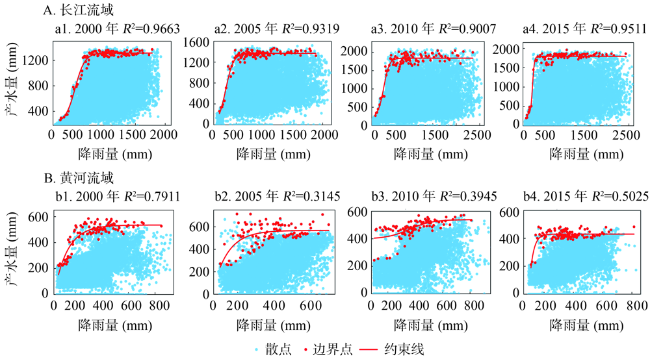
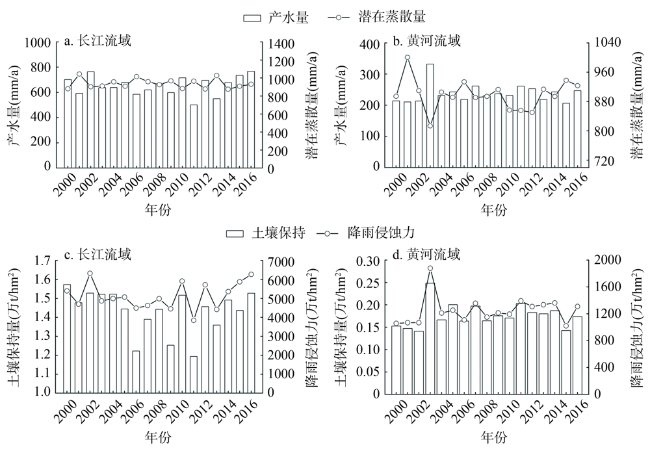
长江、黄河流域是中国重要的生态屏障,近几十年来强烈的人类活动改变了长江、黄河流域的自然景观,使生态系统功能遭到破坏,了解流域内生态系统服务的变化、相互作用和驱动因素是流域生态系统管理和调控的重要基础。本文利用土地利用、土壤类型和气象等数据,对2000—2016年长江、黄河流域的NPP、土壤保持和产水服务进行时空变化分析;采用相关分析法和约束线研究生态系统服务之间的权衡协同关系和约束效应。结果表明:① 2000—2016年,长江、黄河流域的NPP分别以3.21 gC/m2和3.92 gC/m2的速率递增,产水量和土壤保持量在长江流域分别以1.25 mm/a的速率递增和55 t/hm2的速率递减,而在黄河流域,产水量和土壤保持量分别以0.04 mm/a的速率递减和3.31 t/hm2的速率递增。② 长江、黄河流域的NPP、土壤保持和产水服务之间互为协同关系。长江流域的NPP和产水服务与土壤保持服务之间为驼峰型约束,NPP与产水量之间为凸波型约束。③ 黄河流域的NPP与土壤保持间的约束线形态为凸波型,NPP与产水量之间为驼峰型约束,而产水量与土壤保持之间为指数型。定量化研究不同流域的生态系统服务并探究其影响因素,对于了解和优化不同地区的生态系统服务有重要意义。
方露露 , 许德华 , 王伦澈 , 牛自耕 , 张明 . 长江、黄河流域生态系统服务变化及权衡协同关系研究[J]. 地理研究, 2021 , 40(3) : 821 -838 . DOI: 10.11821/dlyj020200044
The Yangtze River Basin and Yellow River Basin are important ecological barriers in China, which is of great significance to regional sustainable development. In recent decades, the human activities have changed the natural landscape of the two great river basins, which causes the destruction of ecosystem functions. Understanding the changes, interactions, and drivers of ecosystem services are critical for the improvement of ecosystem management in the above basins. Using the data of land use, NDVI, soil type and meteorology, this paper analyzed the spatial and temporal changes of vegetation net primary productivity (NPP), water yield (WY) and soil retention (SR) in the Yangtze and Yellow river basins from 2000 to 2016. The correlation analysis method was used to explore the trade-off and synergy between ecosystem services, and the constraint lines were extracted to compare the constraint effects between WY and SR in the above two basins. The results showed that: (1) From 2000 to 2016, the NPP in the two river basins increased at a rate of 3.21 gC/m2 and 3.92 gC/m2, respectively. In the Yangtze River Basin, WY increased at a rate of 1.25 mm/a and SR decreased at a rate of 55 t/hm2, while in the Yellow River Basin, WY decreased at a rate of 0.04 mm/a and SR increased at a rate of 3.31 t/hm2. (2) There was a synergistic relationship between NPP, WY and SR in the two basins. And the constraint line between NPP-WY and NPP-SR was hump-shaped constraint in the Yangtze River Basin. (3) In the Yellow River Basin, there was a convex-waved type constraint line between NPP and SR, and hump-shaped constraint line between NPP and WY, while there was an exponential relationship between WY and SR. Precipitation is the main factor influencing the constraint lines between ecosystem services. Still, quantitative research on ecosystem services in different watersheds and the influencing factors is of great significance for understanding and optimizing ecosystem services in different regions.
表1 不同土地利用类型P值和C值Tab. 1 P value and C value of different land use types |
| 土地利用类型 | 耕地 | 林地 | 草地 | 水域 | 建设用地 | 未利用地 | |
|---|---|---|---|---|---|---|---|
| 长江流域 | P | 0.40 | 1 | 1 | 0 | 0 | 1 |
| C | 0.19 | 0.02 | 0.31 | 0 | 0 | 1 | |
| 黄河流域 | P | 0.30 | 1 | 1 | 0 | 0 | 1 |
| C | 0.23 | 0.08 | 0.24 | 0 | 0 | 1 | |
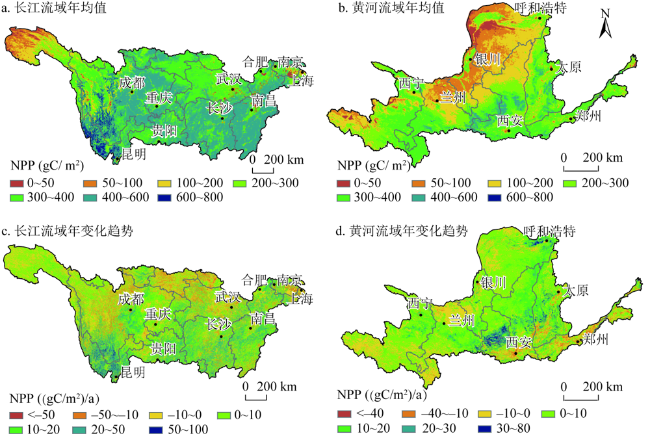
图2 2000—2016年长江、黄河流域NPP空间分布Fig. 2 Spatial distribution of NPP in the Yangtze River Basin and Yellow River Basin from 2000 to 2016 |
表2 生态系统服务间的相关系数Tab. 2 Correlation coefficients between ecosystem services |
| 长江流域 | 黄河流域 | ||||||
|---|---|---|---|---|---|---|---|
| 产水与土壤保持 | NPP与土壤保持 | NPP与产水 | 产水与土壤保持 | NPP与土壤保持 | NPP与产水 | ||
| 2000年 | 0.135** | 0.097** | 0.223** | 0.314** | 0.227** | 0.693** | |
| 2005年 | 0.099** | 0.108** | 0.379** | 0.377** | 0.247** | 0.666** | |
| 2010年 | 0.107** | 0.133** | 0.439** | 0.289** | 0.195** | 0.646** | |
| 2015年 | 0.151** | 0.142** | 0.280** | 0.256** | 0.209** | 0.651** | |
注:**表示在0.01水平上显著相关。 |
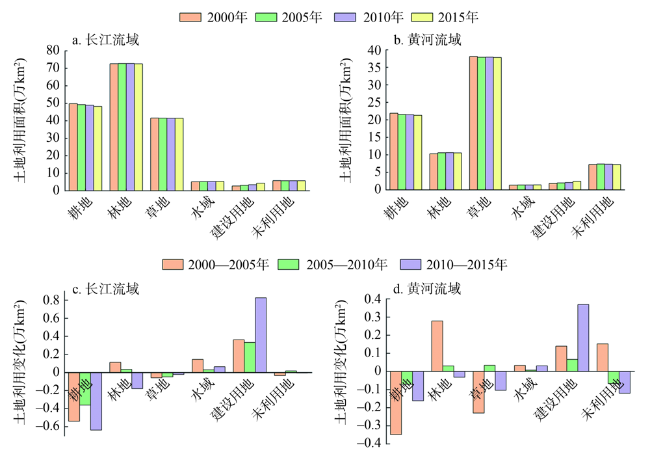
图11 长江、黄河流域的土地利用变化Fig. 11 Land use change in the Yangtze River Basin and Yellow River Basin |
表3 长江流域不同土地利用类型的生态系统服务均值Tab. 3 Mean value of ecosystem services for different land use types in the Yangtze River Basin |
| 产水量均值(mm/a) | 土壤保持均值(t/hm2) | ||||||||
|---|---|---|---|---|---|---|---|---|---|
| 2000年 | 2005年 | 2010年 | 2015年 | 2000年 | 2005年 | 2010年 | 2015年 | ||
| 耕地 | 8250.32 | 8256.33 | 8531.26 | 8330.81 | 803.90 | 807.73 | 848.73 | 904.34 | |
| 林地 | 23698.00 | 20893.34 | 22549.54 | 21504.06 | 797.38 | 753.83 | 823.07 | 848.57 | |
| 草地 | 14678.56 | 14665.30 | 14516.57 | 13311.51 | 509.97 | 499.47 | 456.13 | 443.20 | |
表4 黄河流域不同土地利用类型的生态系统服务均值Tab. 4 Mean value of ecosystem services for different land use types in the Yellow River Basin |
| 产水量均值(mm/a) | 土壤保持均值(t/hm2) | ||||||||
|---|---|---|---|---|---|---|---|---|---|
| 2000年 | 2005年 | 2010年 | 2015年 | 2000年 | 2005年 | 2010年 | 2015年 | ||
| 耕地 | 981.56 | 1171.88 | 1068.04 | 920.95 | 264.17 | 284.45 | 282.36 | 260.93 | |
| 林地 | 4259.06 | 5244.81 | 4603.91 | 3837.84 | 268.00 | 295.03 | 286.31 | 295.04 | |
| 草地 | 1428.71 | 2021.40 | 1643.04 | 1364.50 | 217.44 | 254.76 | 241.46 | 215.99 | |
真诚感谢二位匿名评审专家在论文评审中所付出的时间和精力,评审专家对本文土壤保持服务中的方法选择、NPP计算指标选取方面的修改意见,使本文获益匪浅。
| [1] |
|
| [2] |
Millennium Ecosystem Assessment. Ecosystems and Human Well-being: A Framework for Assessment. Washington, DC: Island Press, 2005.
|
| [3] |
|
| [4] |
|
| [5] |
|
| [6] |
|
| [7] |
赵军, 高超, 胡秀芳, 等. 基于文献分析方法的生态系统服务研究热点、前沿与发展趋势. 中国农学通报, 2018,34(34):132-137.
[
|
| [8] |
|
| [9] |
傅伯杰, 田汉勤, 桃福禄, 等. 全球变化对生态系统服务的影响. 中国基础科学, 2017,19(6):14-18.
[
|
| [10] |
|
| [11] |
|
| [12] |
|
| [13] |
|
| [14] |
武文欢, 彭建, 刘焱序, 等. 鄂尔多斯市生态系统服务权衡与协同分析. 地理科学进展, 2017,36(12):1571-1581.
[
|
| [15] |
李晶, 李红艳, 张良. 关中-天水经济区生态系统服务权衡与协同关系. 生态学报, 2016,36(10):3053-3062.
[
|
| [16] |
|
| [17] |
|
| [18] |
李双成, 张才玉, 刘金龙, 等. 生态系统服务权衡与协同研究进展及地理学研究议题. 地理研究, 2013,32(8):1379-1390.
[
|
| [19] |
|
| [20] |
|
| [21] |
郝蕊芳, 于德永, 邬建国, 等. 约束线方法在生态学研究中的应用. 植物生态学报, 2016,40(10):1100-1109.
[
|
| [22] |
|
| [23] |
|
| [24] |
|
| [25] |
官冬杰, 周李磊, 李秋彦, 等. 重庆市湿地生态系统服务约束关系. 中国环境科学, 2019, (4):1753-1764.
[
|
| [26] |
徐新良, 刘纪远, 庄大方. 国家尺度土地利用/覆被变化遥感监测方法. 安徽农业科学, 2012, (4):2365-2369.
[
|
| [27] |
|
| [28] |
|
| [29] |
|
| [30] |
朱文泉, 潘耀忠, 何浩, 等. 中国典型植被最大光利用率模拟. 科学通报, 2006,51(6):700-706.
[
|
| [31] |
朱文泉, 潘耀忠, 张锦水. 中国陆地植被净初级生产力遥感估算. 植物生态学报, 2007,31(3):413-424.
[
|
| [32] |
|
| [33] |
|
| [34] |
|
| [35] |
|
| [36] |
章文波, 付金生. 不同类型雨量资料估算降雨侵蚀力. 资源科学, 2003, (1):35-41.
[
|
| [37] |
殷水清, 薛筱婵, 岳天雨, 等. 中国降雨侵蚀力的时空分布及重现期研究. 农业工程学报, 2019,35(9):105-113.
[
|
| [38] |
|
| [39] |
|
| [40] |
马超飞, 马建文, 哈斯巴干, 等. 基于RS和GIS的岷江流域退耕还林还草的初步研究. 水土保持学报, 2001,6(4):20-24.
[
|
| [41] |
齐清, 王天明, 寇晓军, 等. 基于GIS的黄土高原小流域土壤侵蚀定量评价. 水土保持研究, 2009,16(3):1-5.
[
|
| [42] |
于兴修, 杨桂山. 通用水土流失方程因子定量研究进展与展望. 自然灾害学报, 2003, (3):14-18.
[
|
| [43] |
蔡崇法, 丁树文, 史志华, 等. 应用USLE模型与地理信息系统IDRISI预测小流域土壤侵蚀量的研究. 水土保持学报, 2000, (2):19-24.
[
|
| [44] |
|
| [45] |
马建军, 姚虹, 张树礼. 黄土高原丘陵沟壑区露天煤矿复垦地生态修复的水土保持效应研究. 廊坊师范学院学报(自然科学版), 2009,9(1):68-71.
[
|
| [46] |
刘乙淼, 陈艳梅, 胡引翠. 长江流域土壤保持能力时空特征. 长江流域资源与环境, 2015,24(6):971-977.
[
|
| [47] |
|
| [48] |
李登科, 王钊. 基于MOD17A3的中国陆地植被NPP变化特征分析. 生态环境学报, 2018,27(3):397-405.
[
|
| [49] |
|
| [50] |
|
| [51] |
|
| [52] |
|
| [53] |
|
| [54] |
|
| [55] |
|
| [56] |
|
| [57] |
|
| [58] |
|
| [59] |
|
| [60] |
|
| [61] |
|
| [62] |
|
| [63] |
|
| [64] |
刘纪远, 宁佳, 匡文慧, 等. 2010-2015年中国土地利用变化的时空格局与新特征. 地理学报, 2018,73(5):789-802.
[
|
| [65] |
|
| [66] |
|
| [67] |
孙艺杰, 任志远, 赵胜男, 等. 陕西河谷盆地生态系统服务协同与权衡时空差异分析. 地理学报, 2017,72(3):521-532.
[
|
| [68] |
孙艺杰, 任志远, 郝梦雅, 等. 黄土高原生态系统服务权衡与协同时空变化及影响因素分析: 以延安市为例. 生态学报, 2019,39(10):3443-3454.
[
|
| [69] |
|
/
| 〈 |
|
〉 |