
中国外卖O2O电子商务的空间扩散与渗透——兼论技术扩散假说与效率假说的适用性
|
施响(1993-),女,辽宁沈阳人,博士研究生,主要研究方向为大数据与国土空间优化研究。E-mail:2371207309@qq.com |
收稿日期: 2020-08-17
录用日期: 2021-03-02
网络出版日期: 2021-07-10
基金资助
国家自然科学基金项目(41630749)
国家自然科学基金青年项目(41801153)
中央高校基本科研业务费项目(2412020FZ001)
版权
Spatial diffusion and penetration about the takeaway O2O e-commerce in China: Feasibility of innovation diffusion hypothesis and efficiency hypothesis
Received date: 2020-08-17
Accepted date: 2021-03-02
Online published: 2021-07-10
Copyright
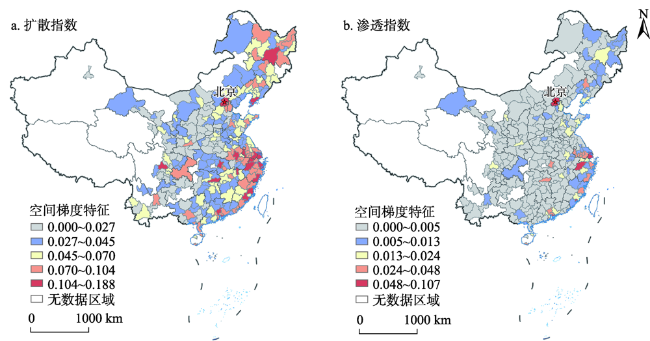
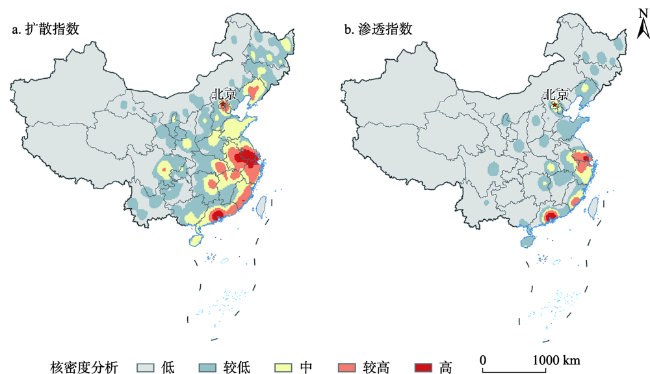
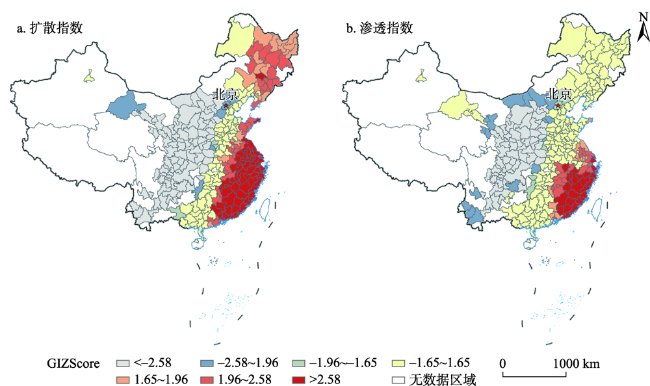
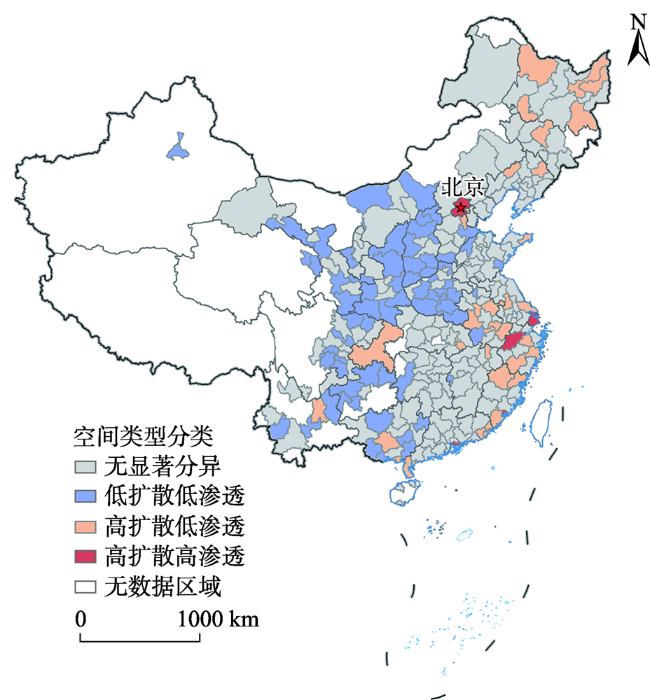
基于“饿了么”网站获取中国287个地级市的外卖O2O(online to offline)数据,通过构建外卖O2O扩散指数和渗透指数来表征中国地级市外卖O2O电子商务发展水平和发育程度,从宏观尺度探究外卖O2O电子商务的空间发展逻辑,并对技术扩散假说和效率假说的适用性进行验证。结果表明:① 整体上中国外卖O2O电子商务扩散与渗透过程表现出东部→中部→西部区域梯度递减规律,大部分地区扩散指数处于中等水平,少数城市的扩散指数处于低等或高等水平,空间分布相对均衡;渗透指数空间单极化现象明显,大部分地区渗透指数处于中低等水平,仅有少数城市处于高等水平。② 外卖O2O扩散和渗透过程区域分异特征明显,扩散指数热点区范围较广,主要分布于东、中部地区,表现为从平原热点区到高原冷点区逐渐过渡的空间格局;渗透指数热点区范围较小,主要分布于东南沿海城市,未在全国尺度形成大范围集聚。③ 外卖O2O高扩散-高渗透区主要集中于上海、北京、深圳等经济发达城市,低扩散-低渗透区覆盖范围相对较广,主要分布在西北和西南地区,高扩散-低渗透区较为分散,其外卖O2O电子商务在实体商业的普及度和覆盖率虽然较高,但外卖O2O业态发育尚不成熟,未来市场潜力巨大。④ 中国外卖O2O电子商务空间扩散与渗透过程更契合技术扩散假说,高收入、高学历以及年轻化成为推动电子商务空间扩散和渗透的重要因素,而实体商业的低可达性在一定程度上并未促进电子商务发展。
施响 , 王士君 , 浩飞龙 , 王冬艳 . 中国外卖O2O电子商务的空间扩散与渗透——兼论技术扩散假说与效率假说的适用性[J]. 地理研究, 2021 , 40(5) : 1338 -1353 . DOI: 10.11821/dlyj020200801
On the basis of " Eleme" website to obtain the takeaway O2O (online to offline) data of 287 prefecture-level cities in China, we construct the takeaway O2O diffusion index and penetration index to characterize the development level and development degree of the O2O e-commerce for takeaway in prefecture-level cities of China, explore the spatial development logic of takeaway O2O e-commerce from macro scale, and verify the applicability of technology diffusion hypothesis and efficiency hypothesis. The results indicate that: (1) On the whole, the diffusion and penetration process of Chinese takeaway O2O e-commerce shows a regional gradient decline from the eastern to central and western regions, the diffusion index of most regions is at the middle level, and the diffusion index of a few cities is at the low or high level. The spatial distribution is relatively balanced. (2) The regional differentiation of takeaway O2O diffusion and infiltration process is obvious, and hot spot areas of the diffusion index are widely distributed, mainly in the eastern and central regions, which shows the spatial pattern of gradual transition from plain hot spot area to plateau cold spot area; the penetration index hotspots are relatively small, mainly distributed in the southeast coastal cities, and high-value areas have not yet formed a large-scale cluster on a national scale. (3) The high diffusion-high permeability areas of takeaway O2O are mainly concentrated in Shanghai, Beijing, Shenzhen and other economically developed cities, while the low diffusion-low permeability areas cover a relatively wide range, mainly in the northwest and southwest regions, and high diffusion-low permeability areas are more dispersed. The popularity and coverage of takeaway O2O e-commerce in physical commerce is high, but the development of takeaway O2O is not mature, and the market potential is huge. (4) Chinese takeaway O2O e-commerce space diffusion and penetration process is more in line with the technology diffusion hypothesis, high income, high education and youth become an important factor that promotes the spread and penetration of e-commerce space, and the low accessibility of physical commerce generates less effect on the development of e-commerce to some extent.
表1 外卖O2O扩散指数标准化后的最大期望值Tab. 1 The maximum expected value of takeaway O2O diffusion index after standardization |
| 最大期望 | 标准值取值 | |
|---|---|---|
| 密度指数 | 中国80%的餐饮商家通过饿了么网站进行销售 | 1.02%×80%=0.82% (据大众点评网爬取到的实体商家数据,中国共有1421.2392万个餐饮实体店,换算到总人口中,每百人平均1.02家餐饮商家) |
| 规模指数 | 100% | 100% |
注:密度指数指外卖商家占区域常住人口比重;规模指数指规模以上外卖商家占比。 |
表2 中国城市化水平测度指标Tab. 2 The index measurement of urbanization level in China |
| 一级指标 | 二级指标 | 指标编号 | 权重 |
|---|---|---|---|
| 人口城市化 | 非农业人口占比(%) | PU1 | 0.0107 |
| 第二产业从业人员占比(%) | PU2 | 0.2640 | |
| 第三产业从业人员占比(%) | PU3 | 0.3826 | |
| 土地城市化 | 每万人建成区面积(km2) | LU1 | 0.0025 |
| 建成区占市区面积比例(%) | LU2 | 0.0033 | |
| 经济城市化 | 人均地区生产总值(元/人) | EU1 | 0.0111 |
| 第二产业占地区生产总值比重(%) | EU2 | 0.2467 | |
| 第三产业占地区生产总值比重(%) | EU3 | 0.0689 | |
| 社会城市化 | 人均社会零售额(元) | SU1 | 0.0021 |
| 每百人公共图书馆藏书量(册) | SU2 | 0.0009 | |
| 万人医院床位数(个) | SU3 | 0.0072 |
注:不含西藏自治区、新疆维吾尔自治区的克拉玛依市、吐鲁番市、哈密市、港澳台数据。 |
表3 技术扩散与效率假说的指标体系[29,30]Tab. 3 Support index system of innovation diffusion hypothesis and efficiency hypothesis |
| 假说名称 | 指标(单位) | 指标编号 | 对应的前提条件 |
|---|---|---|---|
| 技术扩散假说(I) | 平均受教育年限(年) | I1 | 高学历 |
| 中高等学校在校学生密度 | I2 | ||
| 城镇居民可支配收入(元) | I3 | 高收入 | |
| 20~40岁人口占常住人口比例(%) | I4 | 年轻化 | |
| 人均移动电话年末用户数(户) | I5 | 能够熟练使用互联网工具 | |
| 人均互联网宽带接入用户数(户) | I6 | ||
| 效率假说(E) | 实体餐饮商家密度 | E1 | 实体餐饮市场不发达 |
| 人均公共汽(电)车客运量(人次) | E2 | 商业可达性较差 | |
| 年末每万人实有出租汽车数(辆) | E3 | ||
| 每万人拥有公共汽车(辆) | E4 | ||
| 城市道路面积(m2) | E5 |
表4 O2O扩散指数的拉格朗日乘子检验结果Tab. 4 Lagrange multiplier test results of diffusion index |
| 外卖O2O扩散指数 | Coef. | Std. Err. | P>t |
|---|---|---|---|
| I2 | 26.673470 | 14.422650 | 0.047 |
| I3 | 0.000190 | 0.000023 | 0 |
| I6 | 7.834252 | 2.512842 | 0.003 |
| E1 | 0.029396 | 0.011723 | 0.003 |
| E4 | 0.893404 | 0.482268 | 0 |
| cons | -2.820928 | 1.207886 | 0.018 |
| R2 | 0.468600 | ||
| Log Likelihood | -175.580000 | ||
| AIC | 338.760000 | ||
| SC | 348.930000 | ||
| LM-LAG | 10.566000 | 0.000 | |
| ROBUST LM-LAG | 9.832000 | 0.000 | |
| LM-Error | 8.244000 | 0.014 | |
| ROBUST LM-Error | 0.049000 | 0.743 |
表5 O2O扩散指数的空间滞后模型估计结果Tab. 5 Estimation results of spatial lag model for diffusion index |
| 外卖O2O扩散指数 | 空间滞后模型 | ||
|---|---|---|---|
| Coef. | Std. Err. | P>t | |
| I2 | 22.643480 | 16.467260 | 0.016 |
| I3 | 0.000120 | 0.000048 | 0 |
| I6 | 7.836347 | 2.597937 | 0.001 |
| E1 | 0.768366 | 0.488268 | 0 |
| E4 | 0.056935 | 0.063323 | 0.002 |
| cons | -1.632454 | 1.205785 | 0.018 |
| W×O2O扩散指数 | 0.562872 | 0.286674 | 0 |
| λ | |||
| R2 | 0.592200 | ||
| Log Likelihood | -172.450000 | ||
| AIC | 328.690000 | ||
| SC | 339.530000 | ||
注:不含西藏自治区、新疆维吾尔自治区的克拉玛依市、吐鲁番市、哈密市、港澳台数据。 |
表6 O2O渗透指数的拉格朗日乘子检验结果Tab. 6 Lagrange multiplier test results of permeability index |
| 外卖O2O渗透指数 | Coef. | Std. Err. | P>t |
|---|---|---|---|
| E2 | 0.099348 | 0.025388 | 0 |
| E4 | 0.025669 | 0.005888 | 0 |
| I3 | 0.000035 | 450.00E-08 | 0 |
| I4 | 3.750550 | 1.032139 | 0 |
| I6 | -0.003472 | 0.001206 | 0.004 |
| _cons | -1.988753 | 0.324061 | 0 |
| R2 | 0.552500 | ||
| Log Likelihood | -185.520000 | ||
| AIC | 343.630000 | ||
| SC | 354.820000 | ||
| LM-LAG | 10.633000 | 0.000 | |
| ROBUST LM-LAG | 9.663000 | 0.000 | |
| LM-Error | 7.772000 | 0.026 | |
| ROBUST LM-Error | 0.043000 | 0.855 |
表7 O2O渗透指数的空间滞后模型估计结果Tab. 7 Estimation results of spatial lag model for permeability index |
| 外卖O2O渗透指数 | 空间滞后模型 | ||
|---|---|---|---|
| Coef. | Std. Err. | P>t | |
| I3 | 0.000024 | 0.000032 | 0 |
| I4 | 3.346478 | 1.032139 | 0 |
| I6 | -0.002252 | 0.001533 | 0.005 |
| E2 | 0.077475 | 0.028844 | 0 |
| E4 | 0.023777 | 0.005632 | 0 |
| _cons | -1.226474 | 0.236464 | 0 |
| W×O2O渗透指数 | 0.501254 | 0.135364 | 0 |
| λ | |||
| R2 | 0.652300 | ||
| Log Likelihood | -181.630000 | ||
| AIC | 340.520000 | ||
| SC | 348.820000 | ||
注:不含西藏自治区、新疆维吾尔自治区的克拉玛依市、吐鲁番市、哈密市、港澳台数据。 |
真诚感谢二位匿名评审专家在论文评审中所付出的时间和精力,评审专家对本文研究思路、研究方法选择、评价指标选取、结果分析及结论梳理方面的修改意见,使本文获益匪浅。
| [1] |
艾瑞咨询. 2015年中国外卖O2O行业发展报告. http://report.iresearch.cn/report/201504/2370.shtml, 2019-12-16.
[ Iresearch, Development report of China's takeaway O2O industry in 2015. http://report.iresearch.cn/report/201504/2370.shtml, 2019-12-16. ]
|
| [2] |
中国互联网经济研究院. 电子商务发展二十年. http://www.199it.com/archives/892447.html, 2019-06-17.
[ China Internet Economic Research Institute. Twenty years of e-commerce development in China. http://www.199it.com/archives/892447.html, 2019-06-17. ]
|
| [3] |
刘卫东, 甄峰. 信息化对社会经济空间组织的影响研究. 地理学报, 2004,(S1):67-76.
[
|
| [4] |
甄峰, 翟青, 陈刚, 等. 信息时代移动社会理论构建与城市地理空间. 地理研究, 2012,31(2):197-206.
[
|
| [5] |
|
| [6] |
|
| [7] |
|
| [8] |
|
| [9] |
|
| [10] |
|
| [11] |
|
| [12] |
史坤博, 杨永春, 杨欣傲, 等. 时间成本是否成为电子商务区位的核心因子: 基于成都市O2O电子商务的实证分析. 地理学报, 2016,71(3):500-514.
[
|
| [13] |
|
| [14] |
|
| [15] |
|
| [16] |
|
| [17] |
|
| [18] |
|
| [19] |
|
| [20] |
汪明峰, 卢姗, 袁贺. 网上购物对不同区位消费者行为的影响: 市区和郊区的比较. 城市规划, 2013,37(11):84-88.
[
|
| [21] |
席广亮, 甄峰, 汪侠, 等. 南京市居民网络消费的影响因素及空间特征. 地理研究, 2014,33(2):284-295.
[
|
| [22] |
|
| [23] |
|
| [24] |
王喆学, 魏佳丽, 李浩, 等. 基于服务供需平衡理论的龙子湖高校餐饮服务优化. 中国商论, 2019,21(1):199-200.
[
|
| [25] |
|
| [26] |
|
| [27] |
浩飞龙, 关皓明, 王士君. 中国城市电子商务发展水平空间分布特征及影响因素. 经济地理, 2016,36(2):1-10.
[
|
| [28] |
席广亮, 甄峰, 张敏, 等. 网络消费时空演变及区域联系特征研究: 以京东商城为例. 地理科学, 2015,35(11):1372-1380.
[
|
| [29] |
史坤博, 杨永春, 邵蕊, 等. 中国城市居民C2C网络消费的空间特征分析: 兼论技术扩散与效率假说的适用性. 地理科学, 2019,39(1):107-115.
[
|
| [30] |
史坤博, 杨永春, 白硕, 等. 技术扩散还是效率优先: 基于“美团网”的中国O2O电子商务空间渗透探讨. 地理研究, 2018,37(4):783-796.
[
|
| [31] |
Trustdata. 2018年Q1中国外卖O2O行业发展分析报告. http://www.itrustdata.cn/, 2019-11-30.
[ Trustdata. China take out O2O industry development analysis report in Q1 of 2018. http://www.itrustdata.cn/, 2019-11-30. ]
|
| [32] |
阿里数据. 电子商务发展: 来自中国的经验 https://dt.alibaba.com/, 2020-01-12.
[ AliDT. E-Commerce Development: Experience from China. https://dt.alibaba.com/, 2020-01-12. ]
|
| [33] |
金融知识百科. 渗透率指的是什么?. https://zhuanlan.zhihu.com/p/21833170?utm_source=wechat_session&utm_medium=social&utm_oi=750845225655631872, 2020-01-24.
[ Encyclopedia of financial knowledge. What is permeability?. https://zhuanlan.zhihu.com/p/21833170?utm_source=wechat_session&utm_medium=social&utm_oi=750845225655631872, 2020-01-24. ]
|
| [34] |
杨海军, 邵全琴. GIS空间分析技术在地理数据处理中的应用研究. 地球信息科学学报, 2007,9(5):70-75.
[
|
| [35] |
姜磊. 空间回归模型的反思. 统计与信息论坛, 2016,31(10):10-16.
[
|
| [36] |
程叶青, 王哲野, 张守志, 等. 中国能源消费碳排放强度及其影响因素的空间计量. 地理学报, 2013,68(10):1418-1431.
[
|
| [37] |
许学强, 周一星, 宁越敏. 城市地理学. 北京: 高等教育出版社, 2009: 76-80.
[
|
| [38] |
张庭伟. 全球化2.0时期的城市发展战略:2008年后西方城市的转型及对中国城市的影响. 城市规划学刊, 2012,(4):5-11.
[
|
| [39] |
陈明星, 陆大道, 张华. 中国城市化水平的综合测度及其动力因子分析. 地理学报, 2009,64(4):387-398.
[
|
| [40] |
方创琳, 王德利. 中国城市化发展质量的综合测度与提升路径. 地理研究, 2011,30(11):1931-1946.
[
|
| [41] |
邓清华, 薛德升, 龚建周. 广州市居民网络购物频率的影响因素及其空间差异. 地理科学, 2020,40(6):928-938.
[
|
| [42] |
|
| [43] |
施响, 王士君, 浩飞龙, 等. 基于实体店比较的长春市外卖O2O餐饮业空间特征及成因. 人文地理, 2019,34(2):80-89.
[
|
| [44] |
|
/
| 〈 |
|
〉 |