
基于城市产业结构特征的高铁生产性服务业集散效应——以长三角城市群为例
|
唐昭沛(1996-),女,河南安阳人,硕士研究生,主要研究方向为区域发展与运输地理。E-mail: tangzhaopei18@mails.ucas.ac.cn |
收稿日期: 2020-11-04
录用日期: 2021-04-12
网络出版日期: 2021-10-10
基金资助
国家自然科学基金项目(41871122)
中国科学院战略性先导科技专项(A类)子课题(XDA20010101)
版权
The dispersion and aggregation effects of urban industrial structure of high-speed rail on producer services: A case study of Yangtze River Delta
Received date: 2020-11-04
Accepted date: 2021-04-12
Online published: 2021-10-10
Copyright
高铁对生产性服务业的空间集散效应深受城市特征的影响。根据城市产业发展特征将城市分为二产主导型城市和三产主导型城市,借助双重差分模型探讨高铁对不同产业结构的城市生产性服务业及其细分行业的空间效应差异。结果表明,高铁对生产性服务业及细分行业的集散效应具有显著时滞性和异质性,城市产业结构对其效应产生了显著影响。① 基于生产性服务业整体的研究表明,在静态上,高铁促进二产主导型城市产业空间分散、三产主导型城市产业空间集聚;在动态上,高铁对二产主导型城市的生产性服务业空间集散具有先促进集聚后促进分散的特性,对三产主导型城市的产业效应始终表现为促进集聚。② 对于运输服务业、租赁与商服业而言,无论是静态效应还是动态效应,城市产业结构对其影响均较小,在静态上高铁促进二产主导型城市和三产主导型城市的产业在空间分散布局;在动态上高铁效应总体表现为“不显著-促进分散”的二阶段性。③ 对于金融服务业和研发设计业而言,高铁的静态效应在作用方向上具有一致性,均表现为促进产业集聚,其动态效应受到城市产业结构的影响表现出显著阶段性差异。④ 对于信息服务业而言,高铁对其空间集散的静态效应表现为对二产主导型城市的产业影响不显著,促进三产主导型城市的信息服务业在空间集聚,且其动态效应与静态效应相一致。
唐昭沛 , 吴威 , 郭嘉颖 , 刘玮辰 , 李晓丽 . 基于城市产业结构特征的高铁生产性服务业集散效应——以长三角城市群为例[J]. 地理研究, 2021 , 40(8) : 2188 -2203 . DOI: 10.11821/dlyj020201071
The aggregation effect of high-speed rail on producer services is deeply influenced by urban characteristics. Based on the operation data of high-speed rail and relevant urban data, this paper, with the Yangtze River Delta Urban Agglomeration as the study area, discusses the aggregation effect of high-speed rail on producer services and its sub-sectors with the help of the Difference-in-Difference model. The results show that the dispersion and aggregation effects of high-speed rail on producer services and its sub-sectors are significantly lagged and heterogeneous, in which the urban industrial structure has marked effects. Some conclusions can be drawn as follows. (1) According to the industrial structure, cities are divided into industry-oriented cities and service-oriented cities. Research based on the overall producer services study shows that statically, high-speed rail promotes industrial spatial dispersion in industry-oriented cities and industrial aggregation in service-oriented cities. Dynamically, the high-speed rail effect on industry-oriented cities has the characteristic of first promoting agglomeration and then promoting dispersion. The industrial effect on service-oriented cities is always expressed as promoting agglomeration. (2) For the transport services, leasing and commercial services industry, the impact of urban industrial structure is relatively mild, both statically and dynamically. The static effect promotes the spatial dispersion of industries in industrial and service-oriented cities, while the dynamic effect generally shows the two-stage character of “insignificant-promoting dispersion”. The characteristics of these two industries have greatly contributed to the above effects. (3) For the financial services, research and design services industry, the static effects are consistent in the direction, both of which are manifested in the promotion of industrial agglomeration, while the dynamic effects affected by industrial structure show significant stage differences on both direction and duration. (4) For the information service industry, the static effect of high-speed rail is significantly affected by industrial structure, which shows no significant influence on the industry-oriented cities, and promotes agglomeration of the information service industry in service-oriented cities. The dynamic effect is relatively consistent with the static effect. The results of the robustness test performed by replacing the explanatory variables are in agreement with those in the location quotient.
表1 模型中变量的设定及说明Tab. 1 Definitions and descriptive statistics of variables |
| 变量 | 指标 | 缩写 | 单位 | 测度方法 |
|---|---|---|---|---|
| 生产性服务业集聚指数 | 区位熵 | - | ||
| 就业密度 | 人/km2 | |||
| 虚拟变量 | 政策虚拟变量 | - | 该城市区域实验组,取1;处于对照组,取0 | |
| 时间虚拟变量 | - | 高铁开通前,取0;高铁开通后,取1 | ||
| 控制变量 | 高铁发展水平 | - | ||
| 信息化水平 | % | 互联网接入户数占总户数的比例 | ||
| 市场需求 | % | 第二产业增加值增长率 | ||
| 政府干预度 | % | 财政支出占GDP的比例 | ||
| 市场对外开放程度 | 亿元 | 当年实际使用外资 | ||
| 人均收入水平 | 元 | 平均工资 | ||
| 固定资产投资 | 万元 | 人均固定资产投资 | ||
| 交通基础设施 | m2/人 | 城市人均道路面积 | ||
| 人口 | 万人 | 常住人口 |
表2 城市类型划分Tab. 2 The division of cities |
| 分类方向 | 分类方法 | 类别名称 | 包含城市 |
|---|---|---|---|
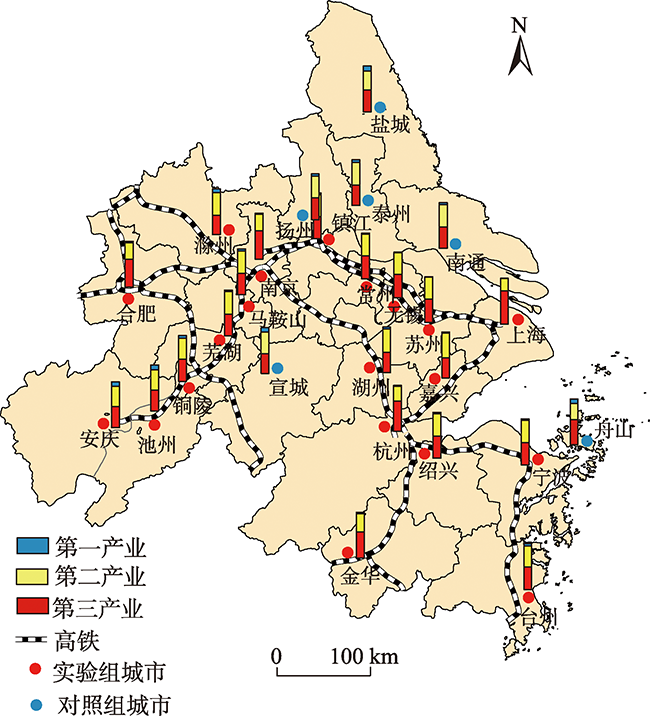
| 产业结构 | 比较法 | 二产主导型城市 | 镇江 宁波 嘉兴 绍兴 芜湖 马鞍山 铜陵 安庆 滁州 宣城 扬州 泰州 |
| 三产主导型城市 | 上海 南京 无锡 常州 苏州 杭州 湖州 金华 台州 合肥 池州 南通 盐城 舟山 |
表3 高铁对生产性服务业及细分行业的静态效应Tab. 3 The static effects of high-speed rail on producer services and its sub-sectors |
| 生产性服务业 | 运输服务业 | 信息服务业 | 金融服务业 | 租赁与商服业 | 研发设计业 | ||
|---|---|---|---|---|---|---|---|
| (1) | (2) | (3) | (4) | (5) | (6) | ||
| 二产主导型城市 | DID | -0.0010*** (-2.63) | -0.0022*** (-3.68) | -0.0010 (-1.49) | 0.0008** (2.06) | -0.0021** (-2.35) | 0.0011** (1.98) |
| Year | yes | yes | yes | yes | yes | yes | |
| City | yes | yes | yes | yes | yes | yes | |
| 192 | 192 | 192 | 192 | 192 | 192 | ||
| 0.4197 | 0.1966 | 0.2358 | 0.5317 | 0.3567 | 0.3624 | ||
| 三产主导型城市 | DID | 0.0005*** (2.66) | -0.0012*** (-3.32) | 0.0028*** (4.46) | 0.0006* (1.81) | -0.0014** (-2.15) | 0.0014*** (3.48) |
| Year | yes | yes | yes | yes | yes | yes | |
| City | yes | yes | yes | yes | yes | yes | |
| 224 | 224 | 224 | 224 | 224 | 224 | ||
| 0.3524 | 0.2225 | 0.3830 | 0.1766 | 0.1646 | 0.2189 |
注:*、**、***分别表示10%、5%、1%的显著性水平,括号内为t值,由于本文未对控制变量展开分析,因此控制变量的结果未汇报。 |
表4 高铁对生产性服务业及细分行业的动态效应Tab. 4 The dynamic effects of high-speed rail on producer services and its sub-sectors |
| 生产性服务业 | 运输服务业 | 信息服务业 | 金融服务业 | 租赁与商服业 | 研发设计业 | ||
|---|---|---|---|---|---|---|---|
| (1) | (2) | (3) | (4) | (5) | (6) | ||
| 二产主导型城市 | 0.0031 (0.06) | 0.0133 (0.16) | 0.0610 (0.66) | 0.0121 (0.22) | -0.0498 (-0.40) | -0.0113 (-0.16) | |
| -0.0107 (-0.38) | 0.0057 (0.12) | -0.0072 (-0.13) | -0.0062 (-0.19) | -0.1093 (-1.50) | 0.0109 (0.26) | ||
| 0.0549** (2.21) | 0.0528 (1.24) | 0.0377 (0.79) | 0.0628** (2.23) | -0.1383** (-2.16) | 0.0723* (1.95) | ||
| 0.0470* (1.87) | 0.0329 (0.76) | 0.0475 (0.98) | 0.0563** (1.98) | -0.0952 (-1.47) | 0.0858** (2.29) | ||
| 0.0137 (0.60) | -0.0345 (-0.88) | 0.0443 (1.01) | 0.0463* (1.79) | -0.0396 (-0.67) | 0.0848** (2.49) | ||
| -0.0380 (-1.64) | -0.1317*** (-3.31) | -0.0051 (-0.11) | 0.0213 (0.81) | -0.0603 (-1.01) | 0.0785** (2.27) | ||
| -0.0357* (-1.68) | -0.0681** (-2.06) | 0.0098 (0.27) | 0.0110 (0.50) | -0.0285 (-0.59) | 0.0156 (0.54) | ||
| -0.0466** (-2.37) | -0.0704** (-2.09) | -0.0140 (-0.37) | 0.0244 (1.10) | -0.0267 (-0.54) | 0.0003 (0.01) | ||
| -0.0457** (-2.30) | -0.0764** (-2.24) | -0.0219 (-0.57) | 0.0359 (1.60) | -0.0104 (-0.21) | 0.0020 (0.07) | ||
| Year | yes | yes | yes | yes | yes | yes | |
| City | yes | yes | yes | yes | yes | yes | |
| 192 | 192 | 192 | 192 | 192 | 192 | ||
| 0.2129 | 0.2322 | 0.2450 | 0.1853 | 0.2169 | 0.4071 | ||
| 三产主导型城市 | -0.0169 (-0.50) | 0.0041 (0.06) | -0.2192* (-1.72) | -0.0160 (-0.27) | 0.0836 (0.66) | -0.0479 (-0.57) | |
| 0.0042 (0.18) | -0.0261 (-0.53) | -0.0199 (-0.23) | -0.0118 (-0.29) | 0.0374 (0.44) | -0.0212 (-0.36) | ||
| 0.0061 (0.47) | 0.0060 (0.21) | 0.0041 (0.08) | 0.0095 (0.41) | -0.0415 (-0.84) | -0.0193 (-0.57) | ||
| 0.0251* (1.75) | 0.0099 (0.32) | -0.0166 (-0.31) | 0.0222 (0.87) | -0.0613 (-1.14) | 0.0269 (0.73) | ||
| 0.0389*** (2.83) | 0.0173 (0.58) | -0.0243 (-0.47) | 0.0359 (1.47) | -0.0024 (-0.05) | 0.0382 (1.06) | ||
| 0.0232 (0.18) | 0.0045 (0.16) | -0.0638 (-1.29) | 0.0432** (1.85) | -0.0702 (-1.42) | 0.0500 (1.46) | ||
| 0.0231* (1.79) | -0.0073 (-0.26) | 0.0152 (0.32) | 0.0673*** (2.94) | -0.1334*** (-2.77) | 0.0603* (1.81) | ||
| 0.0286** (2.15) | -0.0277 (-0.96) | 0.0859* (1.72) | 0.0770*** (3.27) | -0.1051** (-2.10) | 0.0643* (1.86) | ||
| 0.0306** (2.26) | -0.0521* (-1.76) | 0.1174** (2.29) | 0.0849*** (3.53) | -0.1058** (-2.06) | 0.0627* (1.76) | ||
| 0.0455*** (3.40) | -0.0707** (-2.42) | 0.1343*** (2.65) | 0.1007*** (4.24) | -0.1455*** (-2.86) | 0.0722** (2.06) | ||
| Year | yes | yes | yes | yes | yes | yes | |
| City | yes | yes | yes | yes | yes | yes | |
| 224 | 224 | 224 | 224 | 224 | 224 | ||
| 0.2718 | 0.2228 | 0.3902 | 0.2398 | 0.2820 | 0.2134 |
注:*、**、***分别表示10%、5%、1%的显著性水平,括号内为t值,由于本文未对控制变量展开分析,因此控制变量的结果未汇报。 |
表5 替换被解释变量的检验结果Tab. 5 Regression results of using employment density to measure producer services agglomeration |
| 生产性服务业 | 运输服务业 | 信息服务业 | 金融服务业 | 租赁与商服业 | 研发设计业 | ||
|---|---|---|---|---|---|---|---|
| (1) | (2) | (3) | (4) | (5) | (6) | ||
| 二产主导型城市 | -0.1956** (-2.31) | -0.1885** (-2.41) | -0.2342 (-1.30) | 0.2911** (2.54) | -0.5011* (-1.73) | 0.1357 (0.88) | |
| 0.0260 (0.88) | 0.0040 (0.14) | -0.0387 (-0.62) | 0.0342 (0.85) | 0.2833*** (2.79) | -0.0551 (-1.03) | ||
| 0.0261 (0.83) | 0.0083 (0.29) | -0.0264 (-0.40) | -0.1138*** (-2.68) | -0.1438 (-1.34) | -0.1117** (-2.07) | ||
| 0.1787** (2.05) | 0.2347*** (2.92) | 0.2449 (1.32) | -0.2181* (-1.84) | 0.4501 (1.50) | -0.2067 (-1.31) | ||
| 0.2085** (2.41) | 0.1859** (2.33) | 0.1691 (0.92) | -0.3341*** (-2.85) | 0.5694* (1.92) | -0.2846* (-1.82) | ||
| DID | -0.1909** (-2.14) | -0.2297*** (-2.78) | -0.1800 (-0.95) | 0.2627** (2.16) | -0.5258* (-1.71) | 0.3544** (2.19) | |
| Year | yes | yes | yes | yes | yes | yes | |
| City | yes | yes | yes | yes | yes | yes | |
| 192 | 192 | 192 | 192 | 192 | 192 | ||
| 0.4655 | 0.8267 | 0.6563 | 0.6570 | 0.5546 | 0.7208 | ||
| 三产主导型城市 | 0.0921* (1.66) | 0.1890** (2.05) | -0.1277 (-0.92) | -0.0773 (-0.89) | -0.1338 (-0.94) | 0.1001 (1.10) | |
| 0.0056 (0.17) | 0.0584 (1.03) | 0.0100 (0.12) | -0.0545 (-1.07) | 0.0538 (0.65) | -0.1411*** (-2.65) | ||
| -0.0140 (-0.46) | -0.1986*** (-3.75) | -0.0184 (-0.24) | -0.2587*** (-5.47) | -0.0159 (-0.20) | 0.0521 (1.05) | ||
| -0.1211** (-2.06) | -0.1951* (-1.90) | 0.2546* (1.73) | 0.0338 (0.37) | 0.2398 (1.59) | -0.1978** (-2.05) | ||
| -0.1106** (-2.05) | -0.2787*** (-2.79) | 0.1632 (1.14) | -0.1188 (-1.33) | 0.1956 (1.34) | -0.1358 (-1.45) | ||
| DID | 0.1419** (2.29) | 0.2851*** (2.63) | -0.2863* (-1.84) | 0.1611* (1.67) | -0.2998* (-1.89) | 0.2352** (2.32) | |
| Year | yes | yes | yes | yes | yes | yes | |
| City | yes | yes | yes | yes | yes | yes | |
| 224 | 224 | 224 | 224 | 224 | 224 | ||
| 0.7875 | 0.5342 | 0.5211 | 0.7363 | 0.5036 | 0.7788 |
注:*、**、***分别表示10%、5%、1%的显著性水平,括号内为t值,由于本文未对控制变量展开分析,因此控制变量的结果未汇报。 |
真诚感谢匿名评审专家在论文评审中所付出的时间和精力,评审专家对本文的文献综述、实证模型设置、控制变量遴选、城市类型划分、文字表述等方面的修改意见,使本文获益匪浅。
| [1] |
初楠臣, 张平宇, 姜博. 基于日高铁流量视角的中国高速铁路网络空间特征. 地理研究, 2018, 37(11):2193-2205.
[
|
| [2] |
吴威, 梁双波, 曹有挥. 流域交通运输地理研究进展与展望. 地理科学进展, 2019, 38(8):1136-1149.
[
|
| [3] |
|
| [4] |
|
| [5] |
吴威, 曹有挥, 张璐璐, 等. 基于供给侧的区域交通发展水平综合评价: 以中国三大城市群为例. 地理科学, 2018, 38(4):495-503.
[
|
| [6] |
|
| [7] |
颜银根, 倪鹏飞, 刘学良 . 高铁开通, 地区特定要素与边缘地区的发展. 中国工业经济, 2020, (8):118-136.
[
|
| [8] |
李博, 张文忠, 余建辉. 服务业发展、信息化水平与全要素碳生产率增长: 基于门限效应的实证研究. 地理研究, 2016, 35(5):953-965.
[
|
| [9] |
刘锴, 李丹利, 刘桂春, 等. 中国沿海地区生产性服务业发展态势及驱动因素分析. 地理科学, 2018, 38(9):1543-1550.
[
|
| [10] |
申玉铭, 吴康, 任旺兵. 国内外生产性服务业空间集聚的研究进展. 地理研究, 2009, 28(6):1494-1507.
[
|
| [11] |
|
| [12] |
覃成林, 杨晴晴. 高速铁路对生产性服务业空间格局变迁的影响. 经济地理, 2017, 37(2):90-97.
[
|
| [13] |
|
| [14] |
|
| [15] |
|
| [16] |
刘玮辰, 曹有挥, 吴威, 等. 长江经济带铁路客运通达能力空间格局及第三产业发展效应分析. 地理科学, 2019, 39(4):626-635.
[
|
| [17] |
唐荣, 顾乃华. 高铁建设与上游生产性服务业发展: 基于PSM-DID的实证检验. 经济与管理研究, 2018, 39(7):58-68.
[
|
| [18] |
|
| [19] |
马红梅, 郝美竹. 中国高铁建设与沿线城市生产性服务业集聚: 影响机制与实证检验. 产业经济研究, 2020, (1):99-113.
[
|
| [20] |
邢丽峰. 高铁对京沪沿线区域第三产业集聚影响研究. 北京: 北京交通大学硕士学位论文, 2019: 40-41.
[
|
| [21] |
曹小曙, 洪浩霖, 梁斐雯. 高铁对中国城市群生产性服务业集聚的影响. 热带地理, 2019, 39(3):440-449.
[
|
| [22] |
|
| [23] |
王雨飞, 倪鹏飞. 高速铁路影响下的经济增长溢出与区域空间优化. 中国工业经济, 2016, (2):21-36.
[
|
| [24] |
|
| [25] |
|
| [26] |
|
| [27] |
|
| [28] |
何靖. 延付高管薪酬对银行风险承担的政策效应: 基于银行盈余管理动机视角的PSM-DID分析. 中国工业经济, 2016, (11):126-143.
[
|
| [29] |
|
| [30] |
邱灵, 方创琳. 北京市生产性服务业空间集聚综合测度. 地理研究, 2013, 32(1):99-110.
[
|
| [31] |
|
| [32] |
|
| [33] |
李一曼, 孔翔. 基于ESDA-GWR的浙江县域生产性服务业时空特征及影响因素分析. 长江流域资源与环境, 2018, 27(5):969-977.
[
|
| [34] |
许晖, 邹慧敏, 单凤玲. 外商投资中国生产性服务业影响因素研究: 基于产业互动和系统观的视角. 经济经纬, 2009, 5:39-43.
[
|
| [35] |
|
| [36] |
方远平, 陆莲芯, 毕斗斗, 等. 珠江三角洲港资服务业企业的空间格局及影响因素研究. 地理科学, 2020, 40(9):1421-1428.
[
|
| [37] |
方磊, 刘宏. 我国城市分类和城市发展问题的初步研究. 地理学报, 1988, (1):1-10.
[
|
| [38] |
|
| [39] |
曾春水, 申玉铭. 中国城市服务业职能特征研究. 地理研究, 2015, 34(9):1685-1696.
[
|
| [40] |
董艳梅, 朱英明. 高铁建设的就业效应研究: 基于中国285个城市倾向匹配倍差法的证据. 经济管理, 2016, 38(11):26-44.
[
|
| [41] |
|
/
| 〈 |
|
〉 |