
基于贫困分级的云南省城乡收入差距时空演化与影响因素研究
|
杨子生(1964-),男,云南大理人,教授,博士生导师,研究方向为城乡发展与土地利用、山区开发与精准扶贫。E-mail: yangzisheng@126.com |
收稿日期: 2020-08-17
录用日期: 2020-10-10
网络出版日期: 2021-10-10
基金资助
国家自然科学基金项目(41261018)
云南省教育厅科学研究基金研究生项目(编号2021Y547)
版权
Spatio-temporal evolution and influencing factors of urban-rural income gap in Yunnan province based on poverty classification
Received date: 2020-08-17
Accepted date: 2020-10-10
Online published: 2021-10-10
Copyright
云南是中国贫困县最多的山区省份,同时也是中国城乡收入差距长期居高不下的典型省份。针对当前研究中未能深入探讨城乡收入差距与各地贫困程度关联性、未能深入探讨各影响因素空间相关性、忽视关键地理因素对城乡收入差距影响等问题和不足,本文将各县按照贫困程度的差异划分为4个类别,使用云南省129个县(市)2010—2018年产业、社会、经济、人口等维度的面板数据,并引入“地形-气候综合优劣度”作为非经济指标,在分析城乡收入差距时空演化和空间格局特征基础上,运用空间动态面板模型深入探析了其影响因素。基于研究结果,认为有必要将缩小城乡收入差距与国家精准扶贫战略、城乡融合发展战略和乡村振兴战略有效衔接。
杨子生 , 杨人懿 , 刘凤莲 . 基于贫困分级的云南省城乡收入差距时空演化与影响因素研究[J]. 地理研究, 2021 , 40(8) : 2252 -2271 . DOI: 10.11821/dlyj020200783
Yunnan province has the largest number of poverty-stricken counties in China with mountainous area accounting for 93.60% of the total area. A long-term high income gap between urban and rural areas is widening in the province. This has brought great obstacles and challenges to the overall development of urban and rural areas and the implementation of rural revitalization strategy. In view of the problems and deficiencies in the current research, such as the lack of in-depth discussion on the relationship between urban-rural income gap and poverty level in different regions, the spatial correlation of various influencing factors, and the neglect of the impact of key geographical factors on the urban-rural income gap, this paper divides the counties into four categories (non-poor counties and poverty counties of grades I, II and III), using the panel data of industrial development dimension, social development dimension, economic level dimension and population structure dimension of 129 counties (county-level city) of Yunnan from 2010 to 2018, and introducing “terrain-climate comprehensive degree of excellence” as non-economic indicators. Based on the analysis of the spatio-temporal evolution and spatial pattern characteristics of urban-rural income gap, this paper uses spatial dynamic panel model to deeply study the influencing factors of urban-rural income gap in the study area. The results show that: (1) The average income gaps between urban and rural areas from 2010 to 2018 show a slight downward trend. The differences of the average annual income gap between urban and rural areas of the four types of counties are obvious, showing a trend of “grade III > grade II > grade I > non-poverty counties”. (2) The spatial autocorrelation of urban-rural income gap is obvious, and the spatial pattern shows a decreasing trend from the northwest and southeast to the centre of the province. In most areas, there exists an evolution law of “extreme poverty → low per capita disposable income of rural residents → expansion of urban-rural income gap” is generally presented. Rural poverty is often the root cause for the widening of urban-rural income gap. (3) The results of dynamic SAR model show that, the urban-rural income gap has a great inertia, with the increase of poverty level, and the degree of dependence shows a “U”-shaped pattern, which decreases first and then increases. On the whole, the development of the secondary industry plays a restraining role in narrowing the income gap between urban and rural areas, and the effect of expanding the urban-rural income gap is most obvious in the poverty counties of grade I. The development of tertiary industry in poverty-stricken counties is conducive to narrowing the income gap between urban and rural areas, and the effect on counties with deeper poverty is more obvious. The increase of population density can obviously bridge the urban-rural income gap. With the reduction of poverty, the increase of the ratio of urban and rural employees has an inverted U-shaped feature of “inhibition first and promotion later” to the income gap between urban and rural areas. The impact of per capita grain output is the most obvious in poverty counties of grade III, and there is a threshold of “terrain-climate comprehensive degree of excellence”, in which food curse exists in areas with harsh terrain and climate conditions. According to the research results and the view of the permanent rural poverty alleviation in mountainous areas, it is necessary to effectively link the narrowing of urban-rural income gap with the national targeted poverty alleviation strategy, rural revitalization strategy and urban-rural integrated development strategy, and bring it into the scope of government performance evaluation, so as to enhance the local government's attention to narrowing the urban-rural income gap and effectively promote the coordinated development of urban and rural areas in various regions.
表1 云南省城乡收入差距影响因素指标体系Tab. 1 Index system of influencing factors of urban-rural income gap in Yunnan province |
| 维度 | 变量 | 计算方法 | 名称 | 单位 |
|---|---|---|---|---|
| 产业发展 | 第一产业发展水平 | 第一产业产值/折算指数/总人口 | X1 | 元/人 |
| 第二产业发展水平 | 第二产业产值/折算指数/总人口 | X2 | 元/人 | |
| 第三产业发展水平 | 第三产业产值/折算指数/总人口 | X3 | 元/人 | |
| 社会发展 | 固定资产投资水平 | 固定资产投资(不含农户)/土地总面积/折算指数 | X4 | 万元/km2 |
| 公共财政预算支出水平 | 人均地方公共财政预算总支出/折算指数 | X5 | 元/人 | |
| 乡村发展水平 | 农、林、牧、渔业总产值/土地总面积/折算指数 | X6 | 万元/ km2 | |
| 城镇发展水平 | 工业总产值/土地总面积/折算指数 | X7 | 万元/ km2 | |
| 人均粮食产量 | 粮食总产量/总人口 | X8 | kg/人 | |
| 经济水平 | 土地综合生产率 | 当年GDP/土地总面积/折算指数 | X9 | 万元/km2 |
| 经济赶超压力 | X10 | 无 | ||
| 人口结构 | 城乡从业人员比例 | 单位从业人员/乡村从业人员 | X11 | 无 |
| 人口密度 | 总人口/土地面积 | X12 | 人/ km2 | |
| 地理环境 | 地形-气候综合优劣度 | 地形优劣度×0.6+气候优劣度×0.4 | X13 | 无 |
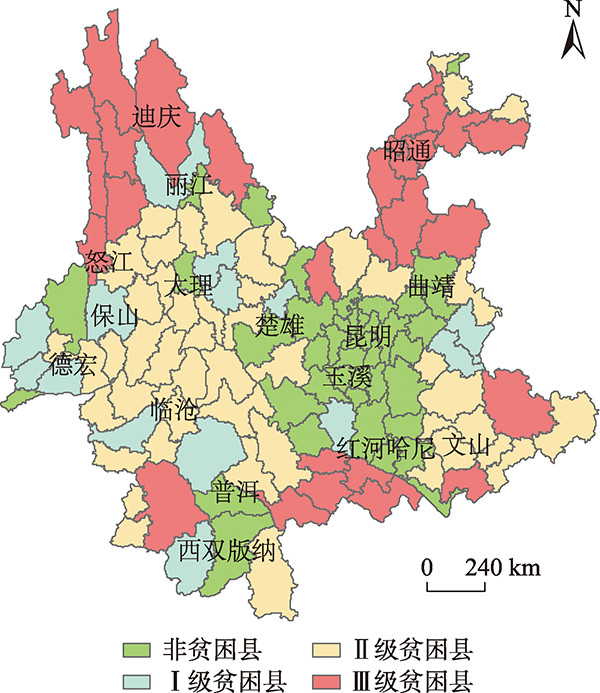
表2 云南省129个县(市、区)的贫困分级Tab. 2 Poverty classification of 129 counties in Yunnan province |
| 贫困分级 | 含义或划分依据 | 县份个数 | 贫困程度 |
|---|---|---|---|
| 非贫困县 | 全省所有的非贫困县 | 41个 | 较浅 |
| I级贫困县 | 属于全国连片特困地区县,但不属于国家扶贫开发工作重点县和深度贫困县 | 14个 | 中等 |
| II级贫困县 | 属于国家扶贫开发工作重点县,但不属于深度贫困县 | 47个 | 较深 |
| III级贫困县 | 云南省扶贫开发领导小组确定的所有深度贫困县 | 27个 | 很深 |
表3 云南省2010—2018年各贫困等级县份的城乡收入差距平均值检验ANOVA表输出结果Tab. 3 The output of ANOVA table on the average value of urban-rural income gap of poverty levels from 2010 to 2018 in Yunnan province |
| 比较对象 | 指标 | 2010年 | 2011年 | 2012年 | 2013年 | 2014年 | 2015年 | 2016年 | 2017年 | 2018年 |
|---|---|---|---|---|---|---|---|---|---|---|
| 全省非贫困县和各级贫困县 | 组间F统计量 | 31.337*** | 26.245*** | 27.430*** | 27.745*** | 26.153*** | 24.538*** | 23.872*** | 23.527*** | 23.369*** |
| P值 | 0.000 | 0.000 | 0.000 | 0.000 | 0.000 | 0.000 | 0.000 | 0.000 | 0.000 | |
| 非贫困县和I级贫困县 | 组间F统计量 | 11.558*** | 3.785* | 3.252* | 2.568 | 1.715 | 1.248 | 0.954 | 0.707 | 0.592 |
| P值 | 0.001 | 0.057 | 0.077 | 0.115 | 0.196 | 0.269 | 0.333 | 0.404 | 0.445 | |
| 非贫困县和II级贫困县 | 组间F统计量 | 68.465*** | 35.444*** | 34.507*** | 31.835*** | 28.687*** | 26.722*** | 25.276*** | 24.367*** | 22.869*** |
| P值 | 0.000 | 0.000 | 0.000 | 0.000 | 0.000 | 0.000 | 0.000 | 0.000 | 0.000 | |
| 非贫困县和III级贫困县 | 组间F统计量 | 73.770*** | 70.219*** | 69.879*** | 70.452*** | 66.242*** | 63.267*** | 61.557*** | 60.669*** | 60.797*** |
| P值 | 0.000 | 0.000 | 0.000 | 0.000 | 0.000 | 0.000 | 0.000 | 0.000 | 0.000 | |
| I级贫困县和II级贫困县 | 组间F统计量 | 7.453*** | 5.379** | 5.755** | 5.811** | 5.963** | 6.153** | 6.286** | 6.537** | 6.309** |
| P值 | 0.008 | 0.024 | 0.020 | 0.019 | 0.018 | 0.016 | 0.015 | 0.013 | 0.015 | |
| I级贫困县和III级贫困县 | 组间F统计量 | 12.483*** | 18.303*** | 19.274*** | 20.506*** | 20.364*** | 20.347*** | 20.580*** | 21.059*** | 21.514*** |
| P值 | 0.001 | 0.000 | 0.000 | 0.000 | 0.000 | 0.000 | 0.000 | 0.000 | 0.000 | |
| II级贫困县和III级贫困县 | 组间F统计量 | 3.377* | 11.998*** | 14.672*** | 16.545*** | 16.269*** | 14.677*** | 14.444*** | 14.366*** | 14.980*** |
| P值 | 0.070 | 0.001 | 0.000 | 0.000 | 0.000 | 0.000 | 0.000 | 0.000 | 0.000 |
注:***、**、*分别表示在1%、5%、10%的显著性水平下拒绝原假设。 |
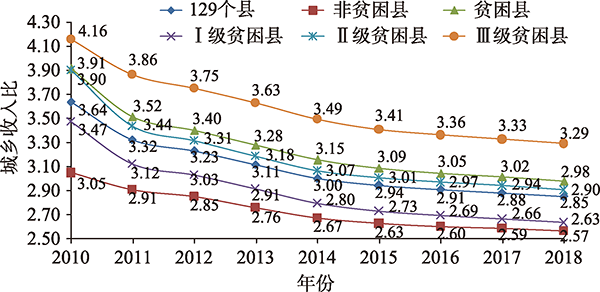
图1 2010—2018年云南省各县平均城乡收入比Fig. 1 Average urban-rural income ratio of counties in Yunnan province from 2010 to 2018 |
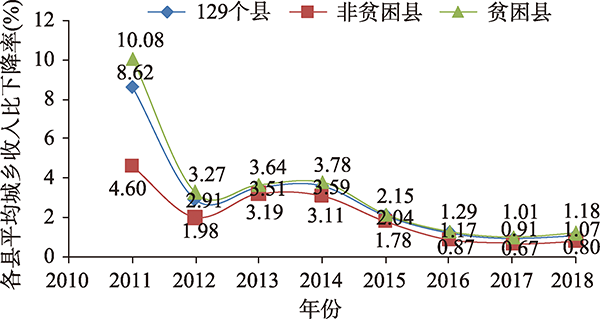
图2 2010—2018年云南省各县平均城乡收入比下降率Fig. 2 Decline rate of average urban-rural income ratio of counties in Yunnan province from 2010 to 2018 |
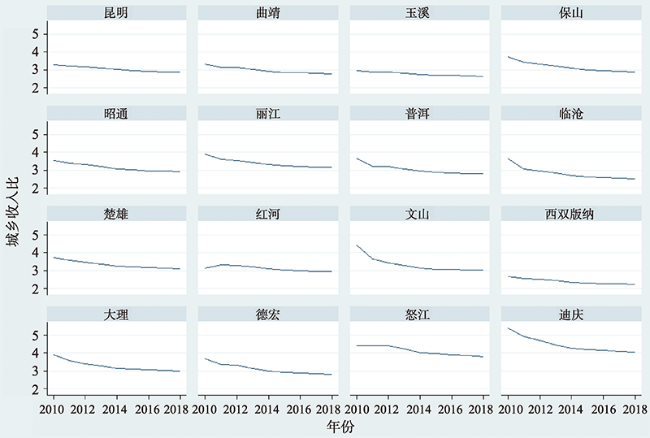
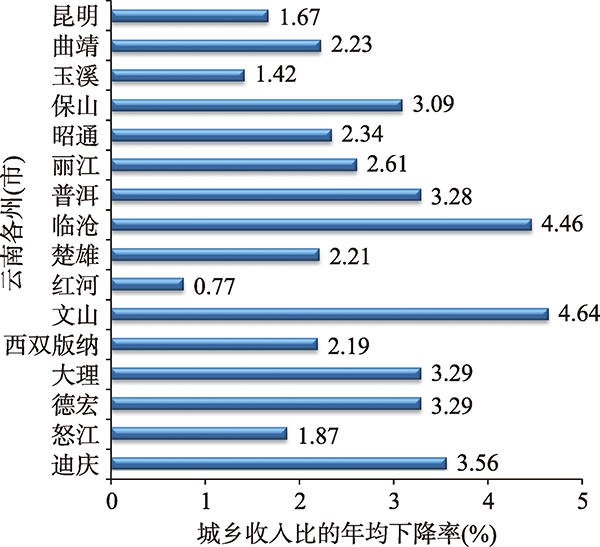
图3 2010—2018年16个州(市)城乡收入比Fig. 3 Urban-rural income ratio of 16 autonomous prefectures and cities from 2010 to 2018 |
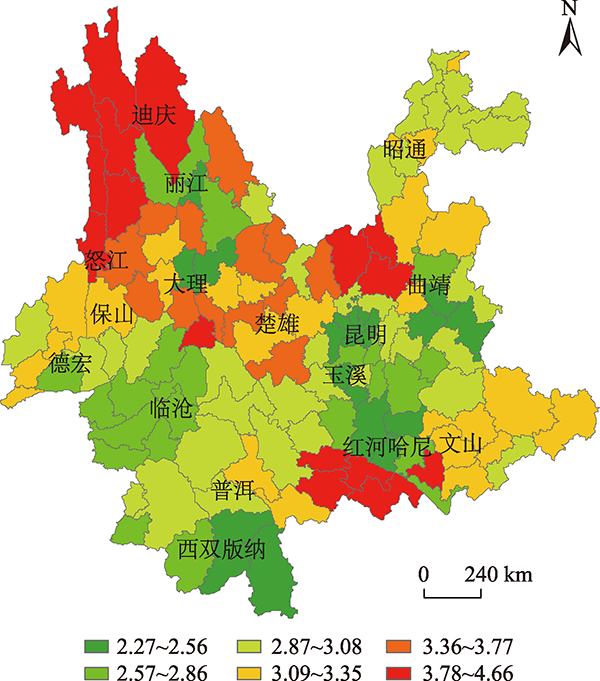
图5 2010—2018年平均城乡收入比注:根据国家测绘地理信息局标准地图(审图号:云S(2017)045号)绘制,底图无修改。 Fig. 5 Average urban-rural income ratio from 2010 to 2018 |
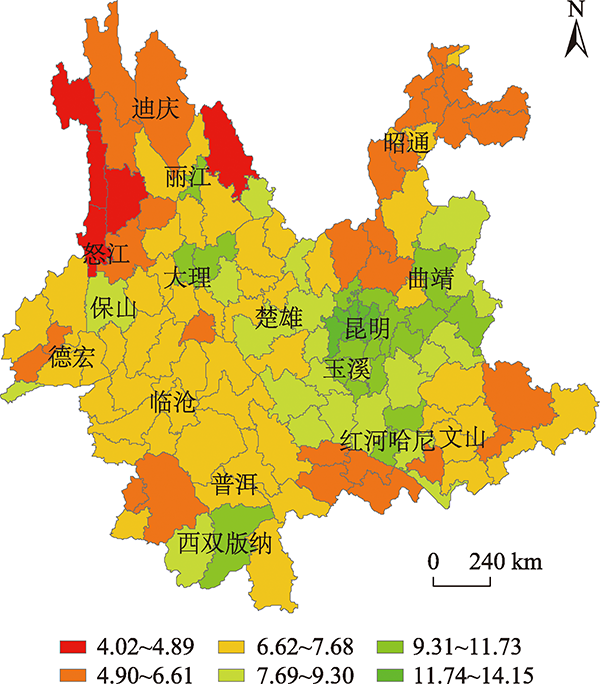
图6 2010—2018年平均农村居民人均可支配收入注:此图根据国家测绘地理信息局标准地图(审图号:云S(2017)045号)绘制,底图无修改。 Fig. 6 Average per capita disposable income of rural residents from 2010 to 2018 |
图7 云南省129个县的贫困分级注:根据国家测绘地理信息局标准地图(审图号:云S(2017)045号)绘制,底图无修改。 Fig. 7 Poverty classification of 129 counties in Yunnan province |
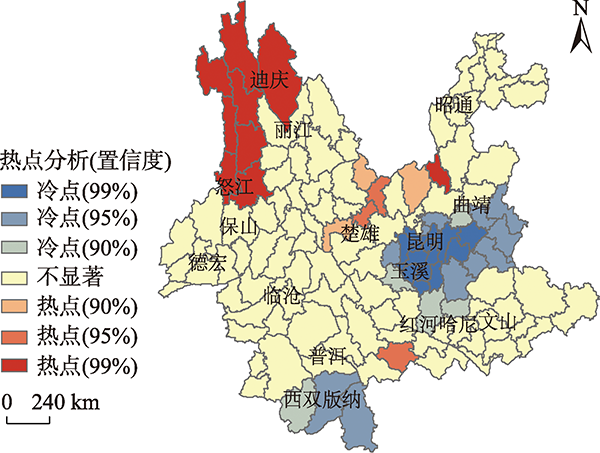
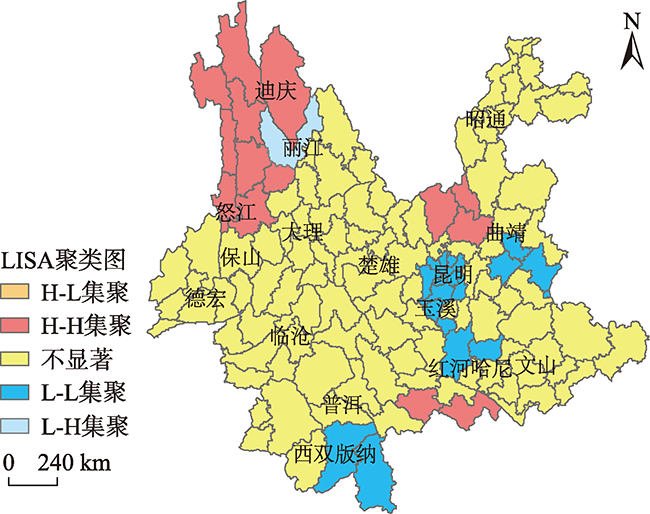
图8 2010—2018年平均城乡收入差距的冷热点分析注:根据国家测绘地理信息局标准地图(审图号:云S(2017)045号)绘制,底图无修改。 Fig. 8 Average urban-rural income ratio analysis on the cold and hot spots from 2010 to 2018 |
表4 云南省不同空间权重矩阵下的各空间动态自回归模型估计结果对比Tab. 4 Comparison of spatial dynamic panel autoregressive models with different spatial weight matrices in Yunnan province |
| 变量估计及模型 检验结果 | 空间邻接权重矩阵 | 空间反距离权重矩阵 | |||||||||||
|---|---|---|---|---|---|---|---|---|---|---|---|---|---|
| SAR-1 (全省129 个县) | SAR-2 (41个非贫困县) | SAR-3 (88个国定贫困县) | SAR-4 (14个I级贫困县) | SAR-5 (47个Ⅱ级贫困县) | SAR-6 (27个Ⅲ级贫困县) | SAR-7 (全省129 个县) | SAR-8 (41个非贫困县) | SAR-9 (88个国定贫困县) | SAR-10 (14个I级贫困县) | SAR-11 (47个Ⅱ级贫困县) | SAR-12 (27个Ⅲ级贫困县) | ||
| 参数ρ | 0.4064*** (10.50) | 0.1590** (2.15) | 0.3623*** (7.53) | -0.0626 (-0.91) | 0.1005 (1.63) | 0.0870 (1.36) | 0.5565*** (14.53) | 0.5885*** (9.76) | 0.5257*** (9.56) | 0.5098*** (7.03) | 0.5120*** (7.70) | 0.3720*** (3.60) | |
| 第一产业发展水平lnX1 | 0.0172* (1.86) | -0.0051 (-0.45) | 0.0175 (1.46) | -0.0176 (-0.74) | 0.0207 (1.09) | 0.0199 (0.98) | 0.0153* (1.65) | 0.0060 (0.59) | 0.0154 (1.26) | -0.0234 (-1.37) | 0.0187 (1.03) | 0.0215 (1.05) | |
| 第二产业发展水平lnX2 | 0.0132** (2.01) | 0.0124 (0.90) | 0.0093 (1.38) | 0.0490*** (3.65) | 0.0142 (1.49) | 0.0094 (0.54) | 0.0031 (0.57) | -0.0124 (-1.31) | 0.0027 (0.43) | 0.0305*** (3.88) | -0.0014 (-0.18) | 0.0071 (0.38) | |
| 第三产业发展水平lnX3 | -0.0215** (-2.42) | -0.0044 (-0.47) | -0.0357*** (-3.12) | -0.0241 (-1.07) | -0.0509*** (-3.25) | -0.0624*** (-3.16) | -0.0178* (-1.92) | 0.0003 (0.04) | -0.0310*** (-2.73) | 0.0195 (1.01) | -0.0247 (-1.62) | -0.0476** (-2.01) | |
| 固定资产投资水平lnX4 | -0.0010 (-0.38) | -0.0077 (-1.49) | 0.0004 (0.13) | -0.0047 (-0.57) | -0.0015 (-0.28) | -0.0075 (-1.38) | 0.0028 (1.11) | -0.0032 (-1.09) | 0.0037 (1.24) | -0.0021 (-0.47) | 0.0048 (0.97) | -0.0038 (-0.79) | |
| 公共财政预算支出水平 lnX5 | -0.0043 (-0.82) | -0.0092 (-1.10) | -0.0007 (-0.12) | 0.0318** (2.06) | -0.0155 (-1.46) | -0.0026 (-0.27) | 0.0003 (0.06) | 0.0032 (0.44) | 0.0069 (1.12) | 0.0264** (2.13) | 0.0093 (1.08) | -0.0025 (-0.28) | |
| 人均粮食产量lnX8 | 0.0399*** (3.52) | 0.0370*** (2.90) | 0.0343*** (2.69) | -0.0784 (-0.79) | -0.1686* (-1.77) | 0.0388*** (3.24) | 0.0398*** (2.86) | 0.0256** (1.99) | 0.0450*** (2.97) | 0.0387 (0.59) | -0.1791* (-1.67) | 0.0545*** (3.94) | |
| 经济赶超压力lnX10 | 0.0024 (0.59) | 0.0054 (0.97) | 0.0042 (0.71) | 0.0045 (0.26) | 0.0135 (1.38) | 0.0040 (0.40) | -0.0046 (-0.93) | -0.0031 (-0.63) | -0.0052 (-0.72) | -0.0324** (-2.14) | 0.0033 (0.36) | -0.0050 (-0.52) | |
| 城乡从业人员比例lnX11 | 0.0000 (0.02) | -0.0074 (-1.37) | 0.0016 (0.82) | -0.0089 (-1.21) | 0.0018 (0.49) | 0.0073 (1.60) | 0.0011 (0.62) | -0.0042 (-0.94) | 0.0024 (1.24) | -0.0060** (-1.98) | 0.0034 (1.19) | 0.0067** (2.17) | |
| 人口密度lnX12 | -0.2394*** (-2.72) | -0.2917*** (-2.83) | -0.5302*** (-4.91) | -1.0814*** (-2.94) | -1.0738*** (-4.74) | -0.5521*** (-2.59) | -0.1518** (-2.12) | -0.1180 (-1.56) | -0.3335*** (-3.11) | -0.5903*** (-3.57) | -0.4871*** (-2.67) | -0.2922* (-1.68) | |
| 人均粮食产量与地形-气候综合优劣度的交叉影响lnX8×X13 | -0.0728*** (-3.74) | -0.0631*** (-3.53) | -0.0615** (-2.55) | 0.0483 (0.27) | 0.2839* (1.80) | -0.0793*** (-2.92) | -0.0704*** (-3.14) | -0.0431** (-2.45) | -0.0789*** (-2.97) | -0.1149 (-1.03) | 0.3043* (1.70) | -0.1027*** (-3.53) | |
| 上年城乡收入差距lnYt-1 | 0.3266*** (14.36) | 0.5131*** (8.17) | 0.3029*** (13.87) | 0.3814*** (6.50) | 0.3464*** (10.54) | 0.4580*** (10.84) | 0.2987*** (16.46) | 0.3173*** (4.92) | 0.2728*** (13.02) | 0.2174*** (3.49) | 0.2522*** (8.96) | 0.3485*** (7.66) | |
| AIC信息准则 | -6092.390 | -1931.204 | -4120.450 | -623.301 | -2155.508 | -1207.098 | -6202.196 | -2051.154 | -4184.854 | -665.535 | -2249.321 | -1237.714 | |
| BIC信息准则 | -6028.180 | -1881.895 | -4061.212 | -587.960 | -2104.424 | -1163.219 | -6137.986 | -2001.845 | -4125.616 | -630.195 | -2198.237 | -1193.836 | |
| Log Likelihood | 3059.195 | 978.602 | 2073.225 | 324.650 | 1090.754 | 616.549 | 3114.098 | 1038.577 | 2105.427 | 345.768 | 1137.661 | 631.857 | |
| Within R2 | 0.9353 | 0.9208 | 0.9430 | 0.9532 | 0.9450 | 0.9416 | 0.9396 | 0.9339 | 0.9460 | 0.9590 | 0.9450 | 0.9496 | |
注:***、**、*分别表示在1%、5%、10%的显著性水平下拒绝原假设;括号内为Z统计量估计结果;本研究均选用固定效应模型;所有模型均使用稳健标准误法(Robust)估计。 |
感谢匿名评审专家在论文评审中所付出的时间和精力,尤其评审专家对本文模型的完善等方面的修改意见,使本文获益匪浅。同时,感谢云南财经大学国土资源与持续发展研究所张博胜博士在图件处理上给予的帮助。
| [1] |
|
| [2] |
习近平. 决胜全面建成小康社会夺取新时代中国特色社会主义伟大胜利: 在中国共产党第十九次全国代表大会上的报告. 北京: 人民出版社, 2017. 1-71.
[
|
| [3] |
|
| [4] |
|
| [5] |
|
| [6] |
|
| [7] |
|
| [8] |
|
| [9] |
|
| [10] |
| [11] |
|
| [12] |
|
| [13] |
|
| [14] |
|
| [15] |
李实, 罗楚亮. 中国城乡居民收入差距的重新估计. 北京大学学报: 哲学社会科学版, 2007, 44(2):111-120.
[
|
| [16] |
左义河. 中国城乡收入差距影响因素实证分析: 基于收入来源视角. 经济问题, 2011, (9):40-43.
[
|
| [17] |
孙敬水, 黄秋虹. 中国城乡收入差距主要影响因素及其贡献率研究: 基于全国31个省份6937份家庭户问卷调查数据分析. 经济理论与经济管理, 2013, (6):5-16.
[
|
| [18] |
武小龙, 刘祖云. 中国城乡收入差距影响因素研究: 基于2002—2011年省级Panel Data的分析. 当代经济科学, 2014, 36 (1): 46-54, 125-126.
[
|
| [19] |
|
| [20] |
程永宏. 改革以来全国总体基尼系数的演变及其城乡分解. 中国社会科学, 2007, (4):45-60, 205.
[
|
| [21] |
潘竟虎. 中国地级及以上城市城乡收入差距时空分异格局. 经济地理, 2014, 34(6):60-67.
[
|
| [22] |
孙晓一, 徐勇, 刘艳华. 中国居民收入差距及空间分异特征. 经济地理, 2015, 35(12):18-25, 42.
[
|
| [23] |
陈斐, 俞彤晖, 王海萍. 中部地区城乡收入两极分化程度分析及其时空特征变化. 人文地理, 2012, 27(5):104-109.
[
|
| [24] |
丁志伟, 张改素, 王发曾. 中原地区多尺度城乡收入的时空分异. 地理研究, 2015, 34(1):131-148.
[
|
| [25] |
李俊杰, 米文宝, 宋永永, 等. 宁夏城乡收入差距时空分异及影响因素. 农业现代化研究, 2016, 37(4):785-793.
[
|
| [26] |
张改素, 丁志伟. 2000—2015年我国省、市、县域3种尺度下城乡收入差距的时空格局演化. 河南科学, 2019, 37(10):1708-1720.
[
|
| [27] |
|
| [28] |
陈斌开, 林毅夫. 发展战略、城市化与中国城乡收入差距. 中国社会科学, 2013, (4):81-102, 206.
[
|
| [29] |
吕炜, 番绍立, 樊静丽, 等. 我国农民工市民化政策对城乡收入差距影响的实证研究: 基于CGE模型的模拟分析. 管理世界, 2015, (7):170-171.
[
|
| [30] |
|
| [31] |
|
| [32] |
张淑惠, 刘敬. 精准扶贫政策缩小了城乡收入差距吗? 基于空间面板数据的实证研究. 新疆大学学报: 哲学·人文社会科学版, 2018, 46(6):1-9. DOI: 10.13568/j.cnki.issn1000-2820.2018.06.001.
[
|
| [33] |
王少平, 欧阳志刚. 中国城乡收入差距对实际经济增长的阈值效应. 中国社会科学, 2008, (2):54-66, 205.
[
|
| [34] |
|
| [35] |
|
| [36] |
|
| [37] |
|
| [38] |
李永友, 王超. 集权式财政改革能够缩小城乡差距吗? 基于“乡财县管”准自然实验的证据. 管理世界, 2020, 36(4):113-130.
[
|
| [39] |
温涛, 冉光和, 熊德平. 中国金融发展与农民收入增长. 经济研究, 2005, (9):30-43.
[
|
| [40] |
万海远, 李实. 户籍歧视对城乡收入差距的影响. 经济研究, 2013, 48(9):43-55.
[
|
| [41] |
|
| [42] |
李根. 长江经济带产业结构与城乡收入差距关系研究: 基于面板数据的实证检验. 经济问题探索, 2019, (7):72-77.
[
|
| [43] |
江孝君, 杨青山, 张郁, 等. 东北地区多尺度城乡收入差距时空分异及影响因素. 现代城市研究, 2019, (10):109-118.
[
|
| [44] |
宋佳. 河北省城乡收入差距影响因素实证分析. 中国经贸导刊(中), 2019, (11):92-94.
[
|
| [45] |
杨子生, 赵乔贵, 辛玲. 云南土地资源. 北京: 中国科学技术出版社, 2014. 129-388.
[
|
| [46] |
王旎, 王熙. 云南省城乡收入差距逐年扩大的原因分析. 经贸实践, 2018, (22): 61, 63.
[
|
| [47] |
杨虹, 张柯. 普惠金融发展、经济增长与城乡收入差距影响研究: 基于云南省面板数据的实证分析. 云南财经大学学报, 2020, 36(5):52-65.
[
|
| [48] |
何仁伟. 城乡融合与乡村振兴: 理论探讨、机理阐释与实现路径. 地理研究, 2018, 37(11):2127-2140.
[
|
| [49] |
张英男, 龙花楼, 马历, 等. 城乡关系研究进展及其对乡村振兴的启示. 地理研究, 2019, 38(3):578-594.
[
|
| [50] |
李玉恒, 阎佳玉, 宋传垚. 乡村振兴与可持续发展: 国际典型案例剖析及其启示. 地理研究, 2019, 38(3):595-604.
[
|
| [51] |
周建, 高静, 周杨雯倩. 空间计量经济学模型设定理论及其新进展. 经济学报, 2016, 3(2):161-190.
[
|
| [52] |
|
| [53] |
杨子生, 李云辉, 邹忠, 等. 中国西部大开发云南省土地资源开发利用规划研究. 昆明: 云南科技出版社, 2003. 24-29.
[
|
| [54] |
缪小林, 王婷, 高跃光. 转移支付对城乡公共服务差距的影响: 不同经济赶超省份的分组比较. 经济研究, 2017, 52(2):52-66.
[
|
| [55] |
云南省农业区划委员会办公室. 云南省不同气候带和坡度的土地面积. 昆明: 云南科技出版社, 1987. 8-50.
[Office of Yunnan Agricultural Zoning Committee. The Land Area of Different Climatic Zones and Slopes in Yunnan province. Kunming: Yunnan Science and Technology Publishing House, 1987. 8-50.]
|
| [56] |
国务院扶贫开发领导小组办公室. 中国农村扶贫开发纲要: 2011—2020年干部辅导读本. 北京: 中国财政经济出版社, 2012: 1-18.
[Office of State Council Poverty Alleviation and Development Leading Group. Guide Book for Cadres on Framework of Poverty Alleviation and Development in Rural China: 2011-2020. Beijing: China Financial and Economic Publishing House, 2012: 1-18.]
|
| [57] |
国务院扶贫开发领导小组办公室. 关于公布全国连片特困地区分县名单的说明. http://www.cpad.gov.cn/art/2012/6/14/art_343_41.html 2012-06-14.
[Office of State Council Poverty Alleviation and Development Leading Group. Note on Note on the publication of a national list of districts divided into contiguous areas of extreme poverty. http://www.cpad.gov.cn/art/2012/6/14/art_343_41.html 2012-06-14]
|
| [58] |
国家统计局云南调查总队. 云南调查年鉴2019. 北京: 中国统计出版社, 2019. 150-166.
[Surbey Office of the National Bureau of Statistics in Yunnan. Yunnan Survey Yearbook 2019. Beijing: China Statistics Press, 2019. 150-166.]
|
/
| 〈 |
|
〉 |