
中国城市房价、收入与房价收入比的时空分异格局
|
陈艳如(1995-),女,福建厦门人,博士研究生,研究方向为城市社会地理。E-mail: chenyanru18@mails.ucas.ac.cn |
收稿日期: 2020-08-25
录用日期: 2020-10-14
网络出版日期: 2021-11-10
基金资助
国家自然科学基金项目(41871116)
国家自然科学基金项目(41771184)
国家自然科学基金项目(41901196)
版权
The spatiotemporal differentiation pattern of Chinese urban housing price, income and housing price-to-income ratio
Received date: 2020-08-25
Accepted date: 2020-10-14
Online published: 2021-11-10
Copyright
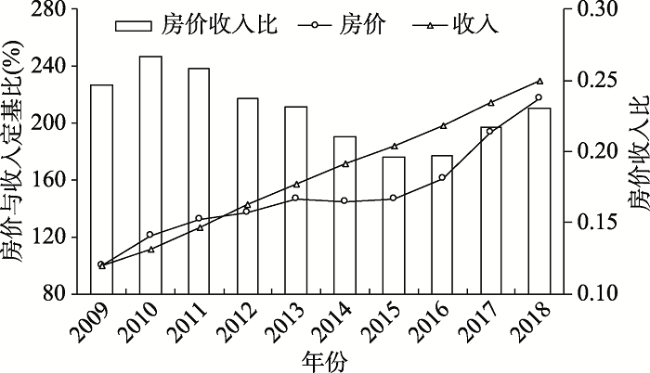
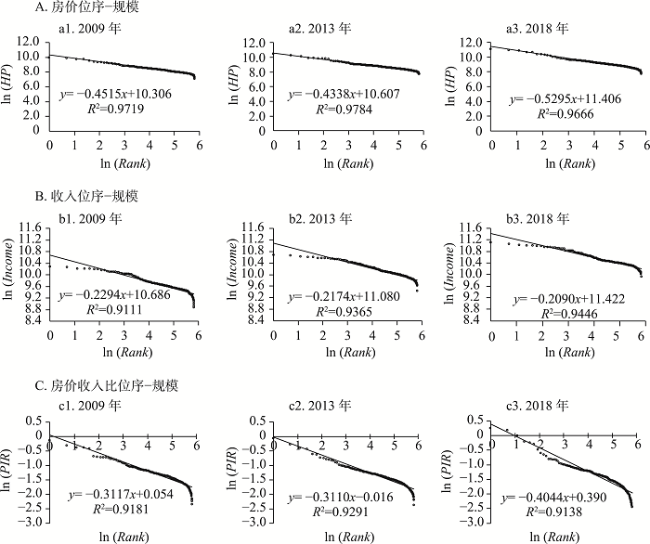
中国城市房价快速增长背景下,城市房价、收入与房价收入比空间格局既有相似性,也表现出差异性,其空间异质性与空间依赖性特征显著。本文以中国337个地级行政单元为研究对象,运用泰尔指数、位序-规模和空间马尔科夫链等方法,对2009—2018年中国城市房价、收入和房价收入比的时空分异格局、整体稳定性和空间依赖性特征进行分析发现:① 中国城市房价增长呈现出波动性特征,整体分异程度增强,房价城市体系呈现“金字塔型”结构,收入则表现出平稳增长态势,整体分异度降低,城市体系呈现“橄榄型”结构,在房价与收入共同影响下,房价收入比整体差异性显著加强;② 城市房价空间格局表现出“地带性”与“等级性”差异并存,而收入更多表现出“地带性”差异,房价收入比则以“等级性”差异为主;③ 城市房价和收入类型的稳定性和空间依赖性较强,高、低水平城市存在两极分化与“俱乐部收敛”现象,房价收入比稳定性相对较弱。对中国城市房价、收入和房价收入比时空分异格局和空间关联效应的分析,可以为探索中国城市房价收入比空间分异模式与机理提供必要研究基础。
陈艳如 , 谷跃 , 宋伟轩 . 中国城市房价、收入与房价收入比的时空分异格局[J]. 地理研究, 2021 , 40(9) : 2442 -2458 . DOI: 10.11821/dlyj020200817
Amid the fast-growing housing price in Chinese cities, the spatial pattern of urban housing price, income and housing price-to-income ratio shows both similarities and differences, characterized by internal spatial heterogeneity and spatial dependence. This paper targets 337 prefecture-level administrative units and applies the Theil index, rank-size and spatial Markov chain to the analysis of the spatiotemporal differentiation pattern, overall stability and spatial dependence of Chinese urban housing price, income and housing price-to-income ratio from 2009 to 2018. It finds the following results. Firstly, the growth of Chinese urban housing price is phase-based and fluctuated. When the overall differentiation enlarges, the urban system of housing price takes on a structure of “pyramid” and income shows sustained and stable growth. When the overall differentiation shrinks, the urban system presents a structure of “olive”. Under the combined influence of housing price and income, the overall differentiation of housing price-to-income ratio is obviously strengthened. Secondly, housing prices, income and housing price-to-income ratios in Chinese cities are all spatially heterogeneous and agglomerated. The spatial pattern of housing price is different in both zonality and hierarchy, while income is particularly different in zonality and housing price-to-income ratio is particularly different in hierarchy. Due to the coexistence of similarities and differences between housing prices and income patterns in Chinese cities, the housing price-to-income ratio pattern presents a more complex and discrete structure. Thirdly, the stability and spatial dependence of urban housing price and the type of income is stronger, while the stability of housing price-to-income ratio is relatively weak as there are polarization and club convergence in cities at different levels. Housing prices to the north of the "Hu Huanyong Line" shifted downwards, income shifted upwards, and the housing price-to-income ratio declined. In the southern regions, housing prices generally rose rapidly, with income shifts showing stable in the east, downwards in the central region, and upwards in the west, leading to the discrete and broken pattern of housing price-to-income ratios. Moreover, the type shifts of urban housing price, income and housing price-to-income ratio are not spatially independent, but related to the neighboring cities. The analysis of the spatiotemporal differentiation pattern and spatial correlation effect of Chinese urban housing price, income, and housing price-to-income ratio lays a foundation for research on the spatial differentiation pattern and mechanism of Chinese urban housing price-to-income ratio.
图3 2009年、2013年、2018年中国城市房价、收入和房价收入比位序-规模分析Fig. 3 The rank-size analysis of Chinese urban housing prices, income and price-to-income ratio in 2009, 2013, and 2018 |
表1 2009—2018年中国城市房价、收入和房价收入比泰尔指数与贡献率变化Tab. 1 Theil indexes and contribution rate of Chinese urban housing prices, income and housing price-to-income ratio from 2009 to 2018 |
| 年份 | 房价 整体指数 | 贡献率 (%) | 收入 整体指数 | 贡献率 (%) | 房价收入比整体指数 | 贡献率 (%) | |||
|---|---|---|---|---|---|---|---|---|---|
| 省域间 | 省域内 | 省域间 | 省域内 | 省域间 | 省域内 | ||||
| 2009 | 0.0639 | 50.18 | 49.82 | 0.0131 | 49.88 | 50.12 | 0.0259 | 40.27 | 59.73 |
| 2010 | 0.0727 | 52.36 | 47.64 | 0.0130 | 50.30 | 49.70 | 0.0311 | 43.90 | 56.10 |
| 2011 | 0.0576 | 51.70 | 48.30 | 0.0128 | 50.77 | 49.23 | 0.0235 | 41.85 | 58.15 |
| 2012 | 0.0581 | 51.23 | 48.77 | 0.0120 | 49.04 | 50.96 | 0.0245 | 42.86 | 57.14 |
| 2013 | 0.0622 | 48.14 | 51.86 | 0.0115 | 49.60 | 50.40 | 0.0267 | 42.23 | 57.77 |
| 2014 | 0.0645 | 44.95 | 55.05 | 0.0111 | 47.85 | 52.15 | 0.0280 | 42.10 | 57.90 |
| 2015 | 0.0754 | 44.42 | 55.58 | 0.0107 | 42.26 | 57.74 | 0.0327 | 42.31 | 57.69 |
| 2016 | 0.0953 | 44.91 | 55.09 | 0.0106 | 44.53 | 55.47 | 0.0430 | 44.97 | 55.03 |
| 2017 | 0.1045 | 48.86 | 51.14 | 0.0107 | 44.92 | 55.08 | 0.0506 | 50.63 | 49.37 |
| 2018 | 0.0959 | 48.17 | 51.83 | 0.0108 | 46.75 | 53.25 | 0.0498 | 48.33 | 51.67 |
注:针对省级直辖市,计算贡献率时,按照将北京和天津并入河北省、上海并入浙江省、重庆并入四川省的方式处理。 |
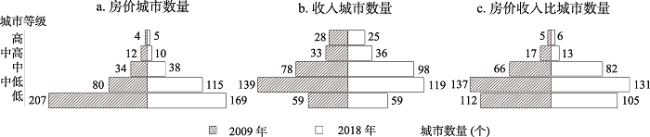
图4 2009年和2018年中国不同等级房价、收入和房价收入比城市数量比较Fig. 4 China's housing price, income and housing price-to-income ratio in different levels of cities in 2009 and 2018 |
表2 2018年中国房价、收入和房价收入比排名前10的城市Tab. 2 China's top 10 cities in terms of housing price, income and housing price-to-income ratio in 2018 |
| 排名 | 房价 | 收入 | 房价收入比 | |||||
|---|---|---|---|---|---|---|---|---|
| 城市 | 数值(元/m2) | 城市 | 数值(元/年) | 城市 | 数值 | |||
| 1 | 北京 | 64864 | 上海 | 66977 | 北京 | 1.2868 | ||
| 2 | 深圳 | 57664 | 苏州 | 63500 | 三亚 | 1.2145 | ||
| 3 | 上海 | 54259 | 杭州 | 61172 | 深圳 | 1.0021 | ||
| 4 | 三亚 | 44227 | 宁波 | 60134 | 上海 | 0.8101 | ||
| 5 | 厦门 | 43216 | 广州 | 59982 | 厦门 | 0.7944 | ||
| 6 | 广州 | 32852 | 南京 | 59308 | 天津 | 0.7456 | ||
| 7 | 杭州 | 31924 | 绍兴 | 59049 | 福州 | 0.6213 | ||
| 8 | 南京 | 29667 | 深圳 | 57544 | 广州 | 0.5477 | ||
| 9 | 福州 | 27623 | 嘉兴 | 57437 | 杭州 | 0.5219 | ||
| 10 | 天津 | 25612 | 无锡 | 56989 | 南京 | 0.5002 | ||
表3 2009—2018年中国城市房价、收入和房价收入比类型马尔科夫概率矩阵Tab. 3 Markov transition probability matrix for Chinese urban housing price, income and housing price-to-income ratio types from 2009 to 2018 |
| t/t+1 | 房价 | 收入 | 房价收入比 | ||||||||||||||
|---|---|---|---|---|---|---|---|---|---|---|---|---|---|---|---|---|---|
| 1 | 2 | 3 | 4 | 5 | 1 | 2 | 3 | 4 | 5 | 1 | 2 | 3 | 4 | 5 | |||
| 1 | 0.850 | 0.138 | 0.010 | 0.002 | 0 | 0.897 | 0.096 | 0.003 | 0.002 | 0.002 | 0.768 | 0.150 | 0.031 | 0.026 | 0.025 | ||
| 2 | 0.138 | 0.721 | 0.131 | 0.010 | 0 | 0.080 | 0.797 | 0.106 | 0.013 | 0.003 | 0.160 | 0.596 | 0.175 | 0.047 | 0.021 | ||
| 3 | 0.013 | 0.138 | 0.720 | 0.129 | 0 | 0.010 | 0.098 | 0.804 | 0.080 | 0.008 | 0.028 | 0.201 | 0.579 | 0.161 | 0.032 | ||
| 4 | 0 | 0.003 | 0.138 | 0.793 | 0.066 | 0.012 | 0.008 | 0.080 | 0.869 | 0.032 | 0.028 | 0.042 | 0.179 | 0.630 | 0.121 | ||
| 5 | 0 | 0 | 0 | 0.066 | 0.934 | 0.002 | 0.003 | 0.005 | 0.037 | 0.954 | 0.017 | 0.015 | 0.033 | 0.134 | 0.801 | ||
注:t/t+1表示相邻年份的转移;1、2、3、4、5分别表示低、中低、中等、中高、高5种城市类型。 |
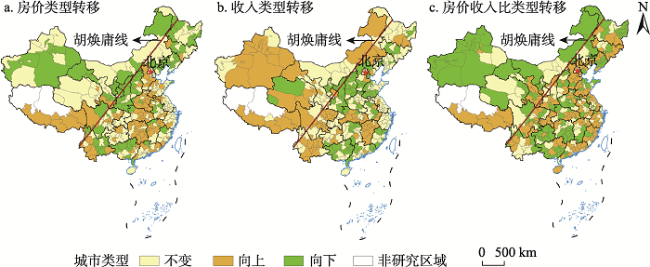
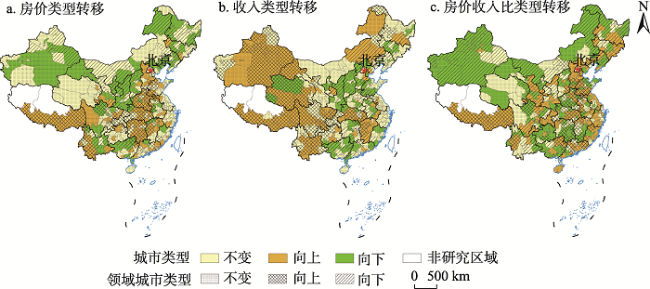
图5 2009年、2013年、2018年中国城市房价、收入和房价收入比空间分布格局注:此图基于国家自然资源部标准地图服务系统的标准地图(审图号:GS(2019)1697号)绘制,底图无修改。 Fig. 5 Spatial distribution pattern of Chinese urban housing prices, income and housing price-to-income ratio in 2009, 2013 and 2018 |
表4 2009—2018年中国城市房价、收入和房价收入比类型空间马尔科夫链转移概率矩阵Tab. 4 Spatial Markov chain transition probability matrix for housing price, income and housing price-to-income ratio types from 2009 to 2018 |
| 空间滞后 | t/t+1 | 房价 | 收入 | 房价收入比 | ||||||||||||||
|---|---|---|---|---|---|---|---|---|---|---|---|---|---|---|---|---|---|---|
| 1 | 2 | 3 | 4 | 5 | 1 | 2 | 3 | 4 | 5 | 1 | 2 | 3 | 4 | 5 | ||||
| 1 | 1 | 0.857 | 0.127 | 0.016 | 0 | 0 | 0.909 | 0.091 | 0 | 0 | 0 | 0.772 | 0.183 | 0.022 | 0.011 | 0.011 | ||
| 2 | 0.167 | 0.720 | 0.106 | 0.008 | 0 | 0.071 | 0.826 | 0.090 | 0.013 | 0 | 0.170 | 0.614 | 0.177 | 0.026 | 0.013 | |||
| 3 | 0.035 | 0.128 | 0.709 | 0.128 | 0 | 0 | 0.079 | 0.820 | 0.090 | 0.011 | 0.074 | 0.185 | 0.556 | 0.176 | 0.009 | |||
| 4 | 0 | 0 | 0.103 | 0.808 | 0.090 | 0 | 0 | 0.060 | 0.896 | 0.045 | 0.074 | 0.063 | 0.190 | 0.558 | 0.116 | |||
| 5 | 0 | 0 | 0 | 0.127 | 0.873 | 0 | 0 | 0 | 0 | 1 | 0.075 | 0.015 | 0.015 | 0.179 | 0.716 | |||
| 2 | 1 | 0.805 | 0.188 | 0.008 | 0 | 0 | 0.874 | 0.120 | 0.006 | 0 | 0 | 0.838 | 0.113 | 0.007 | 0.014 | 0.028 | ||
| 2 | 0.130 | 0.726 | 0.144 | 0 | 0 | 0.099 | 0.769 | 0.115 | 0.017 | 0 | 0.168 | 0.528 | 0.208 | 0.072 | 0.024 | |||
| 3 | 0.019 | 0.099 | 0.753 | 0.130 | 0 | 0.015 | 0.128 | 0.790 | 0.068 | 0 | 0.015 | 0.232 | 0.623 | 0.101 | 0.029 | |||
| 4 | 0 | 0 | 0.192 | 0.750 | 0.058 | 0.024 | 0 | 0.071 | 0.833 | 0.071 | 0.032 | 0.095 | 0.200 | 0.568 | 0.105 | |||
| 5 | 0 | 0 | 0 | 0.083 | 0.917 | 0 | 0 | 0 | 0.067 | 0.933 | 0.018 | 0.009 | 0.027 | 0.107 | 0.839 | |||
| 3 | 1 | 0.878 | 0.107 | 0.008 | 0.008 | 0 | 0.909 | 0.080 | 0.011 | 0 | 0 | 0.785 | 0.154 | 0.020 | 0.027 | 0.013 | ||
| 2 | 0.117 | 0.736 | 0.129 | 0.018 | 0 | 0.102 | 0.725 | 0.153 | 0.010 | 0.010 | 0.183 | 0.619 | 0.167 | 0.024 | 0.008 | |||
| 3 | 0.015 | 0.168 | 0.723 | 0.095 | 0 | 0.015 | 0.055 | 0.839 | 0.080 | 0.010 | 0.032 | 0.222 | 0.548 | 0.167 | 0.032 | |||
| 4 | 0 | 0.008 | 0.160 | 0.824 | 0.025 | 0 | 0.012 | 0.088 | 0.877 | 0.024 | 0.039 | 0.019 | 0.165 | 0.631 | 0.146 | |||
| 5 | 0 | 0 | 0 | 0.057 | 0.943 | 0 | 0 | 0.042 | 0.063 | 0.896 | 0.030 | 0.020 | 0.101 | 0.152 | 0.697 | |||
| 4 | 1 | 0.854 | 0.146 | 0 | 0 | 0 | 0.917 | 0.083 | 0 | 0 | 0 | 0.682 | 0.177 | 0.082 | 0.035 | 0.024 | ||
| 2 | 0.170 | 0.693 | 0.139 | 0 | 0 | 0.072 | 0.820 | 0.094 | 0.014 | 0 | 0.127 | 0.647 | 0.160 | 0.047 | 0.020 | |||
| 3 | 0 | 0.156 | 0.714 | 0.130 | 0 | 0.007 | 0.157 | 0.757 | 0.071 | 0.007 | 0.022 | 0.224 | 0.590 | 0.149 | 0.015 | |||
| 4 | 0 | 0 | 0.130 | 0.845 | 0.025 | 0.012 | 0.012 | 0.092 | 0.867 | 0.017 | 0.007 | 0.041 | 0.169 | 0.703 | 0.081 | |||
| 5 | 0 | 0 | 0 | 0.088 | 0.912 | 0 | 0.023 | 0.011 | 0.091 | 0.875 | 0 | 0.042 | 0.142 | 0.168 | 0.747 | |||
| 5 | 1 | 0 | 0 | 0 | 0 | 0 | 0.500 | 0 | 0 | 0.250 | 0.250 | 0.661 | 0.089 | 0.071 | 0.089 | 0.089 | ||
| 2 | 0.031 | 0.750 | 0.156 | 0.063 | 0 | 0 | 0.921 | 0.053 | 0 | 0.026 | 0.155 | 0.517 | 0.155 | 0.103 | 0.069 | |||
| 3 | 0 | 0.141 | 0.656 | 0.203 | 0 | 0 | 0.048 | 0.810 | 0.119 | 0.024 | 0 | 0.113 | 0.567 | 0.237 | 0.083 | |||
| 4 | 0 | 0.007 | 0.106 | 0.731 | 0.156 | 0.028 | 0.009 | 0.064 | 0.872 | 0.028 | 0.012 | 0.012 | 0.179 | 0.642 | 0.154 | |||
| 5 | 0 | 0 | 0 | 0.014 | 0.986 | 0.002 | 0 | 0 | 0.022 | 0.976 | 0 | 0.004 | 0.009 | 0.113 | 0.874 | |||
注:t/t+1表示相邻年份的转移;1、2、3、4、5分别表示低、中低、中等、中高、高5种城市类型。 |
真诚感谢二位匿名评审专家在论文评审中所付出的时间和精力,评审专家对本文研究方法、数据说明、结果分析、结论梳理等方面的修改意见,使本文获益匪浅。
| [1] |
宋伟轩, 马雨竹, 李晓丽, 等. 南京城市住宅小区房价增长模式与效应. 地理学报, 2018, 73(10):1880-1895.
[
|
| [2] |
|
| [3] |
|
| [4] |
|
| [5] |
|
| [6] |
|
| [7] |
|
| [8] |
林李月, 朱宇, 柯文前, 等. 流动人口流出地住房投资特征及影响因素: 基于福建省的调查. 地理科学, 2020, 40(3):401-408.
[
|
| [9] |
宋伟轩, 刘春卉. 长三角一体化区域城市商品住宅价格分异机理研究. 地理研究, 2018, 37(1):92-102.
[
|
| [10] |
李庭竹, 刘冉. 流动人口租房压力的空间分异及机理分析. 地域研究与开发, 2020, 39(2): 163-168+180.
[
|
| [11] |
周京奎. 房地产价格波动与投机行为: 对中国14城市的实证研究. 当代经济科学, 2005, 27(4): 119-24+109.
[
|
| [12] |
张少尧, 宋雪茜, 邓伟. 空间功能视角下的公共服务对房价的影响: 以成都市为例. 地理科学进展, 2017, 36(8):995-1005.
[
|
| [13] |
|
| [14] |
王少剑, 王洋, 蔺雪芹, 等. 中国县域住宅价格的空间差异特征与影响机制. 地理学报, 2016, 71(8):1329-1342.
[
|
| [15] |
潘竟虎, 杨亮洁. 中国地级及以上城市房价收入比的时空分异. 干旱区地理, 2017, 40(6):1274-1281.
[
|
| [16] |
韦汝虹, 金李, 方达. 基于GIS的中国城市房地产泡沫的空间传染性分析: 以2006-2014年35个大中城市为例. 长江流域资源与环境, 2018, 27(9):1967-1976.
[
|
| [17] |
杨晃, 杨朝军. 基于房价收入比的中国城市住宅不动产泡沫测度研究. 软科学, 2015, 29(4):119-123.
[
|
| [18] |
王洋, 王德利, 刘丽华, 等. 中国城市住宅价格的空间分化及其土地市场影响. 中国土地科学, 2015, 29(6):33-40.
[
|
| [19] |
黄杏子. 我国居民收入分配格局现状及其演变趋势分析. 改革与战略, 2019, 35(10):66-75.
[
|
| [20] |
黄禹铭. 中国城市住房价格增长的空间差异及其影响机制. 经济地理, 2019, 39(12):88-95.
[
|
| [21] |
王芳, 高晓路, 颜秉秋. 基于住宅价格的北京城市空间结构研究. 地理科学进展, 2014, 33(10):1322-1331.
[
|
| [22] |
刘海猛, 石培基, 潘竟虎, 等. 中国城镇房价收入比时空演变的多尺度分析. 地理科学, 2015, 35(10):1280-1287.
[
|
| [23] |
王洋, 方创琳, 盛长元. 扬州市住宅价格的空间分异与模式演变. 地理学报, 2013, 68(8):1082-1096.
[
|
| [24] |
范超, 王雪琪. 我国35个大中城市房价: 持久收入比研究. 统计研究, 2016, 33(8):95-100.
[
|
| [25] |
张莉, 何晶, 马润泓. 房价如何影响劳动力流动. 经济研究, 2017, 52(8):155-170.
[
|
| [26] |
胡颖之, 袁宇菲. 中国住宅销售价格对居民消费的影响. 经济学, 2017, 16(3):1031-1050.
[
|
| [27] |
张传勇, 张永岳, 武霁. 房价波动存在收入分配效应吗: 一个家庭资产结构的视角. 金融研究, 2014, (12):86-101.
[
|
| [28] |
李辉, 王良健. 房价、房价收入比与流动人口长期居留意愿: 来自流动人口的微观证据. 经济地理, 2019, 39(6):86-96.
[
|
| [29] |
黄燕芬, 张志开, 唐将伟. 京津冀城市群住房价格波动溢出效应: 基于单中心理论视角下的分析. 价格理论与实践, 2018,(11):30-33.
[
|
| [30] |
龚健, 栾君, 王文婷, 等. 长三角城市群住宅价格的空间传导路径. 经济地理, 2017, 37(7):90-98.
[
|
| [31] |
曾祥渭, 刘志东, 刘雯宇. 我国城市群商品住宅价格传导与波动性外溢研究. 管理评论, 2015, 27(9):3-13.
[
|
| [32] |
王洋, 王德利, 王少剑. 中国城市住宅价格的空间分异格局及影响因素. 地理科学, 2013, 33(10):1157-1165.
[
|
| [33] |
付占辉, 梅林, 刘艳军, 等. 东北三省城乡收入差距空间格局及其分异机制研究. 地理科学, 2019, 39(9):1473-1483.
[
|
| [34] |
宋伟轩, 陈艳如, 孙洁, 等. 长三角一体化区域城市房价空间分异的模式与效应研究. 地理学报, 2020, 75(10):2109-2125.
[
|
| [35] |
方晓萍, 丁四保. 中国城市住房价格的地理扩散及其区域外部性问题. 地理科学, 2012, 32(2):143-148.
[
|
| [36] |
杨建云. 房价收入比分布规律及分析:基于河南省与全国数据对比. 地域研究与开发, 2016, 35(4):63-67.
[
|
| [37] |
|
| [38] |
李雪铭, 朱健亮, 王勇. 居住小区容积率空间差异: 以大连市为例. 地理科学进展, 2015, 34(6):687-695.
[
|
| [39] |
陈培阳, 朱喜钢. 中国区域经济趋同: 基于县级尺度的空间马尔可夫链分析. 地理科学, 2013, 33(11):1302-1308.
[
|
| [40] |
侯孟阳, 姚顺波. 1978-2016年中国农业生态效率时空演变及趋势预测. 地理学报, 2018, 73(11):2168-2183.
[
|
| [41] |
王少剑, 黄永源. 中国城市碳排放强度的空间溢出效应及驱动因素. 地理学报, 2019, 74(6):1131-1148.
[
|
| [42] |
薛亮, 任志远. 基于空间马尔科夫链的关中地区生态安全时空演变分析. 生态环境学报, 2011, 20(1):114-118.
[
|
| [43] |
|
| [44] |
孙倩, 汤放华. 基于空间扩展模型和地理加权回归模型的城市住房价格空间分异比较. 地理研究, 2015, 34(7):1343-1351.
[
|
| [45] |
|
| [46] |
|
| [47] |
张谦, 王成璋, 王章名. 中国城市住房价格的空间效应与滞后效应研究. 统计研究, 2016, 33(7):38-45.
[
|
| [48] |
陈艳如, 宋伟轩, 尹上岗, 等. 长三角一体化区域城市房价收入比时空分异格局研究. 经济地理, 2020, 40(12):32-39.
[
|
| [49] |
尹上岗, 杨山, 陈艳如, 等. 长三角房价收入比时空演变格局及收敛研究. 地理研究, 2020, 39(11):2521-2536.
[
|
/
| 〈 |
|
〉 |
