
基于地理学综合视角的胡焕庸线IPCC复合情景(SSPs-RCPs)模拟和预测
|
夏海斌(1979-),男,上海人,博士,副研究员,研究方向为人地关系与可持续发展、人口地理学。E-mail: hbxia@geo.ecnu.edu.cn |
收稿日期: 2020-09-03
要求修回日期: 2021-08-16
网络出版日期: 2021-12-10
基金资助
国家重点研发计划项目(2017YFE0100700)
国家社会科学基金项目(20BRK022)
上海市自然科学基金(19ZR1415200)
中国科学院学部咨询评议项目(二期)
版权
Hu Huanyong Line based on geographical synthesis: Simulation and prediction under SSPs-RCPs scenario matrix
Received date: 2020-09-03
Request revised date: 2021-08-16
Online published: 2021-12-10
Copyright
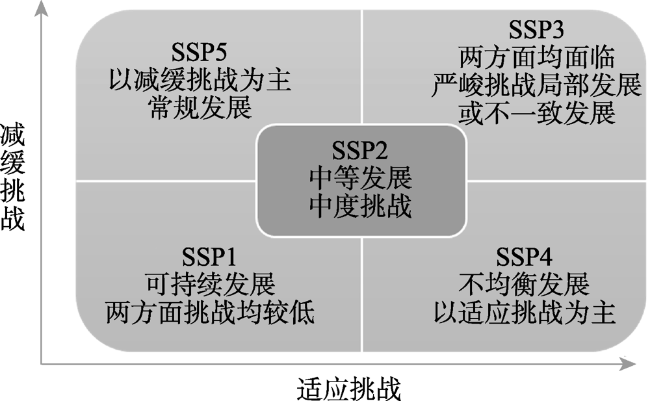
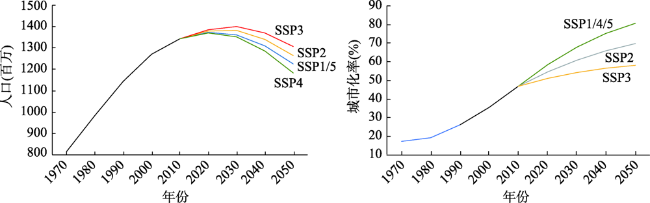
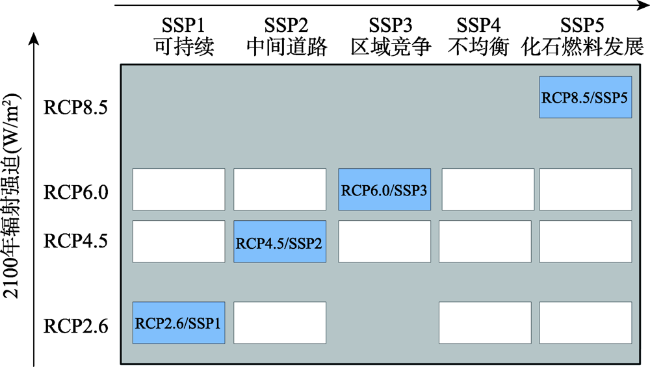
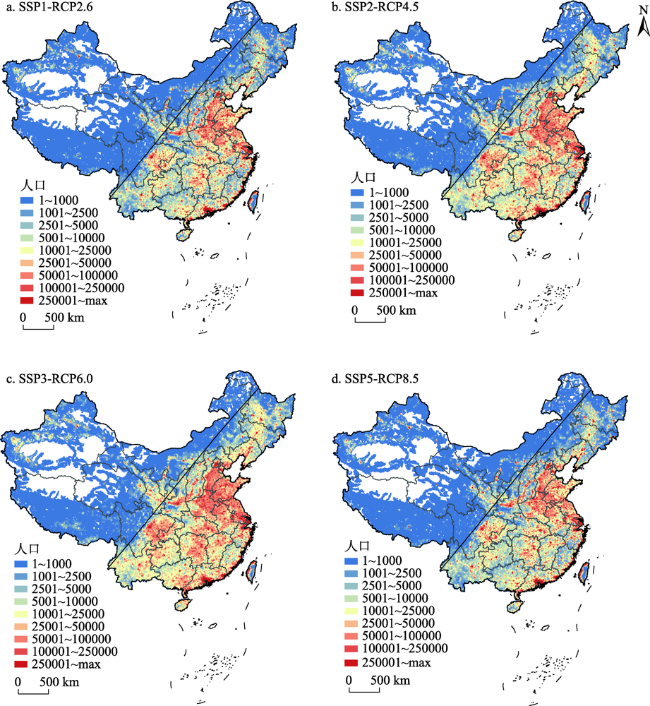
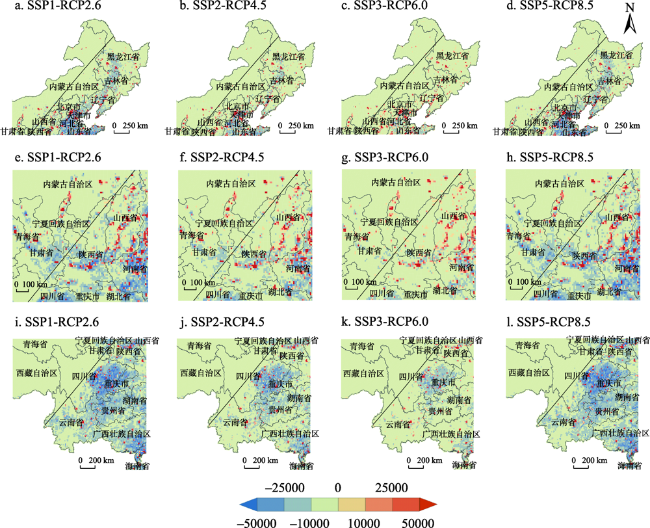
胡焕庸线(简称胡线)是重要的人口分界线,更是一条展现中国自然与人文地理综合视角下的国情分界线。通过构建环境因素影响下的人口潜力模型,结合四组气候系统模式驱动下的作物模型和水文模型,模拟共享社会经济路径(SSPs)和代表性浓度路径(RCPs)复合情景下中国未来近期(2030年)和中期(2050年)人口时空变化趋势。发现:① SSPs情景下中国未来胡焕庸线东西两侧人口比重差距将进一步拉大,而在考虑SSPs-RCPs的复合情景下,胡焕庸线东西两侧人口比重的差距比仅考虑SSPs情景时要有所缩小。前者的原因是胡线东侧地区城市规模和等级远高于胡线西侧地区,在中国人口城市化大背景下,胡线东侧人口占比相对提升。而后者原因是受气候变化影响,胡焕庸线西侧地区的水热条件变化较之东侧有利,从而更进一步提高了人口的环境承载力。② 中国的社会经济发展对胡焕庸线两侧人口比重的影响要远大于气候变化的影响。③ 从胡焕庸的北、中、南三段区域来探讨胡焕庸线突破的可能性,胡线中段区域由于黄河等河流流经区域有较好的水资源条件,有利于推进该区域的城镇化建设,成为人口向胡焕庸线以西迁移的突破口。
夏海斌 , 刘敏 . 基于地理学综合视角的胡焕庸线IPCC复合情景(SSPs-RCPs)模拟和预测[J]. 地理研究, 2021 , 40(10) : 2838 -2855 . DOI: 10.11821/dlyj020200840
In this paper, a population potential model under the influence of environmental factors is constructed, and four sets of the crop model and water model driven by climate system models are combined to simulate the spatiotemporal evolution trend of China's population in the near (2030) and medium (2050) periods under SSPs-RCPs scenario matrix. It is found that under the SSPs scenario, the gap between population proportions on the east and west sides of Hu Huanyong Line (also known as Hu Line) in China will be further enlarged in the future, while under the scenario of SSP-RCPS, the population proportion gap on both sides of the Hu Line will be somewhat narrowed compared with the SSP scenario alone. The reason for the former is that the urbanization development on the east side of the Hu Line is much higher than that on the west side. Under the background of population urbanization in China, the population on the east side of the Hu Line increases. The latter is due to the favorable change of hydrothermal conditions on the west side of the Hu Line under the influence of climate change, which further improves the environmental carrying capacity of the population. The impact of social and economic development on change of population proportion on both sides of the Hu Line is far greater than the impact of climate change. This paper aims to explore the possibility of the breakthrough of the Hu Line from north, middle and south sections. We believe that the middle section will act as the breakthrough point because the region where Yellow River and other rivers flow through have rich water resources, which is favorable to the development of urbanization.
表1 全球气候模式驱动下的水文模型和作物模型Tab. 1 Hydrological models and crop models driven by global climate model (GCM) |
| 组别 | 全球气候模式 | 水文模型 | 作物模型 |
|---|---|---|---|
| 1 | HadGEM2-ES | LPJmL | LPJmL |
| 2 | IPSL-CM5A-LR | LPJmL | LPJmL |
| 3 | HadGEM2-ES | GEPIC | WaterGAP |
| 4 | IPSL-CM5A-LR | GEPIC | WaterGAP |
表2 中国未来近中期(2030年、2050年)SSPs-RCPs复合情景下胡焕庸线两侧人口密度及人口比重比较Tab. 2 Comparison of population density and population proportion on both sides of Hu Line under the SSPs-RCPs scenario matrix in 2030 and 2050 |
| SSPs情景 | 胡焕庸线东侧 | 胡焕庸线西侧 | SSPs-RCPs情景 | 胡焕庸线东侧 | 胡焕庸线西侧 | 胡焕庸线 东侧比重 变化 | 胡焕庸线 西侧比重 变化 | |||||||
|---|---|---|---|---|---|---|---|---|---|---|---|---|---|---|
| 人口比重(%) | 人口密度 (人/km2) | 人口比重 (%) | 人口密度 (人/km2) | 人口比重 (%) | 人口密度 (人/km2) | 人口比重 (%) | 人口密度 (人/km2) | |||||||
| 2000年 | 94.21 | 285.18 | 5.79 | 14.18 | 94.21 | 285.18 | 5.79 | 14.18 | ||||||
| 2010年 | 93.99 | 300.19 | 6.01 | 15.54 | 93.99 | 300.19 | 6.01 | 15.54 | ||||||
| 2030年 | SSP1 | 94.53 | 303.19 | 5.47 | 14.21 | SSP1-RCP2.6 | 94.52 | 303.15 | 5.48 | 14.24 | -0.01 | 0.01 | ||
| SSP2 | 94.36 | 307.37 | 5.64 | 14.87 | SSP2-RCP4.5 | 94.35 | 307.34 | 5.65 | 14.89 | -0.01 | 0.01 | |||
| SSP3 | 94.21 | 310.91 | 5.79 | 15.49 | SSP3-RCP6.0 | 94.2 | 310.88 | 5.8 | 15.51 | -0.01 | 0.01 | |||
| SSP5 | 94.53 | 303.19 | 5.47 | 14.21 | SSP5-RCP8.5 | 94.51 | 303.14 | 5.49 | 14.25 | -0.02 | 0.02 | |||
| 2050年 | SSP1 | 94.82 | 273.92 | 5.18 | 12.12 | SSP1-RCP2.6 | 94.80 | 273.84 | 5.20 | 12.19 | -0.02 | 0.02 | ||
| SSP2 | 94.56 | 281.8 | 5.44 | 13.12 | SSP2-RCP4.5 | 94.55 | 281.75 | 5.45 | 13.16 | -0.01 | 0.01 | |||
| SSP3 | 94.29 | 290.86 | 5.71 | 14.26 | SSP3-RCP6.0 | 94.28 | 290.82 | 5.72 | 14.29 | -0.01 | 0.01 | |||
| SSP5 | 94.82 | 273.92 | 5.18 | 12.12 | SSP5-RCP8.5 | 94.79 | 273.83 | 5.21 | 12.2 | -0.03 | 0.03 | |||
真诚感谢匿名评审专家在论文评审中所付出的时间和精力,评审专家对气候变化复合情景选取、各复合情景的结果分析、结论梳理和政策建议方面的修改意见,使本文获益匪浅。
| [1] |
陆大道, 王铮, 封志明, 等. 关于“胡焕庸线能否突破”的学术争鸣. 地理研究, 2016, 35(5):805-824.
[
|
| [2] |
胡焕庸. 中国人口之分布: 附统计表与密度图. 地理学报, 1935. 2(2):33-74.
[
|
| [3] |
丁金宏, 何书金. 中国人口地理格局与城市化未来: 纪念胡焕庸线发现80周年学术研讨会在上海举行. 地理学报, 2015. 70(12):1856.
[
|
| [4] |
陈明星, 李扬, 龚颖华, 等. 胡焕庸线两侧的人口分布与城镇化格局趋势: 尝试回答李克强总理之问. 地理学报, 2016, 12(2):179-193.
[
|
| [5] |
戚伟, 刘盛和, 赵美风. “胡焕庸线”的稳定性及其两侧人口集疏模式差异. 地理学报, 2015, 12(4):551-566.
[
|
| [6] |
葛美玲, 封志明. 基于GIS的中国2000年人口之分布格局研究: 兼与胡焕庸1935年之研究对比. 人口研究, 2008, 12(1):51-57.
[
|
| [7] |
王铮, 夏海斌, 田园, 等. 胡焕庸线存在性的大数据分析: 中国人口分布特征的生态学及新经济地理学认识. 生态学报, 2019, 39(14):5166-5177.
[
|
| [8] |
王开泳, 邓羽. 新型城镇化能否突破“胡焕庸线”: 兼论“胡焕庸线”的地理学内涵. 地理研究, 2016, 12(5):825-835.
[
|
| [9] |
郭华东, 王心源, 吴炳方, 等. 基于空间信息认知人口密度分界线: “胡焕庸线”. 中国科学院院刊, 2016. 31(12):1385-1394.
[
|
| [10] |
封志明, 唐焰, 杨艳昭, 等. 中国地形起伏度及其与人口分布的相关性. 地理学报, 2007, 12(10):1073-1082.
[
|
| [11] |
董春, 刘纪平, 赵荣, 等. 地理因子与空间人口分布的相关性研究. 遥感信息, 2002, 12(4):61-64.
[
|
| [12] |
吴传钧. 胡焕庸大师对发展中国地理学的贡献. 人文地理, 2001, 12(5):1-4.
[
|
| [13] |
吴传钧. 人地关系地域系统的理论研究及调控. 云南师范大学学报: 哲学社会科学版, 2008, 12(2):1-3.
[
|
| [14] |
|
| [15] |
|
| [16] |
丁金宏, 黄晨熹, 孙中锋. 利用土地人口容力开放模型对沪苏锡常城市群的分析. 中国人口·资源与环境, 1998, 12(4):41-46.
[DingJinhong,
|
| [17] |
|
| [18] |
|
| [19] |
|
| [20] |
|
| [21] |
|
| [22] |
潘家华, 郑艳. 气候移民概念辨析及政策含义: 兼论宁夏生态移民政策. 中国软科学, 2014, 12(1):78-86.
[
|
| [23] |
|
| [24] |
|
| [25] |
|
| [26] |
|
| [27] |
|
| [28] |
IPCC. Summary for policymakers, in climate change 2013: The physical science basis. In: T F Stocker, et al. Contribution of Working Group I to the Fifth Assessment Report of the Intergovernmental Panel on Climate Change. Cambridge: Cambridge University Press, 2013: 1-30.
|
| [29] |
|
| [30] |
|
| [31] |
|
| [32] |
姜彤, 赵晶, 景丞, 等. IPCC共享社会经济路径下中国和分省人口变化预估. 气候变化研究进展, 2017, 13(2):128-137.
[
|
| [33] |
|
| [34] |
|
| [35] |
|
| [36] |
|
| [37] |
|
| [38] |
王铮, 乐群, 夏海斌, 等. 中国2050: 气候情景与胡焕庸线的稳定性. 中国科学: 地球科学, 2016. 46(11):1505-1514.
[
|
| [39] |
|
| [40] |
夏军, 邱冰, 潘兴瑶, 等. 气候变化影响下水资源脆弱性评估方法及其应用. 地球科学进展, 2012, 27(4) : 443-451.
[
|
| [41] |
|
| [42] |
|
| [43] |
|
| [44] |
IPCC. Climate change 2013: The physical science basis. IPCC. Contribution of Working Group I to the Fifth Assessment Report of the Intergovernmental Panel on Climate Change. Cambridge: Cambridge University Press, 2013: 1535.
|
| [45] |
|
| [46] |
|
| [47] |
|
| [48] |
|
| [49] |
|
| [50] |
|
| [51] |
|
| [52] |
|
| [53] |
|
| [54] |
|
| [55] |
|
| [56] |
|
| [57] |
王铮. 理论经济地理学. 北京: 高等教育出版社, 2006.
[Wang Zheng. Theoretical Economic Geography. Beijing: Higher Education Press, 2006.]
|
| [58] |
|
| [59] |
杨云彦. 中国人口迁移与发展的长期战略. 武汉: 武汉出版社, 1994.
[
|
| [60] |
|
| [61] |
|
| [62] |
|
| [63] |
|
| [64] |
|
| [65] |
|
/
| 〈 |
|
〉 |