
中蒙俄经济走廊土地利用变化格局及其驱动因素研究
|
厉静文(1994-),女,山东日照人,博士研究生,主要研究方向为区域生态经济学和环境经济学。E-mail: lijw.20b@igsnrr.ac.cn |
收稿日期: 2021-09-18
录用日期: 2021-11-10
网络出版日期: 2022-01-10
基金资助
科技部国家科技基础资源调查专项(2017FY100304)
中国科学院战略性先导科技专项(A 类)课题(XDA20030203)
国家社会科学基金“一带一路”专项基金(17VDL016)
“一带一路”国际科学组织联 盟联合研究合作专项(ANSO-CR-KP-2020-02)
版权
The pattern and driving factors of land use change in the China-Mongolia-Russia economic corridor
Received date: 2021-09-18
Accepted date: 2021-11-10
Online published: 2022-01-10
Copyright
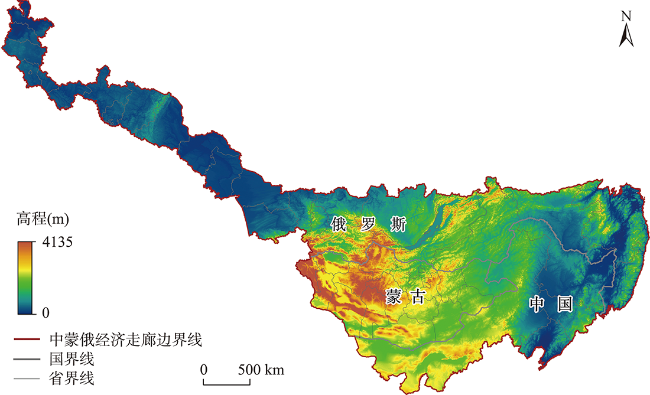
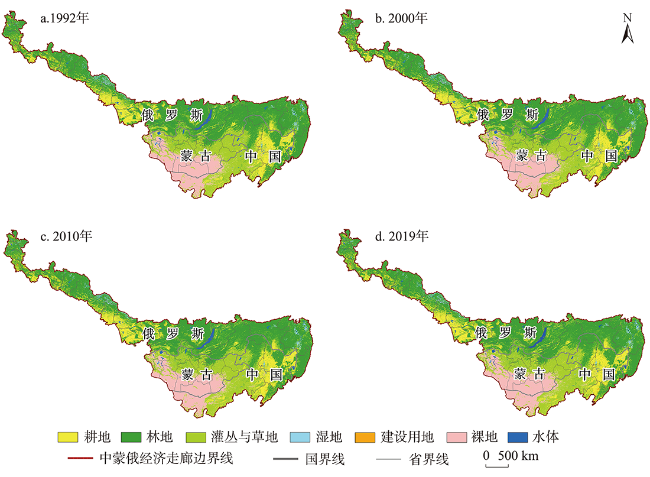
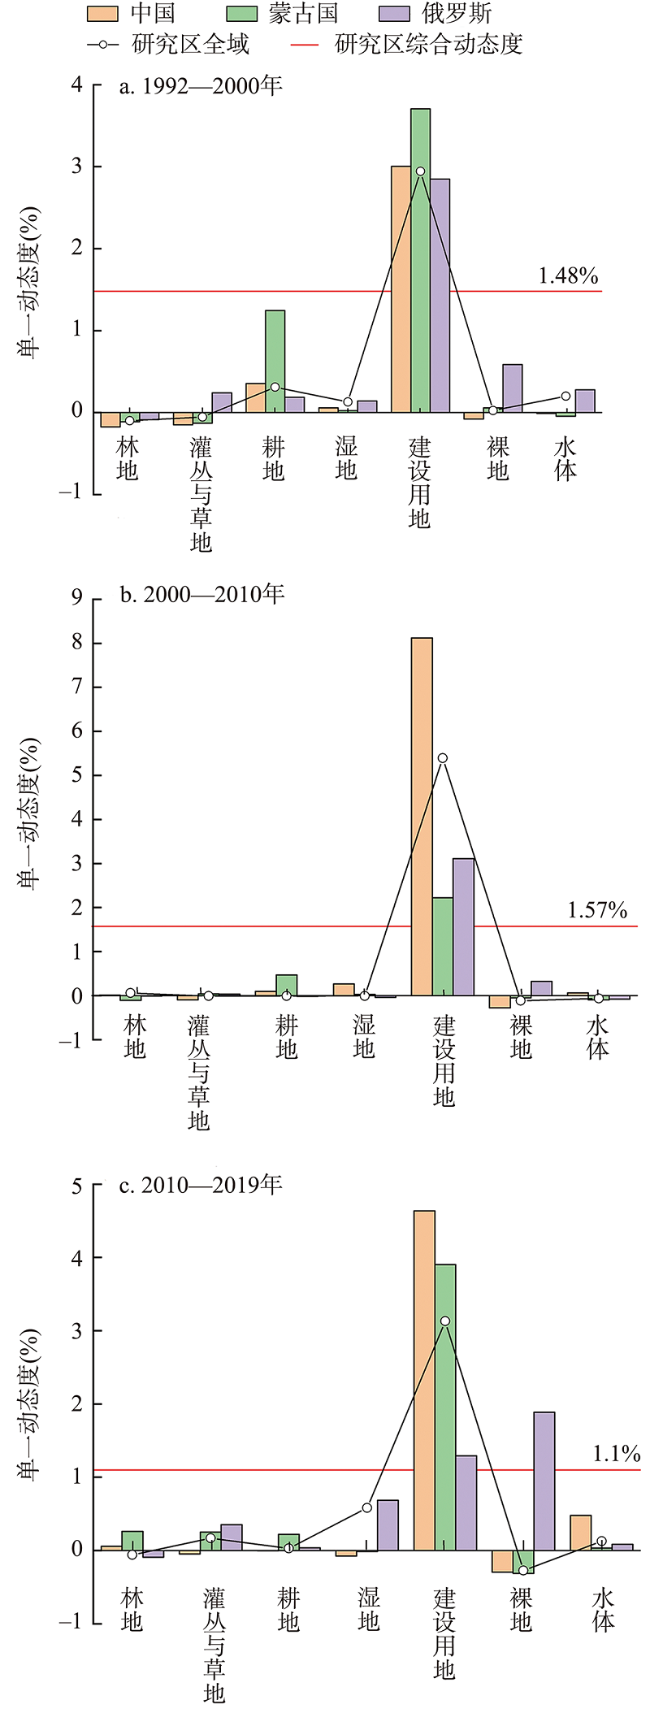
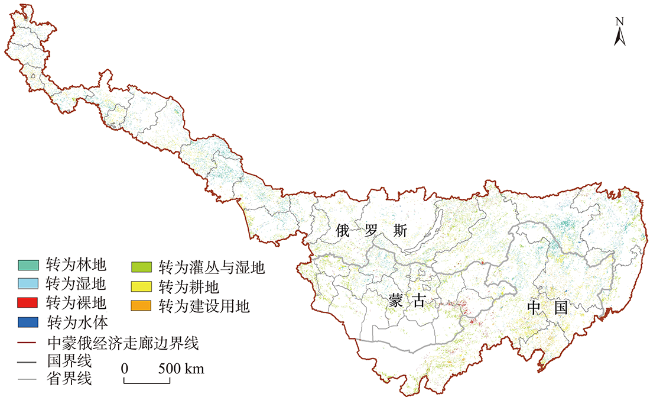
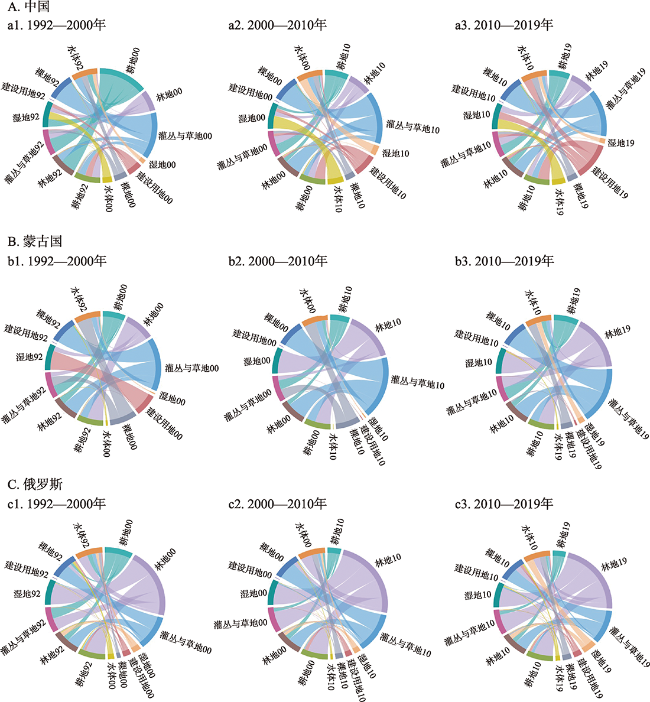
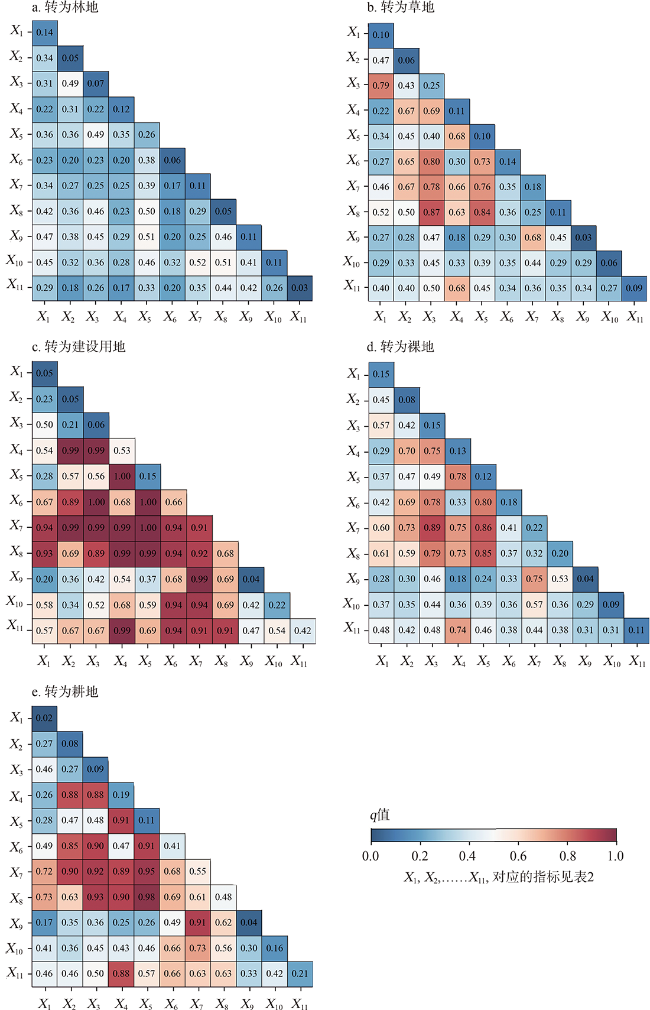
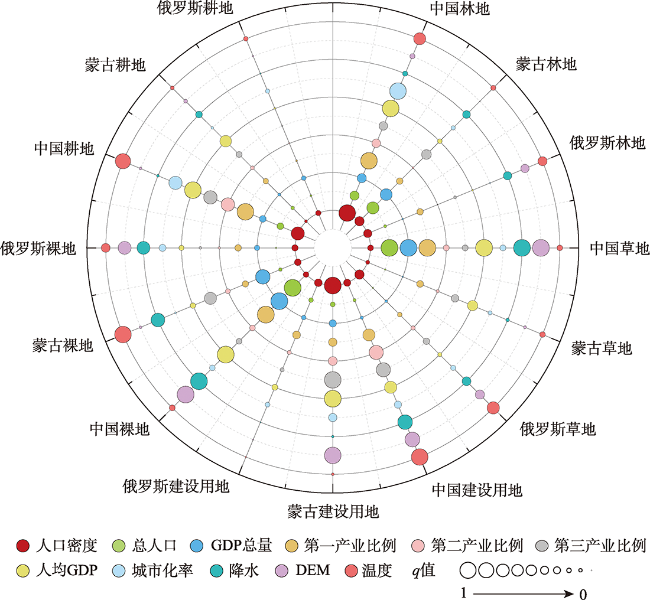
中蒙俄经济走廊战略地位显著,研究其土地利用格局变化与机理,对亚欧大陆复杂巨系统的生态环境保护和社会经济可持续发展意义重大。本文基于全球土地覆盖遥感数据和实地考察,对自苏联解体及蒙古私有化以来的1992—2019年,中蒙俄经济走廊土地利用格局及其驱动因素和时空变化规律进行了研究。结果表明:①1992—2019年,中蒙俄经济走廊土地利用变化活跃,土地转换面积为361954 km2,主要表现为林地持续下降,建设用地、耕地面积迅速扩张。② 中国部分的林地呈现先减后增的趋势,2000年后东北平原北部林地增加显著,灌丛与草地、裸地分别净减少13325 km2、16632km2;蒙古国部分的林地、灌丛与草地均呈现先减后增的趋势,而裸地面积先增后减,苏赫巴托尔省、肯特省、东戈壁省和戈壁苏木贝尔省四省交界地带裸地增加明显;俄罗斯部分的林地持续下降,共减少46742 km2,耕地面积增加8478 km2,贝加尔湖周边裸地增加41417 km2;俄蒙边境、色楞格河流域以及中蒙俄铁路沿线地区存在沙漠化风险。③ 人口、经济、产业结构以及政策等是中蒙俄经济走廊土地利用变化的主要因素。2010—2018年,人口密度对转为林地的土地影响最大,其解释力q值为0.2597,GDP总量对转为建设用地、裸地、耕地的影响最大,其解释力q值分别为0.9094、0.2234、0.5518。就三国而言,中国部分主要受人口和经济因素以及退耕还林政策的影响,而蒙古国部分则受私有化后超载过牧及开垦耕地的影响,俄罗斯部分主要是砍伐林地和开垦耕地的影响。本研究结果旨在为中蒙俄经济走廊土地资源可持续利用和管理提供科学依据。
厉静文 , 董锁成 , 李宇 , 杨洋 , Boldanov Tamir . 中蒙俄经济走廊土地利用变化格局及其驱动因素研究[J]. 地理研究, 2021 , 40(11) : 3073 -3091 . DOI: 10.11821/dlyj020210860
The China-Mongolia-Russia economic corridor has a significant strategic position. Based on global land cover remote sensing data and field investigations, this paper studied the land use pattern, driving factors and spatio-temporal changes of the China-Mongolia-Russia economic corridor from 1992 to 2019 since the disintegration of the Soviet Union and the privatization policy of Mongolia. The results showed that: (1) From 1992 to 2019, the land use change of China-Mongolia-Russia economic corridor was active, and the converted land area was 361953 km2, which was mainly manifested by the continuous decline of forest land and the rapid expansion of construction land and cultivated land. (2) The forest land in China decreased at first and then increased. After 2000, the forest in the north part of Northeast China Plain increased significantly. The area of shrubland and grassland, and bare land in China decreased by 13325 km2 and 16632 km2, respectively. The shrubland and grassland in Mongolia decreased at first and then increased, and the bare land increased at first and then decreased. The turning point was the year 2000. And the bare land in the border area of provinces of Sukhbaatar, Khentii, Dornogovi and Govi-Altai increased significantly. The area of forest land in Russia continued to decline, with a total decrease of 46742 km2 and the cultivated land increased by 8478 km2, and the bare land around Lake Baikal increased by 41417 km2. There was a risk of desertification in the Russian-Mongolian border, Selenge River Basin and areas along the China-Mongolia-Russia railway. (3) Population, economy, industrial structure and policy were the main factors of land use change in China-Mongolia-Russia economic corridor. From 2010 to 2018, the population density had the greatest influence on the land converted to forest land, and the explanatory power of q value was 0.2597. The total GDP had the greatest influence on the conversion to construction land, bare land and cultivated land, and their explanatory power of q value was 0.9094, 0.2234 and 0.5518, respectively. China was mainly affected by demographic and economic factors and the policy of returning farmland to forest land. Mongolia was affected by overgrazing and cultivated land expansion after privatization. Russia was mainly affected by deforestation and cultivated land reclamation. The results can provide a scientific basis for the sustainable utilization and management of land resources in the China-Mongolia-Russia economic corridor.
表1 1992—2019年中蒙俄经济走廊土地利用面积Tab. 1 Land use area of the China-Mongolia-Russia economic corridor from 1992 to 2019 |
| 1992年 | 2000年 | 2010年 | 2019年 | ||||||||
|---|---|---|---|---|---|---|---|---|---|---|---|
| 面积(km2) | 占比(%) | 面积(km2) | 占比(%) | 面积(km2) | 占比(%) | 面积(km2) | 占比(%) | ||||
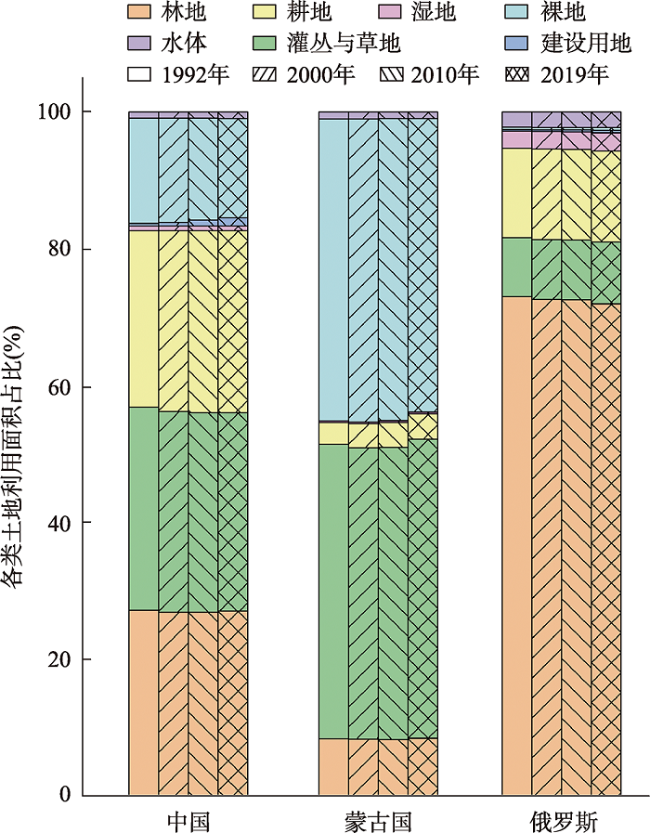
| 林地 | 3777361 | 48.61 | 3751088 | 48.27 | 3747864 | 48.23 | 3728258 | 47.97 | |||
| 灌丛与草地 | 1612510 | 20.75 | 1606489 | 20.67 | 1605068 | 20.65 | 1629545 | 20.97 | |||
| 耕地 | 1108854 | 14.27 | 1133007 | 14.58 | 1138856 | 14.65 | 1141800 | 14.69 | |||
| 湿地 | 124040 | 1.60 | 125172 | 1.61 | 125092 | 1.61 | 131629 | 1.69 | |||
| 建设用地 | 16991 | 0.22 | 20490 | 0.26 | 30430 | 0.39 | 39001 | 0.50 | |||
| 裸地 | 1002861 | 12.90 | 1004564 | 12.93 | 994280 | 12.79 | 969853 | 12.48 | |||
| 水体 | 128781 | 1.66 | 130588 | 1.68 | 129806 | 1.67 | 131310 | 1.69 | |||
表2 2010—2018年中蒙俄经济走廊土地利用变化驱动因子解释力Tab. 2 Explanation of driving factors of land use change in the China-Mongolia-Russia economic corridor from 2010 to 2018 |
| 驱动因子 | 转为林地( ) | 转为草地( ) | 转为建设用地( ) | 转为裸地( ) | 转为耕地( ) |
|---|---|---|---|---|---|
| 年平均气温( ) | 0.1403 | 0.0989 | 0.0452 | 0.1477 | 0.0188 |
| 年降水量( ) | 0.0476 | 0.0588 | 0.0480 | 0.0776 | 0.0840 |
| DEM( ) | 0.0705 | 0.2505 | 0.0631 | 0.1463 | 0.0866 |
| 总人口( ) | 0.1201 | 0.1085 | 0.5266 | 0.1313 | 0.1932 |
| 人口密度( ) | 0.2597 | 0.0959 | 0.1509 | 0.1223 | 0.1067 |
| 城市化率( ) | 0.0569 | 0.1383 | 0.6642 | 0.1790 | 0.4120 |
| GDP总量( ) | 0.1061 | 0.1810 | 0.9094 | 0.2234 | 0.5518 |
| 人均GDP( ) | 0.0492 | 0.1104 | 0.6762 | 0.2010 | 0.4842 |
| 第一产业比例( ) | 0.1134 | 0.0318 | 0.0356 | 0.0426 | 0.0355 |
| 第二产业比例( ) | 0.1140 | 0.0572 | 0.2218 | 0.0887 | 0.1619 |
| 第三产业比例( ) | 0.0252 | 0.0943 | 0.4163 | 0.1070 | 0.2092 |
真诚感谢二位匿名评审专家在论文评审中所付出的时间和精力,评审专家对本文土地利用变化驱动因素的指标选取、中蒙俄跨境合作区土地利用变化的分析、结论梳理方面的修改意见,使本文获益匪浅。
| [1] |
|
| [2] |
|
| [3] |
|
| [4] |
刘超, 许月卿, 卢新海. 生态脆弱贫困区土地利用多功能权衡/协同格局演变与优化分区: 以张家口市为例. 经济地理, 2021, 41(1): 181-190.
[
|
| [5] |
刘金巍, 靳甜甜, 刘国华, 等. 新疆玛纳斯河流域2000-2010年土地利用/覆盖变化及影响因素. 生态学报, 2014, 34(12): 3211-3223.
[
|
| [6] |
|
| [7] |
刘少坤, 林树高, 王嘉佳, 等. 1980 -2018年中越边境带广西段土地利用变化及驱动力. 水土保持通报, 2021, 41(1): 290-299+326.
[
|
| [8] |
|
| [9] |
李进涛, 刘彦随, 杨园园, 等. 1985-2015年京津冀地区城市建设用地时空演变特征及驱动因素研究. 地理研究, 2018, 37(1): 37-52.
[
|
| [10] |
张佰发, 苗长虹. 黄河流域土地利用时空格局演变及驱动力. 资源科学, 2020, 42(3): 460-473.
[
|
| [11] |
|
| [12] |
董锁成, 李懿珈, 李富佳, 等. 中蒙俄经济走廊交通及管线建设的生态风险区划及对策研究. 中国科学院院刊, 2021, 36(2): 141-149.
[
|
| [13] |
|
| [14] |
刘丹, 璩路路, 李琳娜. 黑龙江北部边境样带土地利用时空变化特征及其驱动因素. 北京师范大学学报(自然科学版), 2021, 57(3): 417-423.
[
|
| [15] |
|
| [16] |
王宁, 杨光, 韩雪莹, 等. 内蒙古1990-2018年土地利用变化及生态系统服务价值. 水土保持学报, 2020, 34(5): 244-250.
[
034.
|
| [17] |
|
| [18] |
|
| [19] |
|
| [20] |
范泽孟, 李赛博. 中蒙俄经济走廊荒漠化时空格局变化及其驱动因子. 生态学报, 2020, 40(13): 4252-4263.
[
|
| [21] |
|
| [22] |
|
| [23] |
李丽, 刘诗奇, 王平, 等. 基于负载指数的中蒙俄经济走廊水资源开发潜力评价. 干旱区研究, 2021, 38(4): 910-918.
[
|
| [24] |
|
| [25] |
|
| [26] |
|
| [27] |
孙立群, 李晴岚, 陈骥, 等. 欧亚大陆不同生态区植被生长对降水响应的季节变化规律. 生态学报, 2018, 38(22): 8051-8059.
[
|
| [28] |
吴浩, 王秀, 周宏浩, 等. 东北三省资源型收缩城市经济效率与生计脆弱性的时空分异与协调演化特征. 地理科学, 2019, 39(12): 1962-1971.
[
|
| [29] |
杨学峰. 试析吉林省与俄罗斯东西伯利亚及远东地区的林业合作. 俄罗斯中亚东欧市场, 2005,(6): 34-40.
[
|
| [30] |
|
| [31] |
|
| [32] |
杜婷, 焦继宗, 段含明, 等. 中国科学院土地利用分类系统与IGBP分类系统的转换研究: 以西北农牧交错带为例. 兰州大学学报(自然科学版), 2020, 56(1): 90-95.
[
|
| [33] |
|
| [34] |
|
| [35] |
中国国家统计局. 2019 中国统计年鉴. 北京: 中国统计出版社, 2019.
[China National Bureau of Statistics. 2019 China Statistical Yearbook. Beijing: China Statistics Press, 2019.]
|
| [36] |
蒙古国家统计局. 2019 蒙古统计年鉴. (2020-12-29) [2021-06-22]. http://en.nso.mn.
[Mongolian National Bureau of Statistics. 2019 Mongolia Statistical Yearbook. (2020-12-29) [2021-06-22]. http://en.nso.mn.]
|
| [37] |
俄罗斯联邦统计局. 2019 俄罗斯联邦统计年鉴. (2020-01-29) [2021-06-23]. https://eng.gks.ru.
[Russian National Bureau of Statistics. 2019 Russian Statistical Yearbook. (2020-01-29) [2021-06-23]. https://eng.gks.ru.]
|
| [38] |
|
| [39] |
王劲峰, 徐成东. 地理探测器:原理与展望. 地理学报, 2017, 72(1): 116-134.
[
|
| [40] |
|
| [41] |
|
| [42] |
刘纪远, 匡文慧, 张增祥, 等. 20世纪80年代末以来中国土地利用变化的基本特征与空间格局. 地理学报, 2014, 69(1): 3-14.
[
|
| [43] |
|
| [44] |
徐新良, 李嘉豪, 申志成, 等. “一带一路”沿线国家农田生态系统脆弱性及其对气候变化的响应. 地球信息科学学报, 2020, 22(4): 877-886.
[
|
| [45] |
|
/
| 〈 |
|
〉 |