
区域经济增长驱动因素与空间溢出效应的对比研究
|
闫东升(1990-),男,河南项城人,博士,讲师,主要研究方向为区域发展与规划。E-mail: yds1223@163.com |
收稿日期: 2020-08-07
录用日期: 2020-11-30
网络出版日期: 2022-01-10
基金资助
国家自然科学基金项目(41871209)
国家自然科学基金项目(42101183)
美丽中国生态文明建设科技工程专项(XDA23020102)
南京大学长江三角洲经济社会发展研究中心重大项目(CYD-2020018)
版权
A comparative study on the driving factors and spatial spillover effects of economic growth across different regions of China
Received date: 2020-08-07
Accepted date: 2020-11-30
Online published: 2022-01-10
Copyright
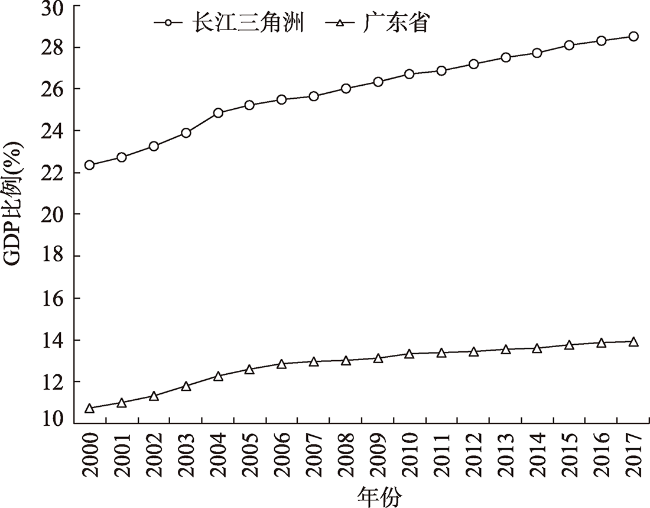
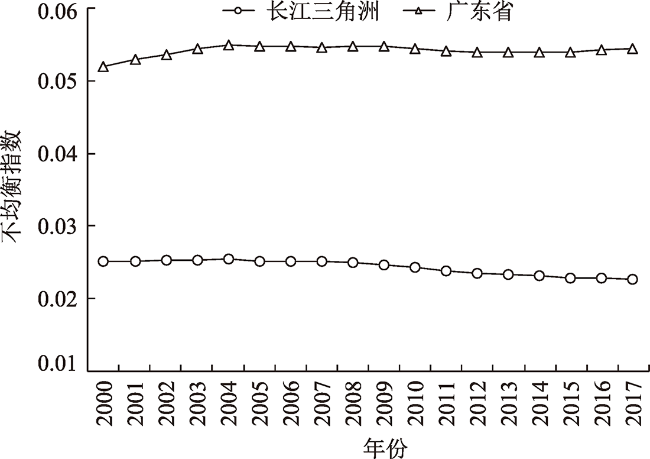
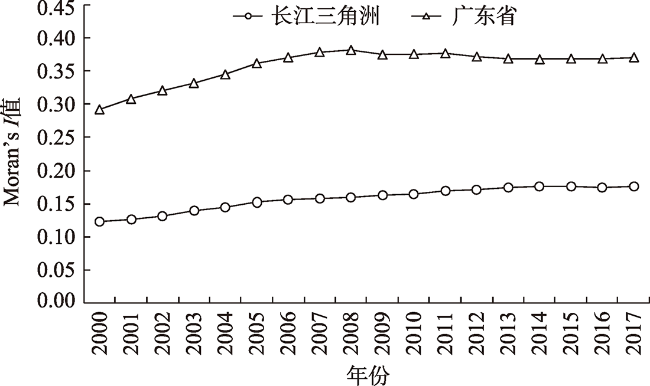
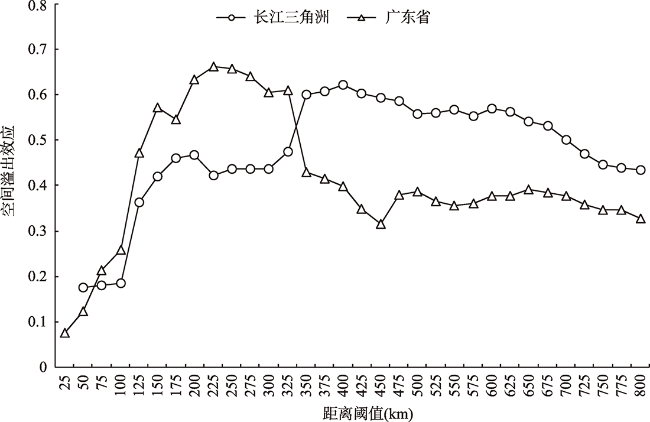
准确把握经济增长驱动因素与空间溢出效应,对于进一步理清城市相互关系、推动区域均衡发展具有重要的理论与实践意义。本文以长江三角洲、广东省为例,采用不均衡指数、地理集中度探析经济格局时空演变特征,并基于空间计量方法,对经济增长驱动因素与空间溢出效应进行对比研究。结果发现:① 21世纪以来,伴随着对全国经济增长贡献的稳步提升,研究区域经济格局也呈现差异化演变态势,但“核心-边缘”格局均未明显改变。② 空间计量结果表明,区域经济增长驱动因素存在显著差异,但经济增长均存在显著正向空间溢出效应,且长江三角洲空间溢出效应更强。③ 进一步的分解、对比表明,不同区域、不同时期经济增长驱动因素存在差异,空间溢出效应也表现为时间上的逐渐增强、空间上的核心区更强。基于距离变动的分析发现,研究区域经济增长空间溢出效应均呈现“倒U”型趋势。本研究有助于揭示研究区域城市间相互关系,也为推动区域一体化发展、合理引导城市群扩容等提供前瞻性参考。
闫东升 , 王玥 , 孙伟 , 李平星 . 区域经济增长驱动因素与空间溢出效应的对比研究[J]. 地理研究, 2021 , 40(11) : 3137 -3153 . DOI: 10.11821/dlyj020200740
During the 14th Five-Year Plan period (2021-2025), enhancing the radiation role of central cities and urban clusters will be an important measure to promote coordinated regional development. In this context, accurately exploring the driving factors of economic growth and spatial spillover effects is significantly important to understand relationships among cities and promote balanced regional development. Taking the Yangtze River Delta and Guangdong province as examples, we utilized the imbalance index and geographic concentration to explore the spatio-temporal evolution of the economic pattern, and compared the driving factors and spatial spillover effects of economic growth based on the spatial econometric model. The main conclusions can be drawn as follows: (1) Since the beginning of the 21st century, with the steady economic growth, the evolutions of the economic pattern of both study areas have presented differentiated characteristics, but the “core-edge” pattern of economic distribution showed strong stability. (2) The spatial econometric model results showed that there were significant differences in the driving factors of economic growth across different regions. Both study areas had significant positive spatial spillover effects of economic growth, but the spatial spillover effect in the Yangtze River Delta was stronger. (3) Further decomposition and comparison showed that there were differences in the driving factors of economic growth across different regions and periods in the study areas. The spatial spillover effects of both study areas’ economic growth were higher in 2009-2017 compared with 2000-2008, and the spatial spillover effects of the core area were higher than those of the marginal area. The spatial spillover effects based on the change of geographic distance presented an “inverted U” trend, and the distance with the strongest spatial spillover effect in the Yangtze River Delta was significantly greater than that in Guangdong province, but the latter had a higher maximum spillover effect. This research provides an empirical reference for understanding the relationship of cities. It also tries to provide a theoretical basis for formulating scientific policies in order to promote integrated development and narrow regional development gaps. The results in this paper may offer a forward-looking reference for the integrated development of other urban agglomerations, and reasonably guide the expansion of urban agglomerations.
Key words: economic growth; driving factor; spatial spillover effect; comparison
表1 2000—2017年长江三角洲城市经济集中度演变Tab. 1 The evolution of urban economic concentration in the Yangtze River Delta, 2000-2017 |
| 2000年 | 2004年 | 2017年 | 2000年 | 2004年 | 2017年 | 2000年 | 2004年 | 2017年 | |||
|---|---|---|---|---|---|---|---|---|---|---|---|
| 上海 | 11.742 | 11.597 | 9.642 | 台州 | 1.110 | 1.153 | 1.040 | 铜陵 | 0.368 | 0.367 | 0.462 |
| 无锡 | 4.012 | 4.266 | 4.437 | 扬州 | 1.101 | 1.075 | 1.306 | 宿迁 | 0.364 | 0.360 | 0.441 |
| 苏州 | 2.807 | 3.130 | 3.350 | 泰州 | 1.083 | 1.088 | 1.330 | 阜阳 | 0.317 | 0.231 | 0.241 |
| 南京 | 2.396 | 2.531 | 2.851 | 湖州 | 1.004 | 1.013 | 0.978 | 巢湖 | 0.312 | 0.280 | 0.271 |
| 嘉兴 | 2.138 | 2.298 | 2.170 | 芜湖 | 0.936 | 0.923 | 1.281 | 亳州 | 0.296 | 0.229 | 0.232 |
| 常州 | 2.123 | 2.209 | 2.507 | 徐州 | 0.886 | 0.878 | 1.059 | 滁州 | 0.295 | 0.233 | 0.258 |
| 宁波 | 1.853 | 1.962 | 1.783 | 金华 | 0.773 | 0.805 | 0.767 | 衢州 | 0.283 | 0.295 | 0.300 |
| 镇江 | 1.821 | 1.859 | 2.227 | 淮南 | 0.751 | 0.696 | 0.664 | 宿州 | 0.281 | 0.237 | 0.248 |
| 绍兴 | 1.457 | 1.512 | 1.348 | 合肥 | 0.714 | 0.824 | 1.244 | 安庆 | 0.254 | 0.221 | 0.231 |
| 南通 | 1.305 | 1.308 | 1.578 | 连云港 | 0.591 | 0.569 | 0.673 | 宣城 | 0.201 | 0.139 | 0.055 |
| 杭州 | 1.289 | 1.355 | 1.339 | 淮北 | 0.558 | 0.512 | 0.491 | 六安 | 0.176 | 0.152 | 0.157 |
| 舟山 | 1.225 | 1.304 | 1.532 | 盐城 | 0.501 | 0.494 | 0.591 | 黄山 | 0.128 | 0.117 | 0.115 |
| 马鞍山 | 1.158 | 1.258 | 1.537 | 淮安 | 0.449 | 0.440 | 0.533 | 丽水 | 0.122 | 0.131 | 0.128 |
| 温州 | 1.127 | 1.155 | 0.990 | 蚌埠 | 0.415 | 0.383 | 0.414 | 池州 | 0.109 | 0.096 | 0.112 |
注:核心区城市以灰色底色标示,其余为边缘区。 |
表2 2000—2017年广东省城市经济集中度演变Tab. 2 The evolution of urban economic concentration in Guangdong province, 2000-2017 |
| 2000年 | 2004年 | 2014年 | 2017年 | 2000年 | 2004年 | 2014年 | 2017年 | ||
|---|---|---|---|---|---|---|---|---|---|
| 深圳 | 17.976 | 19.745 | 19.060 | 19.525 | 茂名 | 0.586 | 0.538 | 0.514 | 0.507 |
| 广州 | 5.490 | 5.507 | 5.377 | 5.349 | 湛江 | 0.454 | 0.387 | 0.368 | 0.364 |
| 东莞 | 5.326 | 6.658 | 6.224 | 6.220 | 汕尾 | 0.421 | 0.387 | 0.465 | 0.461 |
| 佛山 | 4.381 | 4.636 | 5.148 | 5.172 | 阳江 | 0.323 | 0.293 | 0.328 | 0.320 |
| 珠海 | 3.216 | 3.227 | 2.949 | 3.087 | 云浮 | 0.284 | 0.225 | 0.233 | 0.228 |
| 汕头 | 3.214 | 2.391 | 1.975 | 2.017 | 肇庆 | 0.270 | 0.242 | 0.280 | 0.265 |
| 中山 | 3.080 | 3.664 | 3.972 | 3.911 | 梅州 | 0.182 | 0.160 | 0.135 | 0.134 |
| 揭阳 | 0.948 | 0.684 | 0.826 | 0.790 | 韶关 | 0.168 | 0.150 | 0.136 | 0.131 |
| 潮州 | 0.921 | 0.784 | 0.749 | 0.735 | 清远 | 0.132 | 0.126 | 0.148 | 0.143 |
| 江门 | 0.849 | 0.717 | 0.661 | 0.660 | 河源 | 0.089 | 0.093 | 0.115 | 0.109 |
| 惠州 | 0.621 | 0.577 | 0.683 | 0.688 | — | — | — | — | — |
注:核心区城市以灰色底色标示,其余为边缘区。 |
表3 经济增长驱动因素与空间溢出效应估计结果Tab. 3 SDM estimation results of economic growth |
| 长江三角洲 | 广东省 | |
|---|---|---|
| ln L | 0.245*** (7.11) | 0.486*** (9.91) |
| ln K | 0.808*** (37.89) | 0.691*** (12.16) |
| ln FT | 0.082*** (6.14) | 0.098*** (3.60) |
| ln Fin | 0.014* (1.93) | 0.016*** (3.03) |
| ln Road | 0.172*** (5.95) | 0.225*** (3.05) |
| ln Pat | 0.005*** (4.97) | 0.058* (1.88) |
| ln Ser | 0.045*** (2.89) | 0.756*** (7.24) |
| W×lnL | -0.097** (-2.31) | 10.738*** (6.28) |
| W×ln K | 7.021*** (7.14) | 4.661*** (3.27) |
| W×ln FT | 0.180*** (2.96) | -1.053 (-1.01) |
| W×ln Fin | -0.164** (-2.08) | -1.069 (-0.65) |
| W×ln Road | -0.750 (-0.08) | 2.493* (1.91) |
| W×ln Pat | -0.825*** (-2.76) | -0.158 (-0.22) |
| W×ln Ser | 0.869 (1.51) | 0.835*** (4.92) |
| ρ | 0.436*** (4.20) | 0.379*** (4.16) |
| Adj.R2 | 0.961 | 0.994 |
注:*、**、***分别表示10%、5%、1%显著性水平;括号内为t值。 |
表4 空间杜宾模型的效应分解Tab. 4 SDM effects decomposition results of economic growth |
| 长江三角洲 | 广东省 | ||||||
|---|---|---|---|---|---|---|---|
| 总效应 | 直接效应 | 间接效应 | 总效应 | 直接效应 | 间接效应 | ||
| ln L | 0.136*** (2.68) | 0.260*** (10.03) | -0.124 (-0.61) | 7.445*** (4.42) | 0.776*** (7.14) | 6.668*** (3.44) | |
| ln K | 1.668*** (4.85) | 0.393*** (11.90) | 1.275*** (3.70) | 0.463*** (2.93) | 0.193*** (13.37) | 0.270** (2.31) | |
| ln FT | 0.475 (1.38) | 0.159*** (12.05) | 0.316 (0.83) | -0.646 (-0.81) | 0.118*** (5.12) | -0.765 (-1.25) | |
| ln Fin | -0.155 (-0.04) | 0.016*** (2.99) | -0.171 (-0.48) | -0.077 (-0.64) | 0.002** (2.25) | -0.079 (-0.69) | |
| ln Road | 0.003 (1.12) | 0.021*** (2.86) | -0.018 (-1.07) | 1.797*** (3.28) | 0.182*** (5.04) | 1.615*** (3.17) | |
| ln Pat | -0.386*** (-3.51) | 0.078*** (5.63) | -0.464*** (-4.16) | 0.521** (2.01) | 0.628** (2.08) | -0.107 (-0.21) | |
| ln Ser | 0.650** (2.28) | 0.148*** (3.75) | 0.502* (1.77) | 1.174*** (3.15) | 0.621*** (5.82) | 0.553*** (2.98) | |
注:*、**、***分别表示10%、5%、1%显著性水平;括号内为t值。 |
表5 不同区域空间杜宾模型的效应分解Tab. 5 SDM effects decomposition results for different regions of China |
| lnL | lnK | lnFT | lnFin | lnRoad | lnPat | lnSer | |||
|---|---|---|---|---|---|---|---|---|---|
| 长江三角洲 | 总效应 | 核心区 | 0.359** (2.04) | 0.853*** (2.89) | -0.258 (-0.34) | 0.044** (2.21) | 0.770** (2.51) | -0.083 (-0.84) | 0.667** (1.99) |
| 边缘区 | 0.106** (2.35) | 1.428*** (4.86) | -0.130 (-0.79) | -0.153 (-1.44) | -0.070 (-1.17) | -0.041** (-2.26) | 0.335 (1.12) | ||
| 直接 效应 | 核心区 | 0.419*** (8.83) | 0.667*** (15.41) | 0.044*** (2.68) | 0.070** (2.14) | 0.049** (2.47) | 0.026*** (2.64) | 0.317* (1.87) | |
| 边缘区 | 0.252*** (7.09) | 0.691*** (24.38) | 0.051*** (3.69) | 0.050*** (4.33) | 0.023*** (3.94) | 0.022 (0.86) | 0.320 (1.02) | ||
| 间接 效应 | 核心区 | -0.060 (-0.28) | 0.186 (1.47) | -0.302 (-0.15) | -0.026 (-0.94) | 0.721*** (2.78) | -0.109 (-1.18) | 0.350** (2.33) | |
| 边缘区 | -0.146** (-2.20) | 0.736** (2.48) | -0.180* (-1.87) | -0.203** (-1.97) | -0.093 (-1.60) | -0.062** (-2.39) | 0.015 (1.13) | ||
| 广东省 | 总效应 | 核心区 | 2.502*** (4.21) | 2.460*** (4.03) | -0.669** (-2.22) | 0.989** (2.42) | 3.111*** (2.65) | 0.088*** (2.84) | 0.433*** (3.90) |
| 边缘区 | 0.591*** (3.45) | 2.685*** (3.86) | 0.139* (1.75) | -0.579 (-0.85) | 0.242 (0.54) | -0.015 (-0.30) | 0.126* (1.75) | ||
| 直接 效应 | 核心区 | 0.649*** (3.46) | 0.352*** (3.59) | 0.023*** (6.17) | 0.297 (0.26) | 1.701* (1.85) | 0.015*** (3.50) | 0.054*** (3.93) | |
| 边缘区 | 0.265*** (8.34) | 0.983*** (10.98) | 0.041** (2.37) | 0.409*** (3.95) | 0.140** (2.16) | 0.039 (0.60) | 0.176* (1.79) | ||
| 间接 效应 | 核心区 | 1.853*** (3.31) | 2.108*** (4.03) | -0.692** (-2.23) | 0.692** (1.97) | 1.410*** (2.60) | 0.073*** (2.71) | 0.380*** (3.80) | |
| 边缘区 | 0.326 (1.25) | 1.702*** (2.76) | 0.099* (1.73) | -0.988 (-0.64) | 0.102 (0.25) | -0.054 (-0.14) | -0.051*** (-2.68) |
注:*、**、***分别表示10%、5%、1%显著性水平;括号内为t值。 |
表6 不同时期空间杜宾模型的效应分解Tab. 6 SDM effects decomposition results in different periods |
| 年份 | lnL | lnK | lnFT | lnFin | lnRoad | lnPat | lnSer | ||
|---|---|---|---|---|---|---|---|---|---|
| 长江 三角洲 | 总效应 | 2000—2008 | 0.120* (1.70) | 1.182*** (12.81) | 0.409 (1.23) | -0.323 (-1.23) | 0.109*** (2.72) | -0.040** (-2.25) | 0.025 (0.81) |
| 2009—2017 | 0.283** (2.45) | 1.695*** (5.59) | -1.069** (-2.52) | -0.505 (-0.99) | 0.426* (1.95) | 0.058** (2.14) | 0.904* (1.95) | ||
| 直接 效应 | 2000—2008 | 0.230*** (7.41) | 0.707*** (6.96) | 0.054** (2.31) | 0.415*** (3.59) | 0.135*** (3.28) | 0.023** (2.19) | 0.084 (0.66) | |
| 2009—2017 | 0.274*** (6.18) | 0.674*** (17.03) | 0.066 (1.08) | 0.106** (2.48) | 0.237 (1.21) | 0.073*** (5.11) | 0.519** (2.28) | ||
| 间接 效应 | 2000—2008 | -0.110*** (-2.72) | 0.475*** (4.55) | 0.355 (1.11) | -0.738* (-1.71) | -0.026 (-1.62) | -0.063*** (-3.69) | -0.058 (-0.71) | |
| 2009—2017 | 0.007 (0.03) | 1.021*** (3.14) | -1.135*** (-2.61) | -0.611* (-1.92) | 0.189 (1.62) | -0.015 (-0.66) | 0.385 (0.27) | ||
| 广东省 | 总效应 | 2000—2008 | 0.979 (1.37) | 1.990 (1.51) | 0.087 (1.60) | -0.746 (-1.40) | 0.009 (0.85) | -0.008 (-0.51) | 0.030 (0.93) |
| 2009—2017 | 3.401** (2.22) | 1.123*** (2.86) | -0.202 (-0.12) | 0.732 (1.47) | 3.603** (2.33) | 0.154 (1.02) | 0.042** (2.40) | ||
| 直接 效应 | 2000—2008 | 0.203** (2.24) | 0.700*** (7.80) | 0.058* (1.74) | 0.711*** (2.77) | 0.054** (2.10) | 0.026 (0.66) | 0.017 (0.50) | |
| 2009—2017 | 0.356*** (3.79) | 0.657*** (6.12) | 0.056 (0.68) | 0.331 (1.16) | 1.381*** (2.73) | 0.047*** (2.81) | 0.031*** (2.71) | ||
| 间接 效应 | 2000—2008 | 0.776 (1.28) | 1.290 (0.24) | 0.028 (1.56) | -1.457 (-1.28) | -0.045 (-1.28) | -0.034 (-0.54) | 0.013 (1.04) | |
| 2009—2017 | 3.045*** (3.12) | 0.466* (1.79) | -0.258 (-0.17) | 0.401 (1.48) | 2.222** (2.31) | 0.107 (1.43) | 0.011* (1.83) |
注:*、**、***分别表示10%、5%、1%显著性水平,括号内为t值。 |
真诚感谢匿名评审专家在百忙之中审阅本文,并对文章在研究思路、模型设定、结果分析、结论梳理等方面提出针对性的修改意见,使本文获益匪浅。
| [1] |
|
| [2] |
王少剑, 王洋, 赵亚博. 1990年来广东区域发展的空间溢出效应及驱动因素. 地理学报, 2015, 70(6): 965-979.
[
|
| [3] |
闫东升, 王晖, 孙伟. 长江三角洲区域发展差距时空演变驱动因素研究. 长江流域资源与环境, 2019, 28(3): 517-529.
[
|
| [4] |
陈培阳, 朱喜钢. 基于不同尺度的中国区域经济差异. 地理学报, 2012, 67(8): 1085-1097.
[
|
| [5] |
张伟丽, 叶信岳, 李栋, 等. 网络关联、空间溢出效应与中国区域经济增长: 基于腾讯位置大数据的研究. 地理科学, 2019, 39(9): 1371-1377.
[
|
| [6] |
于瀚辰, 周麟, 沈体雁. 制造业企业区位选择集聚经济指向的空间效应. 地理研究, 2019, 38(2): 273-284.
[
|
| [7] |
王铮, 武巍, 吴静. 中国各省区经济增长溢出分析. 地理研究, 2005, 24(2): 243-252.
[
|
| [8] |
|
| [9] |
|
| [10] |
|
| [11] |
符淼. 地理距离和技术外溢效应: 对技术和经济集聚现象的空间计量学解释. 经济学(季刊), 2009, 8(4): 1549-1566.
[
|
| [12] |
龚维进, 倪鹏飞, 徐海东. 经济竞争力影响因素的空间外溢效应及其溢出带宽?: 基于中国285个城市的空间计量分析. 南京社会科学, 2019, (9): 23-30, 38.
[
|
| [13] |
余泳泽, 刘大勇, 宣烨. 生产性服务业集聚对制造业生产效率的外溢效应及其衰减边界: 基于空间计量模型的实证分析. 金融研究, 2016, (2): 23-36.
[
|
| [14] |
程开明, 章雅婷. 中国城市创新空间溢出效应测度及分解. 科研管理, 2018, 39(12): 86-94.
[
|
| [15] |
汪浩瀚, 徐建军. 市场潜力、空间溢出与制造业集聚. 地理研究, 2018, 37(9): 1736-1750.
[
|
| [16] |
季颖颖, 郭琪, 贺灿飞. 外商直接投资技术溢出空间效应及其变化: 基于中国地级市的实证研究. 地理科学进展, 2014, 33(12): 1614-1623.
[
|
| [17] |
王少剑, 黄永源. 中国城市碳排放强度的空间溢出效应及驱动因素. 地理学报, 2019, 74(6): 1131-1148.
[
|
| [18] |
任宏, 李振坤. 中国三大城市群经济增长的影响因素及其空间效应. 城市问题, 2019, (10): 63-68.
[
|
| [19] |
王庆喜, 胡志学. 长三角地区研发企业集聚与知识溢出强度: 连续空间中的微观分析. 地理科学, 2018, 38(11): 1828-1836.
[
|
| [20] |
伍骏骞, 阮建青, 徐广彤. 经济集聚、经济距离与农民增收: 直接影响与空间溢出效应. 经济学(季刊), 2016, 16(1): 297-320.
[
|
| [21] |
方师乐, 卫龙宝, 伍骏骞. 农业机械化的空间溢出效应及其分布规律: 农机跨区服务的视角. 管理世界, 2017, (11): 65-78,187-188.
[
|
| [22] |
王良健, 李辉, 石川. 中国城市土地利用效率及其溢出效应与影响因素. 地理学报, 2015, 70(11): 1788-1799.
[
|
| [23] |
白俊红, 王钺, 蒋伏心, 等. 研发要素流动、空间知识溢出与经济增长. 经济研究, 2017, 52(7): 109-123.
[
|
| [24] |
闫东升, 杨槿, 高金龙. 长江三角洲人口与经济的非均衡格局及其影响因素研究. 地理科学, 2018, 38(3): 376-384.
[
|
| [25] |
|
| [26] |
王雨飞, 倪鹏飞, 王光辉. 中国城市群体系空间结构及多中心演变研究. 江淮论坛, 2019, (3): 47-53.
[
|
| [27] |
赵渺希, 黎智枫, 钟烨, 等. 中国城市群多中心网络的拓扑结构. 地理科学进展, 2016, 35(3): 376-388.
[
|
| [28] |
张军, 吴桂英, 张吉鹏. 中国省际物质资本存量估算: 1952-2000. 经济研究, 2004, 39(10): 35-44.
[
|
| [29] |
张学良. 长三角地区经济收敛及其作用机制: 1993-2006. 世界经济, 2010, (3): 126-140.
[
|
| [30] |
|
/
| 〈 |
|
〉 |