
危机冲击下长三角地区电子信息产业集群韧性特征及其影响因素
|
朱华友(1967-),男,安徽枞阳人,教授,博士生导师,研究方向为产业集群与区域发展。E-mail: zhu589@zjnu.cn |
收稿日期: 2021-06-09
录用日期: 2021-11-08
网络出版日期: 2021-12-15
基金资助
国家自然科学基金项目(41571112)
Resilience characteristics and influencing factors of electronic information industry clusters in the Yangtze River Delta under the impact of crisis
Received date: 2021-06-09
Accepted date: 2021-11-08
Online published: 2021-12-15
当前经济环境复杂多变,产业集群面临的冲击越来越多,一些集群有可能实现路径突破,而一些集群可能会落入发展的低端陷阱而难以自拔。因此,研究产业集群在危机冲击下的韧性特征、影响因素以及如何走上复苏道路是摆在研究者面前的重要问题。利用中国工企数据库对长三角地区电子信息产业集群进行识别,判断其所遭受的主要冲击,从抵抗力和恢复力两个维度测度集群韧性,构建数学模型分析韧性影响因素。结果表明:① 集群面临两次冲击的抵抗力均较弱;② 集群在遭遇两次冲击后的恢复力较好,均强于抵抗力,但各个集群的恢复力差异明显,出口比例高的集群更容易受到经济危机的冲击;③ 外生型集群韧性主要体现为“低抵抗力-高恢复力”型和“高抵抗力-低恢复力”型,内生型集群韧性主要体现为“低抵抗力-高恢复力”型;④ 区域产业非相关多样性仅对两次冲击中的集群恢复力具有促进作用,对抵抗力的影响不明显。区域产业相关多样化对两次冲击的抵抗力和恢复力均无显著影响。企业知识异质性对集群抵抗力和恢复力发挥正向促进作用,而集群的对外开放程度在总体上发挥了抑制作用。龙头企业对在两次冲击下集群抵抗力的作用方向不同。所有制异质性和年轻企业占比对集群韧性的影响作用不明显。
朱华友 , 李娜 , 庄远红 , 蒋自然 . 危机冲击下长三角地区电子信息产业集群韧性特征及其影响因素[J]. 地理研究, 2021 , 40(12) : 3420 -3436 . DOI: 10.11821/dlyj020210500
The current economic environment is complex and changing, while industrial clusters are facing more and more shocks. Some clusters are likely to achieve path breakthroughs, while some may fall into the low-end trap of development and find it difficult to extricate themselves. Therefore, studying the resilience characteristics of industrial clusters under the crisis shock, the influencing factors and how to embark on the road to recovery is an important issue for the researchers. The Yangtze River Delta region, as China's famous electronics and information industry cluster, presents characteristics such as technology and capital intensive, innovation active and highly globalised. However, its highly externally oriented development model makes it deeply embedded in the global value chain and at the same time more vulnerable to external shocks and risks. This paper uses the China Industrial Enterprise Database to identify the electronic information industry clusters in the Yangtze River Delta region, determine the main shocks to which they are subjected, measure cluster resilience in two dimensions: resistance and recovery, and build a mathematical model to analyse the factors influencing resilience. The research results show that: (1) Under different crisis shocks, the industry clusters show different resiliences, mainly in that firstly, the resistance of the cluster is weaker in resisting two shocks, and secondly, the recovery of each cluster differs significantly after encountering shocks. In particular, the higher the proportion of exports in the financial crisis, the more vulnerable the region was to the economic crisis. (2) Cluster types have different characteristics and show different resiliences. The resilience of exogenous clusters is mainly reflected in the “low resistance-high recovery” type and “high resistance-low recovery” type, while the resilience of endogenous clusters is mainly reflected in the “low resistance-high recovery” type. (3) There are partial differences in the factors affecting cluster resilience under different crisis shocks. The non-related diversity of regional industries only contributes to cluster recovery in two shocks and has no significant effect on resistance. Regional industry-related diversification had no significant effect on both resistance and recovery in two shocks. Among intra-cluster firm heterogeneity, only knowledge heterogeneity positively contributes to cluster resistance and recovery, while cluster openness to the outside world plays a suppressive role in general. The leading firms acted in different directions on cluster resistance under the two shocks. The role of ownership heterogeneity and the share of young firms in influencing cluster resilience is not significant.
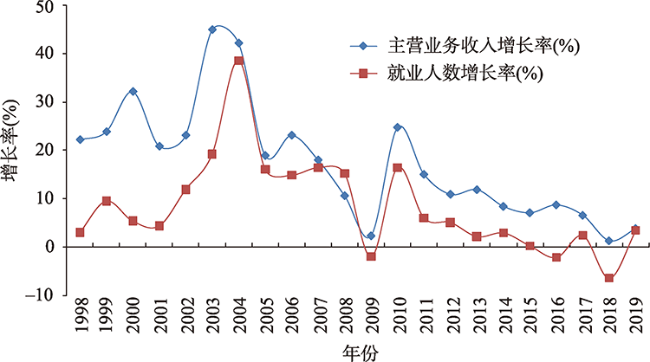
图1 1998—2019年全国电子信息产业主要经济指标的增长率变动Fig. 1 Changes in growth rate of main economic indicators of China's electronic information industry from 1998 to 2019 |
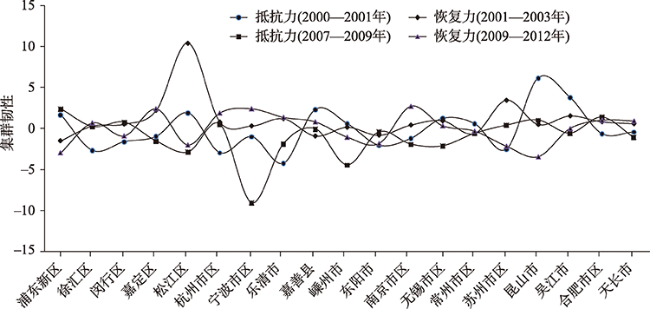
表1 两次冲击中的电子信息产业集群的抵抗力和恢复力Tab. 1 Resistance and resilience of the electronic information industry cluster in the two shocks |
| 县 (市、区) | 2001年全球经济衰退及恶性竞争 | 2008年全球金融危机 | |||
|---|---|---|---|---|---|
| 抵抗力RES1 (2000—2001年) | 恢复力REC1 (2001—2003年) | 抵抗力RES2 (2007—2009年) | 恢复力REC2 (2009—2012年) | ||
| 浦东新区 | 1.662 | -1.513 | 2.362 | -3.010 | |
| 徐汇区 | -2.701 | 0.286 | 0.206 | 0.652 | |
| 闵行区 | -1.628 | 0.508 | 0.726 | -0.933 | |
| 嘉定区 | -0.979 | 2.183 | -1.572 | 2.380 | |
| 松江区 | 1.879 | 10.361 | -2.898 | -2.043 | |
| 杭州市区 | -2.969 | 0.767 | 0.481 | 1.881 | |
| 宁波市区 | -1.024 | 0.287 | -9.092 | 2.386 | |
| 乐清市 | -4.260 | 1.166 | -1.879 | 1.339 | |
| 嘉善县 | 2.310 | -0.934 | -0.080 | 0.778 | |
| 嵊州市 | 0.583 | 0.129 | -4.479 | -1.082 | |
| 东阳市 | -2.066 | -0.846 | -0.435 | -1.867 | |
| 南京市区 | -1.228 | 0.400 | -1.941 | 2.693 | |
| 无锡市区 | 1.216 | 0.921 | -2.138 | 0.308 | |
| 常州市区 | 0.579 | -0.631 | -0.628 | -0.344 | |
| 苏州市区 | -2.547 | 3.423 | 0.366 | -2.196 | |
| 昆山市 | 6.152 | 0.476 | 0.991 | -3.491 | |
| 吴江市 | 3.788 | 1.510 | -0.590 | -0.032 | |
| 合肥市区 | -0.641 | 0.799 | 1.354 | 0.979 | |
| 天长市 | -0.452 | 0.565 | -1.101 | 0.903 | |
表2 不同产业集群类型的韧性比较Tab. 2 Comparison of resilience of different types of industrial clusters |
| 集群类型 | 集群所在区域 | 韧性类型(频次) | 主要集群韧性类型 |
|---|---|---|---|
| 外生型集群 | 浦东新区、徐汇区、闵行区、嘉定区、松江区、南京市区、无锡市区、常州市区、苏州市区、昆山市、吴江市 | 低抵抗力-高恢复力(8) | 低抵抗力-高恢复力型; 高抵抗力-低恢复力型 |
| 高抵抗力-低恢复力(6) | |||
| 高抵抗力-高恢复力(5) | |||
| 低抵抗力-低恢复力(3) | |||
| 内生型集群 | 杭州市区、宁波市区、乐清市、嘉善县、嵊州市、东阳市、合肥市区、天长市 | 低抵抗力-高恢复力(9) | 低抵抗力-高恢复力型 |
| 高抵抗力-高恢复力(3) | |||
| 低抵抗力-低恢复力(3) | |||
| 高抵抗力-低恢复力(1) |
表3 解释变量描述与量化Tab. 3 Description and quantification of explanatory variables |
| 变量类型 | 变量指标 | 描述及量化 |
|---|---|---|
| 解释变量 | 相关多样化(RV) | RV= ,式中:Pg和Pi分别为集群所在区域工业部门两位数和三位数产业的从业人员平均人数占全部职工数的比例 |
| 非相关多样化(UV) | UV= ,式中:Pg= ;Pg和Pi分别为集群所在区域工业部门两位数和三位数产业的从业人员平均人数占全部职工数的比例 | |
| 知识异质性(KD) | 采用Blau's指数表示:KD=1- ,式中:pi表示集群内电子信息产业中第i种三位数产业的规模以上企业数量占比 | |
| 所有制异质性(OD) | 采用Blau's指数表示:OD=1- ,式中:qi表示集群内i种所有权类型的企业数量占比,划分为国有、集体、私有、外企和其他企业五类 | |
| 龙头企业的作用(FF) | 采用赫芬达尔指数表示:HHI= ,式中:X表示各集群的市场总规模;Xi表示集群内第i个企业的市场规模 | |
| 年轻企业占比(YE) | 集群内部企业年龄低于该集群企业平均年龄的企业个数在该集群企业总数的占比(企业年龄根据企业开业时间计算) | |
| 集群对外开放(OPEN) | 集群企业出口交货值在其工业销售总产值的占比 | |
| 控制变量 | 区域人均生产总值(GDPper) | 集群所在区域的人均生产总值 |
| 财政支出(CZ) | 集群所在区域的财政支出 |
表4 集群韧性的回归结果分析Tab. 4 Analysis of regression results of cluster resilience |
| 解释变量 | 抵抗力(RES) | 恢复力(RES) | |||
|---|---|---|---|---|---|
| RES1 | RES2 | RES1 | RES2 | ||
| 相关多样化(RV) | -0.22 | -1.32 | -1.95 | -0.17 | |
| (-0.71) | (-1.15) | (-1.20) | (-0.32) | ||
| 非相关多样化(UV) | -0.39 | -1.50 | 4.55** | 1.27** | |
| (-0.95) | (-1.40) | (2.35) | (2.27) | ||
| 所有制异质性(OD) | -1.03 | 2.97 | -4.59 | -0.74 | |
| (-0.23) | (0.86) | (-0.62) | (-0.46) | ||
| 知识异质性(KD) | 1.07* | 6.78** | 8.40* | 3.63* | |
| (1.89) | (2.33) | (2.11) | (2.02) | ||
| 龙头企业的作用(FF) | 1.49*** | -12.14*** | 5.46 | -1.92 | |
| (3.25) | (-4.40) | (1.17) | (-1.09) | ||
| 年轻企业占比(YE) | -2.10* | -3.23 | -3.93 | 3.41 | |
| (-2.25) | (-0.79) | (-0.41) | (1.09) | ||
| 集群对外开放度(OPEN) | -1.14** | -4.15* | 6.09** | -1.45 | |
| (-2.44) | (-2.08) | (2.33) | (-1.43) | ||
| 区域人均生产总值(lnGDPper) | 0.26 | -1.64 | 0.79 | -0.71 | |
| (1.16) | (-1.51) | (0.49) | (-1.14) | ||
| 财政支出(lnCZ) | -0.13 | 0.17 | -1.02 | 0.19 | |
| (-0.88) | (0.47) | (-1.14) | (0.46) | ||
| 常数项 | 0.81 | 25.07* | -23.71 | -0.52 | |
| (0.39) | (1.96) | (-1.33) | (-0.09) | ||
| F值 | 4.30* | 4.53** | 1.93 | 7.00*** | |
| R2 | 0.811 | 0.819 | 0.659 | 0.875 | |
| 调整R2 | 0.622 | 0.638 | 0.318 | 0.750 | |
注:① ***、**、*分别表示通过了1%、5%、10%水平上的显著性检验。② 括号内数值为相应t统计量。 |
匿名评审专家对本文严谨性、文献述评、变量选取等方面提出的修改意见,使本文获益匪浅,特此表示诚挚的谢意!
| [1] |
|
| [2] |
|
| [3] |
汪辉, 徐蕴雪, 卢思琪, 等. 恢复力、弹性或韧性?社会-生态系统及其相关研究领域中“Resilience”一词翻译之辨析. 国际城市规划, 2017, 32(4): 29-39.
[
|
| [4] |
孙晶, 王俊, 杨新军. 社会-生态系统恢复力研究综述. 生态学报, 2007, (12): 5371-5381.
[
|
| [5] |
葛怡, 史培军, 徐伟, 等. 恢复力研究的新进展与评述. 灾害学, 2010, 25(3): 119-124, 129.
[
|
| [6] |
黄晓军, 黄馨. 弹性城市及其规划框架初探. 城市规划, 2015, 39(2): 50-56.
[
|
| [7] |
李彤玥, 牛品一, 顾朝林. 弹性城市研究框架综述. 城市规划学刊, 2014, (5): 23-31.
[
|
| [8] |
|
| [9] |
|
| [10] |
|
| [11] |
|
| [12] |
|
| [13] |
苏杭. 经济韧性问题研究进展. 经济学动态, 2015, (8): 144-151.
[
|
| [14] |
|
| [15] |
|
| [16] |
贺灿飞, 陈韬. 外部需求冲击、相关多样化与出口韧性. 中国工业经济, 2019, (7): 61-80.
[
|
| [17] |
|
| [18] |
|
| [19] |
|
| [20] |
孟祥芳, 汪波. 基于弹性相关因素分析的集群可持续发展研究. 科学学与科学技术管理, 2014, 35(8): 49-56.
[
|
| [21] |
罗黎平. 协同治理视角下的产业集群韧性提升研究. 求索, 2018, (6): 43-50.
[
|
| [22] |
俞国军, 贺灿飞, 朱晟君. 产业集群韧性: 技术创新、关系治理与市场多元化. 地理研究, 2020, 39(6): 1343-1356.
[
|
| [23] |
|
| [24] |
|
| [25] |
|
| [26] |
|
| [27] |
|
| [28] |
|
| [29] |
王琛, 郭一琼. 地方产业抵御经济危机的弹性影响因素: 以电子信息产业为例. 地理研究, 2018, 37(7): 1297-1307.
[
|
| [30] |
|
| [31] |
|
| [32] |
|
| [33] |
|
| [34] |
吴俊杰, 盛亚. 网络强度、网络开放度对产业集群绩效的影响机制研究: 以浙江产业集群为例. 经济地理, 2011, 31(11): 1867-1873.
[
|
| [35] |
贾生华, 杨菊萍. 产业集群演进中龙头企业的带动作用研究综述. 产业经济评论, 2007, (1): 129-136.
[
|
| [36] |
徐圆, 邓胡艳. 多样化、创新能力与城市经济韧性. 经济学动态, 2020, (8): 88-104.
[
|
/
| 〈 |
|
〉 |
