
黄河流域绿色发展效率的时空演变特征与影响因素
|
郭付友(1987-),男,山东菏泽人,博士,副教授,硕士生导师,研究方向为区域可持续发展。E-mail: guofy945@nenu.edu.cn |
收稿日期: 2020-09-18
录用日期: 2021-10-08
网络出版日期: 2022-03-10
基金资助
国家自然科学基金(41801105)
国家自然科学基金(41771138)
国家社会科学基金(20CGL037)
山东省高等学校青创科技支持计划(2020RWG010)
版权
Spatio-temporal evolution track and influencing factors of green development efficiency in Yellow River Basin
Received date: 2020-09-18
Accepted date: 2021-10-08
Online published: 2022-03-10
Copyright
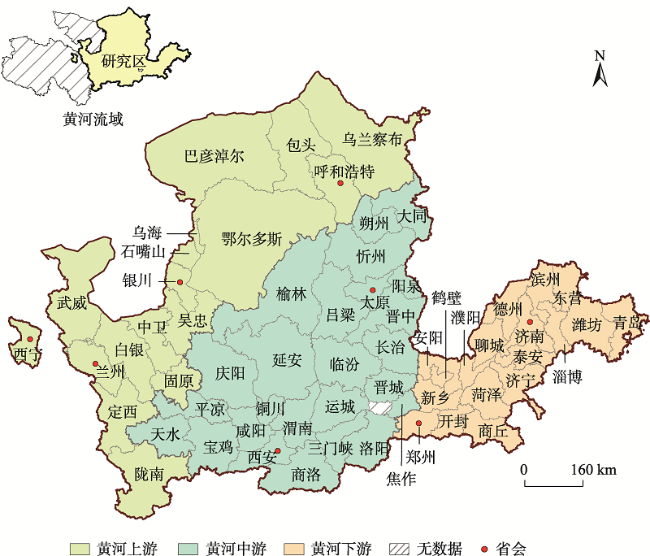
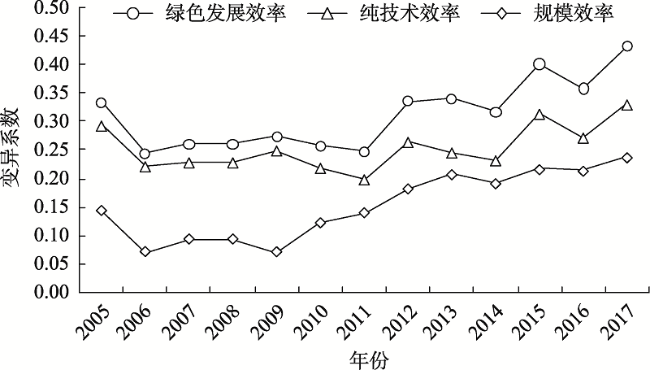
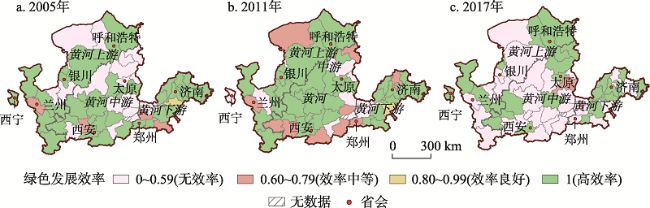
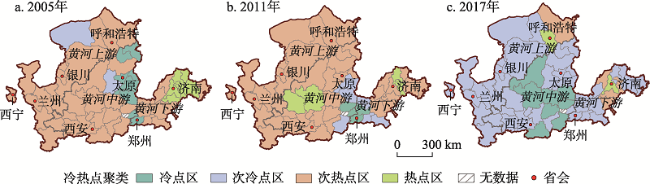
基于2005—2017年黄河流域61个地级市数据,构建了黄河流域绿色发展效率投入产出指标体系,并运用多种计量方法研究了黄河流域绿色发展效率时空格局特征与驱动因素。结果如下:① 黄河流域绿色发展效率的区域差距不断扩大,研究期限内绿色发展效率呈现出由“高效率小差距”向“低效率大差距”演进,说明黄河流域绿色发展效率的俱乐部收敛特征不断凸显。② 黄河流域绿色发展效率增长主要来源于规模效率的贡献,科学技术尚未发挥重要驱动作用。③ 研究期限内黄河流域绿色发展效率存在较为明显的空间依存关系,绿色发展效率水平相近的地区空间集聚现象显著。④ 黄河流域绿色发展效率空间分异性显著,高效率地区的东西分布、南北分布的地域差异性突出,集中表现在以城市群为载体呈集群式发展。最后采用Tobit回归模型具体分析了产业结构、经济发展、科学技术、政府调控与市场化水平对于黄河流域及上中下游地区绿色发展效率的作用强度与作用效果。
郭付友 , 高思齐 , 佟连军 , 任嘉敏 . 黄河流域绿色发展效率的时空演变特征与影响因素[J]. 地理研究, 2022 , 41(1) : 167 -180 . DOI: 10.11821/dlyj020200895
Based on the data of 61 prefecture-level cities in the Yellow River Basin from 2005 to 2017, this paper constructed the input-output index system of green development efficiency, and used various spatial econometric models to examine the spatio-temporal pattern characteristics and influencing factors of green development efficiency in the study area. The following conclusions can be drawn as follows. (1) The regional differences of green development efficiency are gradually widening, evolving from “small differences and high efficiency” to “large differences and low efficiency” totally, which indicates that the club convergence characteristics of green development efficiency are obvious. (2) Scale efficiency makes significant contribution to the growth of green development efficiency, showing that large-scale agglomeration and intensive development are still an important guarantee for the improvement of green development efficiency. However, science and technology have not yet played an important driving role in improving the green development efficiency. In the future, improving the level of science and technology in this basin is the key to optimizing and improving the green development efficiency. (3) There is an obvious spatial reliable correlation of green development efficiency within the study period, and the regional spatial agglomeration featured with similar green development efficiency level is significant. (4) The spatial distributions of green development efficiency are obviously diverse, and the regional differences between the east-west distribution and north-south distribution of high-efficiency areas are prominent, which mainly shows a cluster development stimulated with urban agglomeration. and reflects that the green development efficiency of the study basin has a circular cumulative path dependent effect. The influencing factors of green development efficiency in the Yellow River Basin can be attributed to the adjustment effect of industrial structure, the growth effect of economic development, the demonstration effect and spillover effect of science and technology, the government regulation mechanism and market-oriented mechanism. Finally, Tobit regression model is used to analyze the influencing intensity and direction of industrial structure, economic development, science and technology, government regulation and marketization level on green development efficiency in the Yellow River Basin and its subzones.
表1 黄河流域绿色发展效率评价指标体系Tab. 1 Evaluation index system of green development efficiency in the Yellow River Basin |
| 类型 | 要素 | 指标 | 含义 |
|---|---|---|---|
| 投入 | 劳动力 | 年末从业人员数 | 表示劳动力投入要素 |
| 资本 | 固定资产投资 | 表示固定资本存量要素 | |
| 科技 | 科学技术支出/一般公共预算支出 | 表示科学技术支持力度 | |
| 资源 | 用水总量 | 表示社会供水保障能力 | |
| 全社会用电量 | 表示社会供电保障能力 | ||
| 产出 | 期望产出 | GDP | 表示经济产出效益 |
| 社会消费品零售总额 | 表示社会产出效益 | ||
| 绿地面积 | 表示环境产出效益 | ||
| 非期望产出 | 工业SO2排放量 | 表示环境污染排放产出 | |
| 工业废水排放量 | 表示环境污染排放产出 |
表2 2005—2017年黄河流域绿色发展效率指数及其分解Tab. 2 Green development efficiency index and its decomposition of the Yellow River Basin in 2005-2017 |
| 年份 | 黄河流域 | 上游地区 | 中游地区 | 下游地区 | |||||||||||
|---|---|---|---|---|---|---|---|---|---|---|---|---|---|---|---|
| GDE | PTE | SE | GDE | PTE | SE | GDE | PTE | SE | GDE | PTE | SE | ||||
| 2005 | 0.792 | 0.839 | 0.946 | 0.834 | 0.878 | 0.952 | 0.783 | 0.815 | 0.960 | 0.845 | 0.853 | 0.989 | |||
| 2006 | 0.858 | 0.880 | 0.972 | 0.868 | 0.887 | 0.975 | 0.853 | 0.870 | 0.976 | 0.823 | 0.839 | 0.978 | |||
| 2007 | 0.851 | 0.880 | 0.962 | 0.856 | 0.889 | 0.959 | 0.851 | 0.882 | 0.962 | 0.802 | 0.834 | 0.961 | |||
| 2008 | 0.851 | 0.880 | 0.962 | 0.856 | 0.889 | 0.959 | 0.851 | 0.882 | 0.962 | 0.802 | 0.834 | 0.961 | |||
| 2009 | 0.851 | 0.871 | 0.972 | 0.858 | 0.880 | 0.969 | 0.852 | 0.871 | 0.974 | 0.806 | 0.840 | 0.961 | |||
| 2010 | 0.834 | 0.873 | 0.956 | 0.835 | 0.876 | 0.953 | 0.828 | 0.869 | 0.955 | 0.798 | 0.815 | 0.977 | |||
| 2011 | 0.843 | 0.891 | 0.948 | 0.847 | 0.895 | 0.947 | 0.827 | 0.882 | 0.940 | 0.801 | 0.823 | 0.970 | |||
| 2012 | 0.767 | 0.843 | 0.910 | 0.770 | 0.847 | 0.910 | 0.758 | 0.830 | 0.912 | 0.685 | 0.745 | 0.926 | |||
| 2013 | 0.775 | 0.863 | 0.899 | 0.777 | 0.876 | 0.891 | 0.787 | 0.861 | 0.911 | 0.746 | 0.787 | 0.941 | |||
| 2014 | 0.790 | 0.872 | 0.906 | 0.794 | 0.876 | 0.907 | 0.799 | 0.862 | 0.924 | 0.718 | 0.777 | 0.925 | |||
| 2015 | 0.724 | 0.811 | 0.895 | 0.730 | 0.832 | 0.880 | 0.741 | 0.806 | 0.918 | 0.684 | 0.733 | 0.929 | |||
| 2016 | 0.761 | 0.856 | 0.893 | 0.756 | 0.869 | 0.872 | 0.786 | 0.862 | 0.912 | 0.760 | 0.831 | 0.914 | |||
| 2017 | 0.700 | 0.803 | 0.874 | 0.706 | 0.817 | 0.867 | 0.714 | 0.793 | 0.899 | 0.735 | 0.773 | 0.946 | |||
| 均值 | 0.800 | 0.859 | 0.930 | 0.807 | 0.870 | 0.926 | 0.802 | 0.853 | 0.939 | 0.770 | 0.806 | 0.952 | |||
注:GDE、PTE、SE分别表示绿色发展效率、纯技术效率、规模效率。 |
表3 2005—2017年黄河流域全局莫兰指数Tab. 3 The Global Moran's I of the Yellow River Basin in 2005-2017 |
| 指数 | 年份 | ||||||||||||
|---|---|---|---|---|---|---|---|---|---|---|---|---|---|
| 2005 | 2006 | 2007 | 2008 | 2009 | 2010 | 2011 | 2012 | 2013 | 2014 | 2015 | 2016 | 2017 | |
| I | 0.223 | 0.258 | 0.526 | 0.424 | 0.360 | 0.337 | 0.310 | 0.300 | 0.306 | 0.410 | 0.347 | 0.150 | 0.212 |
| P | 0.001 | 0.000 | 0.000 | 0.000 | 0.000 | 0.000 | 0.000 | 0.000 | 0.000 | 0.000 | 0.000 | 0.018 | 0.001 |
表4 黄河流域绿色发展效率影响因素的回归结果Tab. 4 Regression results of factors influencing green development efficiency in the Yellow River Basin |
| 变量 | 黄河流域 | 上游地区 | 中游地区 | 下游地区 | |||||||||||
|---|---|---|---|---|---|---|---|---|---|---|---|---|---|---|---|
| Coef. | std.Err. | Sig.t | Coef. | std.Err. | Sig.t | Coef. | std.Err. | Sig.t | Coef. | std.Err. | Sig.t | ||||
| x1 | 0.000 | 0.001 | 0.059 | 0.000 | 0.002 | 0.047 | 0.000 | 0.001 | 0.001 | 0.002 | 0.002 | 0.099 | |||
| x2 | 0.004 | 0.001 | 0.001 | 0.005 | 0.002 | 0.008 | 0.003 | 0.003 | 0.330 | 0.001 | 0.002 | 0.532 | |||
| x3 | -0.010 | 0.003 | 0.038 | -0.020 | 0.008 | 0.003 | 0.002 | 0.006 | 0.712 | -0.010 | 0.005 | 0.244 | |||
| x4 | 0.001 | 0.001 | 0.632 | 0.001 | 0.002 | 0.394 | 0.006 | 0.002 | 0.017 | -0.010 | 0.005 | 0.038 | |||
| x5 | 0.001 | 0.000 | 0.013 | 0.003 | 0.001 | 0.001 | 0.000 | 0.001 | 0.046 | 0.001 | 0.001 | 0.032 | |||
| cons | 2.564 | 0.426 | 0.000 | 3.675 | 0.891 | 0.000 | 2.567 | 0.747 | 0.001 | 0.611 | 0.752 | 0.417 | |||
注:Coef、std.Err、Sig.t分别为回归系数、标准误和t值。 |
| [1] |
郭付友, 佟连军, 刘志刚, 等. 山东省产业生态化时空分异特征与影响因素: 基于17地市时空面板数据. 地理研究, 2019, 38(9):2226-2238.
[
|
| [2] |
鲍超. 中国城镇化与经济增长及用水变化的时空耦合关系. 地理学报, 2014, 69(12):1799-1809.
[
|
| [3] |
徐传谌, 王鹏, 崔悦, 等. 城镇化水平、产业结构与经济增长: 基于中国2000-2015年数据的实证研究. 经济问题, 2017, (6):26-29.
[
|
| [4] |
胡鞍钢, 周绍杰. 绿色发展: 功能界定、机制分析与发展战略. 中国人口·资源与环境, 2014, 24(1):14-20.
[
|
| [5] |
郭付友, 侯爱玲, 佟连军, 等. 振兴以来东北限制开发区绿色发展水平时空分异与影响因素. 经济地理, 2018, 38(8):58-66.
[
|
| [6] |
杨志江, 文超祥. 中国绿色发展效率的评价与区域差异. 经济地理, 2017, 37(3):10-18.
[
|
| [7] |
穆学英, 刘凯, 任建兰. 中国绿色生产效率区域差异及空间格局演变. 地理科学进展, 2017, 36(8):1006-1014.
[
|
| [8] |
|
| [9] |
钱争鸣, 刘晓晨. 中国绿色经济效率的区域差异与影响因素分析. 中国人口·资源与环境, 2013, 23(7):104-109.
[
|
| [10] |
王军, 耿建. 中国绿色经济效率的测算及实证分析. 经济问题, 2014, (4):52-55.
[
|
| [11] |
|
| [12] |
|
| [13] |
|
| [14] |
盖美, 刘丹丹, 曲本亮. 中国沿海地区绿色海洋经济效率时空差异及影响因素分析. 生态经济, 2016, 32(12):97-103.
[
|
| [15] |
林晓, 徐伟, 杨凡, 等. 东北老工业基地绿色经济效率的时空演变及影响机制: 以辽宁省为例. 经济地理, 2017, 37(5):125-133.
[
|
| [16] |
|
| [17] |
吴旭晓. 区域工业绿色发展效率动态评价及提升路径研究: 以重化工业区域青海、河南和福建为例. 生态经济, 2016, 32(2):63-68.
[
|
| [18] |
车磊, 白永平, 周亮, 等. 中国绿色发展效率的空间特征及溢出分析. 地理科学, 2018, 38(11):1788-1798.
[
|
| [19] |
李汝资, 刘耀彬. 1978年以来中国省际全要素生产率时空演变特征研究. 华东经济管理, 2016, 30(7):57-62.
[
|
| [20] |
聂玉立, 温湖炜. 中国地级以上城市绿色经济效率实证研究. 中国人口·资源与环境, 2015, 25(5):409-413.
[
|
| [21] |
李汝资, 刘耀彬, 王文刚, 等. 长江经济带城市绿色全要素生产率时空分异及区域问题识别. 地理科学, 2018, 38(9):1475-1482.
[
|
| [22] |
|
| [23] |
|
| [24] |
|
| [25] |
|
| [26] |
王晓云, 魏琦, 杨秀平. 城市绿色经济效率动态评价及影响因素: 基于285个地级以上城市数据的分析. 生态经济, 2017, 33(2):68-71.
[
|
| [27] |
周亮, 车磊, 周成虎. 中国城市绿色发展效率时空演变特征及影响因素. 地理学报, 2019, 74(10):2027-2044.
[
|
| [28] |
刘杨, 杨建梁, 梁媛. 中国城市群绿色发展效率评价及均衡特征. 经济地理, 2019, 39(2):110-117.
[
|
| [29] |
叶仁道, 张勇, 罗堃. 中国绿色经济效率的测算及影响因素: 基于偏正态面板数据模型. 技术经济, 2017, 36(11):79-85.
[
|
| [30] |
王兵, 吴延瑞, 颜鹏飞. 中国区域环境效率与环境全要素生产率增长. 经济研究, 2010, 45(5):95-109.
[
|
| [31] |
袁鹏, 程施. 中国工业环境效率的库兹涅茨曲线检验. 中国工业经济, 2011, (2):79-88.
[
|
| [32] |
张文博, 邓玲, 尹传斌. “一带一路”主要节点城市的绿色经济效率评价及影响因素分析. 经济问题探索, 2017, (11):84-90.
[
|
| [33] |
|
| [34] |
刘耀彬, 袁华锡, 王喆. 文化产业集聚对绿色经济效率的影响: 基于动态面板模型的实证分析. 资源科学, 2017, 39(4):747-755.
[
|
| [35] |
|
| [36] |
郭艳花, 梅林, 佟连军. 产业集聚对绿色发展效率的影响机制: 以吉林省限制开发区为例. 地理科学, 2020, 40(9):1484-1492.
[
|
| [37] |
赵领娣, 张磊, 徐乐, 等. 资本、产业结构调整与绿色发展效率的作用机制. 中国人口·资源与环境, 2016, 26(11):106-114.
[
|
| [38] |
黄磊, 吴传清. 长江经济带城市工业绿色发展效率及其空间驱动机制研究. 中国人口·资源与环境, 2019, 29(8):40-49.
[
|
| [39] |
|
| [40] |
狄乾斌, 梁倩颖. 中国海洋生态效率时空分异及其与海洋产业结构响应关系识别. 地理科学, 2018, 38(10):1606-1615.
[
|
| [41] |
孙才志, 姜坤, 赵良仕. 中国水资源绿色效率测度及空间格局研究. 自然资源学报, 2017, 32(12):1999-2011.
[
|
| [42] |
汪芳, 安黎哲, 党安荣, 等. 黄河流域人地耦合与可持续人居环境. 地理研究, 2020, 39(8):1707-1724.
[
|
| [43] |
陆大道, 孙东琪. 黄河流域的综合治理与可持续发展. 地理学报, 2019, 74(12):2431-2436.
[
|
| [44] |
樊杰, 王亚飞, 王怡轩. 基于地理单元的区域高质量发展研究: 兼论黄河流域同长江流域发展的条件差异及重点. 经济地理, 2018, 38(5):117-125.
[
|
| [45] |
李敏纳, 蔡舒, 张慧蓉, 等. 要素禀赋与黄河流域经济空间分异研究. 经济地理, 2011, 31(1):16-22.
[
|
| [46] |
张鹏岩, 李颜颜, 康国华, 等. 黄河流域县域经济密度测算及空间分异研究. 中国人口·资源与环境, 2017, 27(8):128-135.
[
|
| [47] |
周晓艳, 郝慧迪, 叶信岳, 等. 黄河流域区域经济差异的时空动态分析. 人文地理, 2016, 31(5):119-125.
[
|
| [48] |
|
| [49] |
赵林, 张宇硕, 吴迪, 等. 考虑非期望产出的中国省际海洋经济效率测度及时空特征. 地理科学, 2016, 36(5):671-680.
[
|
| [50] |
|
| [51] |
国家统计局. 中国城市统计年鉴. 北京: 中国统计出版社, 2006-2018.
[National Bureau of Statistics of China. China Urban Statistical Yearbook. Beijing: China Statistics Press, 2006-2018.]
|
| [52] |
忻州市统计局. 忻州统计年鉴. 北京: 中国统计出版社, 2006-2018.
[Xinzhou Bureau of Statistics of China. Xinzhou Statistical Yearbook. Beijing: China Statistics Press, 2006-2018.]
|
| [53] |
吕梁市统计局. 吕梁统计年鉴. 北京: 中国统计出版社, 2006-2018.
[Lvliang Bureau of Statistics of China. Lvliang Statistical Yearbook. Beijing: China Statistics Press, 2006-2018.]
|
| [54] |
呼和浩特市统计局. 呼和浩特市经济统计年鉴. 北京: 中国统计出版社, 2006-2018.
[Hohhot Bureau of Statistics of China. Hohhot Economic Statistical Yearbook. Beijing: China Statistics Press, 2006-2018.]
|
/
| 〈 |
|
〉 |