
外部性视角下中国城市网络演化及其环境效应研究
|
周宏浩(1991-),男,黑龙江讷河人,博士研究生,主要从事区域经济增长与可持续发展研究。E-mail: zhouhh1208@163.com |
收稿日期: 2021-07-01
录用日期: 2021-12-22
网络出版日期: 2022-03-10
基金资助
教育部人文社会科学研究规划基金项目(21YJA790035)
版权
The evolution of China's city network and its environmental effects from the perspective of externalities
Received date: 2021-07-01
Accepted date: 2021-12-22
Online published: 2022-03-10
Copyright
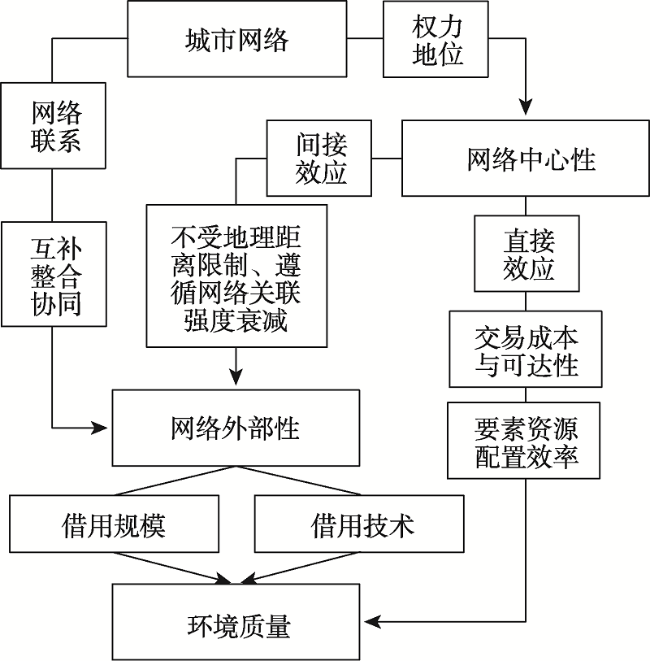
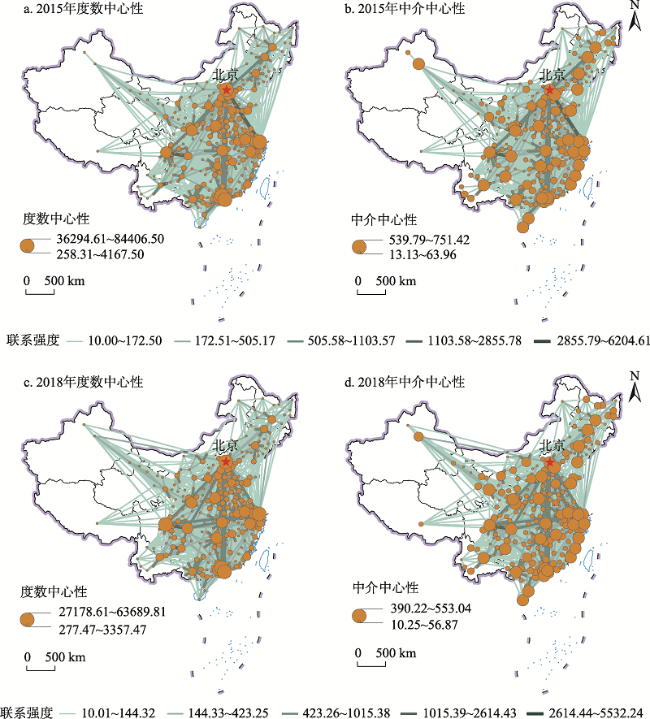
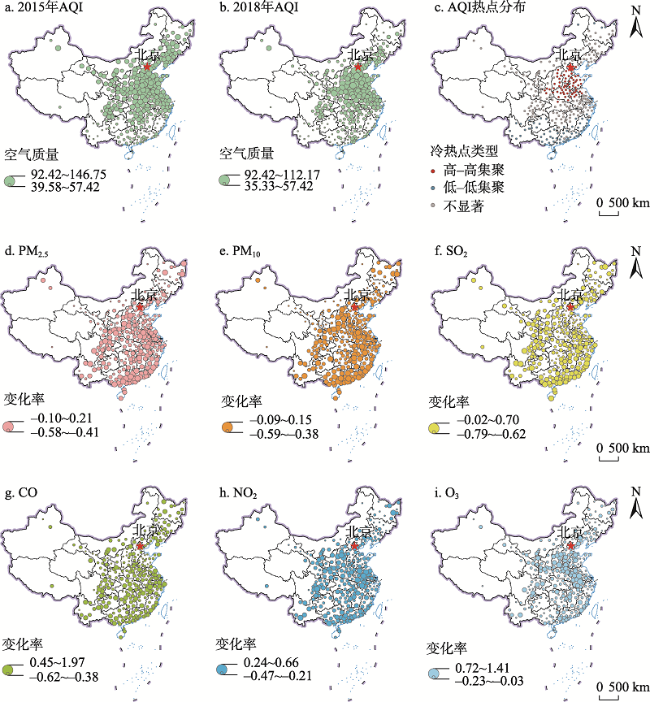
在全球化、快速城市化和新技术革命的背景下,要素流与网络关系构成的“流空间”愈发重要,城市网络结构不断受到冲击与重塑,人地关系矛盾日益凸显,区域空间组织模式及其环境效应已成为环境经济地理学研究的重要议题。本文利用腾讯位置大数据,构建了2015—2018年288个地级以上城市之间的人口迁徙网络,采用社会网络分析和面板空间计量模型,对中国城市网络演化格局及其环境效应进行实证分析。结论如下:① 中国城市网络联系强度高的城市主要分布在“胡焕庸线”东侧的京津冀、长三角、珠三角和成渝城市群组成的菱形结构;城市网络密度和关联性逐渐增强,度数和中介中心性呈现多中心和分散化的发展趋势。② 中国城市空气质量总体有所好转,空间上呈现显著的集聚特征;88.89%的城市空气质量指数(AQI)下降,PM2.5、PM10、SO2、CO和NO2年均浓度有所下降,而O3年均浓度有所上升。③ 中国城市网络对环境质量的影响主要来源于城市网络外部性所带来的空间溢出效应;城市网络中节点权力地位和影响力的增强,提高了借用规模和借用技术,从而促进环境质量提升。④ 度数中心性提升了东部、中部和东北地区的环境质量,减少了PM2.5、PM10、SO2和O3的年均浓度,增加了CO的年均浓度;而中介中心性则提高了西部地区的环境质量,降低了NO2的年均浓度。
周宏浩 , 谷国锋 . 外部性视角下中国城市网络演化及其环境效应研究[J]. 地理研究, 2022 , 41(1) : 268 -285 . DOI: 10.11821/dlyj020210573
Under the background of globalization, rapid urbanization and new technological revolution, the "flow space" composed of factor flow and network relationship was becoming more and more important, the city network structure was constantly impacted and reshaped, the contradiction of man-land relations was becoming increasingly prominent, the regional spatial organization patterns and its environmental effect have become an important topic of environmental economic geography research. In this paper, we used Tencent location big data to establish population migration network among 288 China's cities above prefecture level from 2015 to 2018, and employed social network analysis and panel spatial econometric model to empirically analyze the evolution patterns of city network and its environmental effects in China. The results show that: (1) Cities with high connection strength in China's city network are mainly distributed in the rhombus structure consisting of the Beijing-Tianjin-Hebei, Yangtze River Delta, Pearl River Delta, and Chengdu-Chongqing urban agglomerations in the region east of the Hu Huanyong Line. China's city network density and relevance were gradually increasing, and degree centrality and betweenness centrality presented a trend of multi-center and decentralization. (2) On the whole, China's urban air quality has improved, showing significant agglomeration characteristics in space. Ambient Air Quality Index (AQI) decreased in 256 cities (88.89% of the country's total number). The annual average concentrations of PM2.5, PM10, SO2, CO, and NO2 declined while that of O3 increased. (3) The impact of China's city network on environmental quality were mainly due to the spatial spillover effect brought by the externality of the city network. The enhancement of the city's degree centrality could increase the ability of the borrowing size and borrowing technology to gain development advantages, thereby promoting the improvement of environmental quality. (4) The upgrade of city's degree centrality has improved the environmental quality of the eastern, central and northeastern regions, reducing the annual average concentration of PM2.5, PM10, SO2 and O3, but that of CO was increasing, while the enhancement of city's betweenness centrality has improved the environmental quality of the western region and significantly reduced the annual average concentration of NO2.
表1 无空间交互作用的面板计量模型检验Tab. 1 Test of panel econometric model without spatial interaction effects |
| 变量与统计量 | Wnet | Wkm | Wq | |||||
|---|---|---|---|---|---|---|---|---|
| 混合估计 | 时空固定效应 | 混合估计 | 时空固定效应 | 混合估计 | 时空固定效应 | |||
| deg | 0.109*** | -0.158*** | 0.109*** | -0.158*** | 0.109*** | -0.158*** | ||
| (9.638) | (-5.776) | (9.638) | (-5.776) | (9.638) | (-5.776) | |||
| bet | -0.053*** | -0.011 | -0.053*** | -0.011 | -0.053*** | -0.011 | ||
| (-5.935) | (-1.378) | (-5.935) | (-1.378) | (-5.935) | (-1.378) | |||
| 控制变量 | 控制 | 控制 | 控制 | 控制 | 控制 | 控制 | ||
| LM lag | 1866.271*** | 896.008*** | 2544.057*** | 964.033*** | 1393.548*** | 625.151*** | ||
| Robust LM lag | 32.216*** | 43.988*** | 55.450*** | 61.736*** | 92.753*** | 53.047*** | ||
| LM error | 2026.926*** | 854.748*** | 3098.942*** | 905.587*** | 1355.713*** | 574.181*** | ||
| Robust LM error | 192.872*** | 2.728* | 610.335*** | 3.290* | 54.919*** | 2.077 | ||
| LR spatial | 2686.759*** | |||||||
| LR time | 479.967*** | |||||||
注:LM和Robust LM分别表示拉格朗日乘数检验及其稳健检验,LR表示似然比检验;***与*分别表示1%与10%的显著性水平;括号中数字表示对应的统计量。 |
表2 基于偏误校正的空间和时间固定效应SDM估计结果Tab. 2 Estimation results of spatial Durbin model from spatial and temporal fixed effect based on bias correction |
| 变量与 统计量 | Wnet | Wkm | Wq | |||||
|---|---|---|---|---|---|---|---|---|
| Main | Wx | Main | Wx | Main | Wx | |||
| deg | -0.055* | -0.065 | -0.122*** | 0.033 | -0.096*** | 0.007 | ||
| (-1.646) | (-1.044) | (-3.644) | (0.514) | (-2.795) | (0.145) | |||
| bet | -0.003 | -0.014 | -0.004 | 0.017 | -0.007 | 0.008 | ||
| (-0.361) | (-0.659) | (-0.544) | (0.688) | (-0.975) | (0.57) | |||
| ρ | 0.797*** | 0.895*** | 0.657*** | |||||
| (32.670) | (41.414) | (25.695) | ||||||
| 控制变量 | 控制 | 控制 | 控制 | |||||
| R2 | 0.966 | 0.963 | 0.963 | |||||
| Log L | 1813.681 | 1776.215 | 1755.637 | |||||
| Wald lag | 18.675** | 22.302** | 17.122* | |||||
| LR lag | 25.044*** | 30.139*** | 22.665** | |||||
| Wald error | 22.200** | 16.585* | 21.554** | |||||
| LR error | 26.982*** | 23.508*** | 28.527*** | |||||
| Hausman | 73.499*** | 81.339*** | 97.267*** | |||||
注:Wald lag和Wald error分别表示滞后和误差模型的Wald检验,LR lag和LR error分别表示滞后和误差模型的LR检验,Hausman表示Hausman检验;***、**与*分别表示1%、5%与10%的显著性水平;括号中数字表示对应的统计量。 |
表3 基于面板SDM的空间效应分解Tab. 3 Spatial effect decomposition of spatial Durbin model based on panel data |
| 变量 | Wnet | Wkm | Wq | |||||
|---|---|---|---|---|---|---|---|---|
| 直接效应 | 间接效应 | 直接效应 | 间接效应 | 直接效应 | 间接效应 | |||
| deg | -0.071**(-2.243) | -0.519**(-2.310) | -0.109***(-3.273) | -0.150(-1.640) | -0.133***(-4.124) | -0.724(-1.450) | ||
| bet | -0.005(-0.619) | -0.08(-0.806) | -0.007(-0.807) | 0.008(0.215) | -0.002(-0.250) | 0.127(0.528) | ||
| pd | -0.021(-0.123) | 3.487**(2.384) | 0.021(0.116) | 1.773***(2.785) | 0.027(0.151) | 7.714*(1.926) | ||
| pgdp | 0.065(1.373) | 0.553(1.605) | 0.100**(2.099) | 0.245(1.601) | 0.034(0.736) | 0.679(0.786) | ||
| sci | 0.005(0.734) | -0.052(-0.638) | 0.007(0.894) | 0.002(0.071) | 0.007(0.934) | -0.023(-0.116) | ||
| gov | -0.018(-0.501) | -0.317(-0.787) | -0.015(-0.435) | 0.026(0.166) | -0.026(-0.693) | 0.310(0.308) | ||
| gdgdp | 0.004(0.292) | -0.033(-0.346) | -0.018(-1.411) | 0.072(1.602) | -0.035***(-2.677) | 0.367(1.31) | ||
| ind | -0.028(-0.997) | 0.155(0.577) | -0.024(-0.85) | 0.015(0.134) | -0.036(-1.245) | 0.256(0.362) | ||
| hrs | 0.015(1.285) | 0.254*(1.797) | 0.007(0.561) | -0.007(-0.133) | 0.009(0.756) | 0.441(1.133) | ||
| str | 0.017(0.562) | 0.872*(1.776) | 0.057*(1.674) | 0.433**(2.462) | 0.061*(1.933) | 2.003**(2.117) | ||
注:***、**与*分别表示1%、5%与10%的显著性水平;括号中数字表示对应的统计量。 |
表4 基于面板SDM的作用机制分析Tab. 4 Mechanism analysis of spatial Durbin model based on panel data |
| 变量 | wsize | AQI | wpat | AQI | |
|---|---|---|---|---|---|
| deg | 直接效应 | 1.131***(0.036) | -0.069**(0.029) | 1.257***(0.099) | -0.062**(0.028) |
| 间接效应 | -0.168**(0.085) | -0.529**(0.214) | 0.189(0.288) | -0.488**(0.208) | |
| bet | 直接效应 | 0.025***(0.007) | -0.001(0.007) | 0.035*(0.021) | -0.005(0.007) |
| 间接效应 | 0.054(0.036) | 0.014(0.097) | 0.012(0.129) | -0.076(0.086) | |
| wsize | 直接效应 | -0.054**(0.027) | |||
| 间接效应 | -0.730**(0.332) | ||||
| wpat | 直接效应 | -0.036***(0.009) | |||
| 间接效应 | -0.201**(0.097) | ||||
注:***、**与*分别表示1%、5%与10%的显著性水平;括号中数字表示对应的统计量。 |
表5 区域异质性分析Tab. 5 Analysis of regional heterogeneity |
| 变量 | 东部AQI | 中部AQI | 西部AQI | 东北AQI | |
|---|---|---|---|---|---|
| deg | 直接效应 | -0.070(-1.480) | -0.027(-0.480) | -0.094*(-1.953) | -0.172*(-1.848) |
| 间接效应 | -0.712***(-2.714) | -0.631**(-2.270) | 0.008(0.029) | -0.700*(-1.692) | |
| bet | 直接效应 | -0.008(-0.544) | 0.007(0.373) | -0.018(-1.426) | 0.055**(2.271) |
| 间接效应 | 0.140(0.750) | 0.376(1.568) | -0.430***(-3.053) | 0.458(1.566) | |
注:***、**与*分别表示1%、5%与10%的显著性水平;括号中数字表示对应的统计量。 |
表6 AQI分指数异质性分析Tab. 6 Analysis of AQI sub-index heterogeneity |
| 变量 | PM2.5 | PM10 | SO2 | CO | NO2 | O3 | |
|---|---|---|---|---|---|---|---|
| deg | 直接效应 | -0.152***(0.043) | -0.081**(0.039) | 0.005(0.081) | 0.107*(0.056) | -0.020(0.042) | -0.029(0.041) |
| 间接效应 | -0.516***(0.176) | -0.529***(0.179) | -0.725**(0.284) | -0.114(0.144) | -0.129(0.123) | -0.339***(0.126) | |
| bet | 直接效应 | -0.003(0.010) | -0.007(0.009) | -0.007(0.018) | -0.011(0.012) | -0.022**(0.009) | 0.001(0.009) |
| 间接效应 | -0.013(0.081) | -0.117(0.085) | 0.058(0.127) | 0.039(0.063) | 0.002(0.055) | 0.057(0.056) | |
注:***、**与*分别表示1%、5%与10%的显著性水平;括号中数字表示对应的统计量。 |
表7 基于面板SDM的稳健性检验Tab. 7 Robust test of spatial Durbin model based on panel data |
| 变量 | 工业二氧化硫排放量 | 工业二氧化硫排放强度 | |
|---|---|---|---|
| deg | 直接效应 | 0.279(0.226) | 0.292(0.224) |
| 间接效应 | -0.758*(0.456) | -0.760*(0.456) | |
| bet | 直接效应 | 0.006(0.045) | 0.006(0.045) |
| 间接效应 | -0.070(0.182) | -0.077(0.182) | |
注:* 表示10%的显著性水平;括号中数字表示对应的统计量。 |
| [1] |
贺灿飞, 周沂. 环境经济地理研究. 北京: 科学出版社, 2016: 1-7.
[
|
| [2] |
孙斌栋, 王婷, 刘鹏飞. 中国城市群空间结构演化的影响因素分析: 基于铁路客运的功能联系视角. 人文地理, 2019, 34(5):78-84.
[
|
| [3] |
席强敏, 李国平. 超大城市规模与空间结构效应研究评述与展望. 经济地理, 2018, 38(1):61-68.
[
|
| [4] |
周春山, 叶昌东. 中国城市空间结构研究评述. 地理科学进展, 2013, 32(7):1030-1038.
[
|
| [5] |
|
| [6] |
秦蒙, 刘修岩, 仝怡婷. 蔓延的城市空间是否加重了雾霾污染: 来自中国PM2.5数据的经验分析. 财贸经济, 2016, (11):146-160.
[
|
| [7] |
潘峰华, 方成, 李仙德. 中国城市网络研究评述与展望. 地理科学, 2019, 39(7):1093-1101.
[
|
| [8] |
方创琳, 周成虎, 顾朝林, 等. 特大城市群地区城镇化与生态环境交互耦合效应解析的理论框架及技术路径. 地理学报, 2016, 71(4):531-550.
[
|
| [9] |
胡志强, 苗长虹, 袁丰. 集聚空间组织型式对中国地市尺度工业SO2排放的影响. 地理学报, 2019, 74(10):2045-2061.
[
|
| [10] |
王录仓, 刘海洋, 刘清. 基于腾讯迁徙大数据的中国城市网络研究. 地理学报, 2021, 76(4):853-869.
[
|
| [11] |
吴康, 方创琳, 赵渺希. 中国城市网络的空间组织及其复杂性结构特征. 地理研究, 2015, 34(4):711-728.
[
|
| [12] |
程玉鸿, 苏小敏. 城市网络外部性研究述评. 地理科学进展, 2021, 40(4):713-720.
[
|
| [13] |
|
| [14] |
|
| [15] |
张可. 经济集聚的减排效应: 基于空间经济学视角的解释. 产业经济研究, 2018, (3):64-76.
[
|
| [16] |
张姗姗, 张磊, 张落成, 等. 苏南太湖流域污染企业集聚与水环境污染空间耦合关系. 地理科学, 2018, 38(6):954-962.
[
|
| [17] |
|
| [18] |
|
| [19] |
林柄全, 谷人旭, 王俊松, 等. 从集聚外部性走向跨越地理边界的网络外部性: 集聚经济理论的回顾与展望. 城市发展研究, 2018, 25(12):82-89.
[
|
| [20] |
|
| [21] |
|
| [22] |
|
| [23] |
陆军, 毛文峰. 城市网络外部性的崛起: 区域经济高质量一体化发展的新机制. 经济学家, 2020, (12):62-70.
[
|
| [24] |
姚常成, 宋冬林. 借用规模、网络外部性与城市群集聚经济. 产业经济研究, 2019, (2):76-87.
[
|
| [25] |
|
| [26] |
|
| [27] |
孙东琪, 张京祥, 胡毅, 等. 基于产业空间联系的“大都市阴影区”形成机制解析: 长三角城市群与京津冀城市群的比较研究. 地理科学, 2013, 33(9):1043-1050.
[
|
| [28] |
|
| [29] |
盛科荣, 王丽萍, 孙威. 网络权力、知识溢出对中国城市绿色经济效率的影响. 资源科学, 2021, 43(8):1509-1521.
[
|
| [30] |
张可. 环境污染对城市网络结构的影响研究. 社会科学, 2016, (12):46-58.
[
|
| [31] |
|
| [32] |
|
| [33] |
陈旭, 张亮, 张硕. 多中心空间发展模式与雾霾污染: 基于中国城市数据的经验研究. 重庆大学学报(社会科学版), 2021, 27(5):30-44.
[
|
| [34] |
丁如曦, 刘梅, 李东坤. 多中心城市网络的区域经济协调发展驱动效应: 以长江经济带为例. 统计研究, 2020, 37(11):93-105.
[
|
| [35] |
|
| [36] |
袁华锡, 刘耀彬, 胡森林, 等. 产业集聚加剧了环境污染吗: 基于外商直接投资视角. 长江流域资源与环境, 2019, 28(4):794-804.
[
|
| [37] |
张华, 冯烽. 绿色高铁: 高铁开通能降低雾霾污染吗?. 经济学报, 2019, 6(3):114-147.
[
|
| [38] |
邓慧慧, 杨露鑫. 雾霾治理、地方竞争与工业绿色转型. 中国工业经济, 2019, (10):118-136.
[
|
| [39] |
|
| [40] |
周宏浩, 谷国锋. 东北地区城市空间结构演进对环境影响的空间效应及门槛特征. 经济地理, 2021, 41(2):62-71.
[
|
| [41] |
张伟丽, 叶信岳, 李栋, 等. 网络关联、空间溢出效应与中国区域经济增长: 基于腾讯位置大数据的研究. 地理科学, 2019, 39(9):1371-1377.
[
|
| [42] |
潘竟虎, 赖建波. 中国城市间人口流动空间格局的网络分析: 以国庆-中秋长假和腾讯迁徙数据为例. 地理研究, 2019, 38(7):1678-1693.
[
|
| [43] |
魏石梅, 潘竟虎. 中国地级及以上城市网络结构韧性测度. 地理学报, 2021, 76(6):1394-1407.
[
|
| [44] |
盛科荣, 张红霞, 赵超越. 中国城市网络关联格局的影响因素分析: 基于电子信息企业网络的视角. 地理研究, 2019, 38(5):1030-1044.
[
|
| [45] |
李琬, 孙斌栋, 刘倩倩, 等. 中国市域空间结构的特征及其影响因素. 地理科学, 2018, 38(5):672-680.
[
|
| [46] |
程雪雁, 朱磊, 周艺萱. 2015-2018年京津冀城市群空气污染时空变化特征. 北京师范大学学报(自然科学版), 2019, 55(4):523-531.
[
|
| [47] |
肖嘉玉, 何超, 慕航, 等. 中国城市空气污染时空分布格局和人口暴露风险. 地理科学进展, 2021, 40(10):1650-1663.
[
|
| [48] |
|
| [49] |
|
| [50] |
|
/
| 〈 |
|
〉 |