
电商快递包装箱的碳足迹空间分解和隐含碳转移研究
|
余金艳(1986-),女,四川资中人,博士,副教授,硕士生导师,研究方向为经济地理、区域发展和信息化等。E-mail: jinyanyu@gmail.com |
收稿日期: 2021-05-26
录用日期: 2021-08-27
网络出版日期: 2022-03-10
基金资助
国家自然科学基金项目(42101180)
北京市教育委员会科研计划一般项目(SM202110031001)
版权
Study on the spatial decomposition of carbon footprint and the embodied carbon emission transfer of the e-commerce express box
Received date: 2021-05-26
Accepted date: 2021-08-27
Online published: 2022-03-10
Copyright
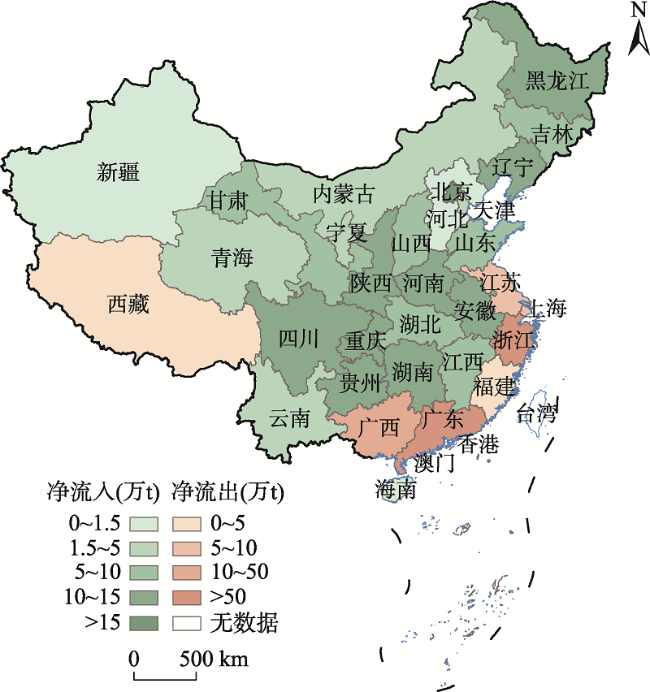
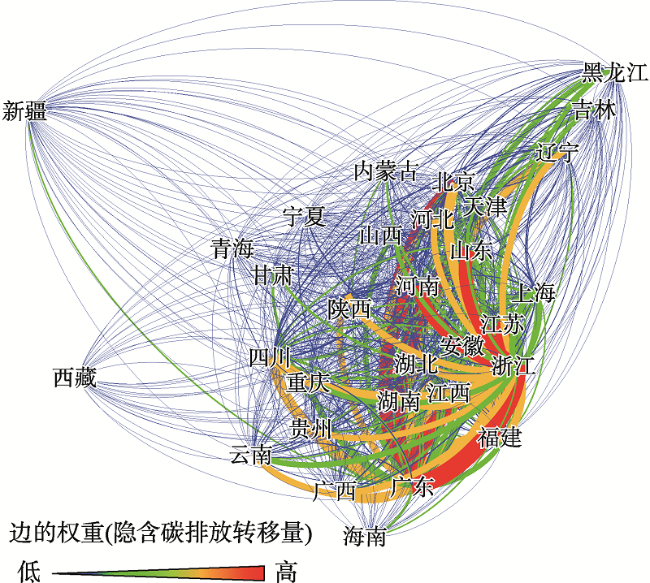
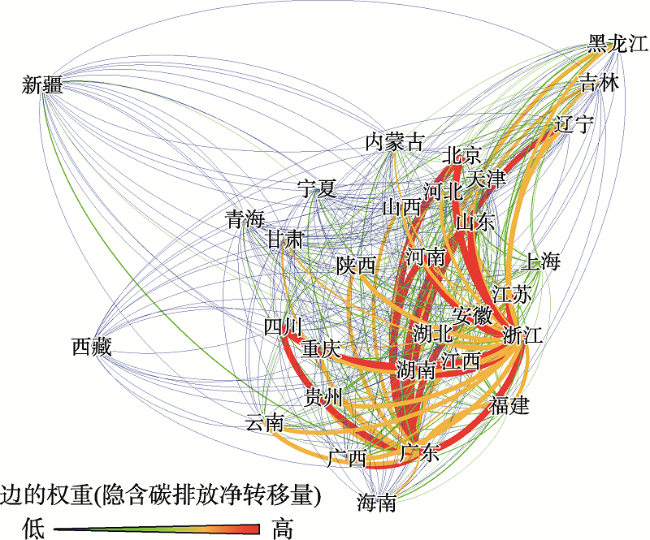
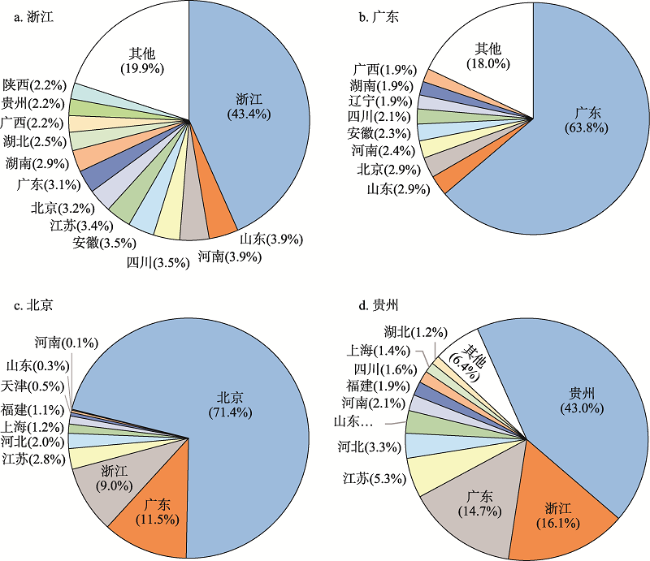
伴随电子商务等新兴消费业态的迅猛发展,其碳排放量已不容忽视。本研究从空间分解和隐含碳转移的角度,基于对电商快递包装箱全生命周期的碳足迹研究,识别其在原料、生产、利用各环节与电商行为的地理空间耦合,分析各阶段及总排放的省域尺度格局特征,以及伴随快递流的隐含碳转移网络格局。研究发现:原料阶段的碳排放多在木材原料商区位,生产阶段的碳排放和快递发货区位高度耦合,利用阶段的碳排放和快递收货区位相耦合。全国电商快递包装箱各阶段的碳排放在空间上高度集聚,原料阶段集中在广西,生产和利用阶段集中在广东、浙江、江苏,整体呈现出“东多西少、南多北少”的空间特征。碳排放总量较高的省区多由生产驱动,碳排放总量越少的省区则利用驱动越明显。隐含碳转移网络呈现出“少数省区净流出、多数省区净流入”的“轴辐式”结构特征,浙江、广东两省承担了80%左右的净流出,是绝大多数省区隐含碳流入的最大来源地,北京是净流入最大的省区。基于隐含碳转移进行碳排放责任辨析,是相关决策需要考虑的重要因素;绿色包装的减排贡献较大,亟待寻求技术突破;新兴消费业态的碳排放值得长期关注。
余金艳 , 张英男 , 刘卫东 , 王垚 , 姜懿轩 , 张亚辉 . 电商快递包装箱的碳足迹空间分解和隐含碳转移研究[J]. 地理研究, 2022 , 41(1) : 92 -110 . DOI: 10.11821/dlyj020210446
E-commerce and other new forms of consumption have developed rapidly in recent years, and their impact on carbon emissions can not be ignored. In terms of the spatial decomposition and the embodied carbon transfer, based on the research of the carbon footprint in the e-commerce express box life cycle, we study the geographic spatial couplings between the e-commerce behavior and carbon footprint in the raw material production, manufacture and consumption stages, and analyse the pattern characteristics of the emissions by stage and aggregate at provincial level, and the network layout of the embodied carbon emission transfer with the express flow. The results show that the carbon emissions in the raw material stage are mostly in the location of wood raw material suppliers, while the carbon emissions in the production stage are highly coupled with the location of express delivery, and the carbon emissions in the utilization stage are coupled with the location of express receiving area. The carbon emissions of e-commerce express box cartons in China of every stage are highly concentrated. The carbon emissions in the raw material stage are mainly concentrated in Guangxi, while in the production and consumption stages are concentrated in Guangdong, Zhejiang and Jiangsu, showing a general distribution pattern of "more in the eastern region and less in the western region; more in the southern region and less in the northern region". Provinces with higher total carbon emissions are mostly driven by production, while provinces with lower total carbon emissions are mostly driven by consumption. The embodied carbon emission transfer network presents a "hub-and-spoke" structure of "net outflow in few provinces, while net inflow in most provinces". Zhejiang and Guangdong, accounting for about 80% of the net outflow, are the largest places of departure of the embodied carbon emission inflow of most provinces, while Beijing is the sample with the largest net inflow. The division of responsibilities based on the embodied carbon emission transfer is an important factor of management decision, while the green packaging has made a great contribution to emission reduction, so it is urgent to seek technological breakthrough, and the carbon emissions of new consumption forms deserve long-term attention.
表1 包装箱碳足迹各阶段比例Tab.1 Proportion of each stage of packing box carbon footprint |
| 原料阶段(%) | 生产阶段(%) | 利用阶段(%) | 运输阶段(%) | 参考来源 |
|---|---|---|---|---|
| 9.17 | 56.31 | 34.52 | 未计入 | 文献[46] |
| 未计入 | 99.65 | 未计入 | 未计入 | 文献[47] |
| 7.80 | 82.10 | 10.10 | 未计入 | 文献[48] |
| 85.54 | 14.46 | 分别计入各阶段 | 文献[49] | |
| 13.00 | 81.00 | 5.00 | 1.00 | 产品1碳标字第1004818001号 |
| 23.40 | 73.40 | 2.00 | 1.20 | 产品2碳标字第1304818001号 |
| 10.00 | 60.00 | 30.00 | 未计入 | 本文计算标准 |
注:文献[49]中,85.54%为原料阶段和生产阶段之和;产品1和2的标记数据来源(网址:cfp.epa.gov.tw)。 |
表2 碳足迹与电商行为空间耦合Tab.2 Spatial coupling between carbon footprint and e-commerce behavior |
| 主体空间行为 | 碳足迹区位 | |
|---|---|---|
| 原料阶段 | 原料商生产原料 | 原料商静态区位 |
| 生产阶段 | 生产商生产纸箱 | 生产商静态区位 |
| 运输阶段 | 销售商购买纸箱 销售商发货消耗纸箱 | 生产商到销售商动态区位(B2B、B2C) 销售商到消费者动态区位(B2C、C2C) |
| 利用阶段 | 消费者最终处置 | 消费者静态区位 |
注:B2B是Business-to-Business的缩写,是指企业与企业之间;B2C是Business-to- Consumer的缩写,是指企业与个人之间;C2C是Consumer-to-Consumer的缩写,是指个人与个人之间。 |
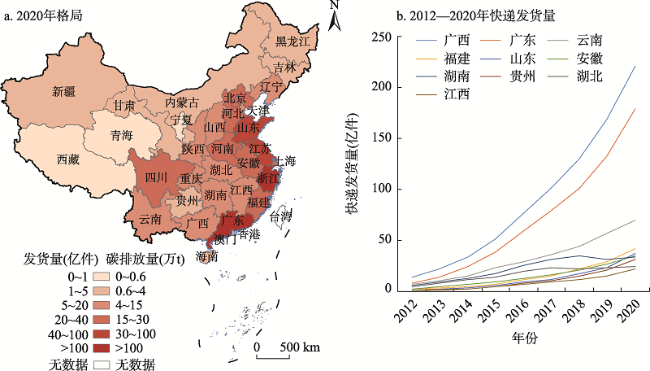
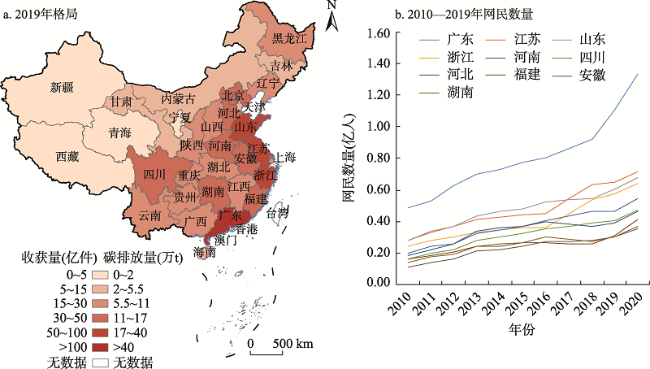
图5 快递收货量-利用阶段碳足迹格局注:该图基于自然资源部地图技术审查中心标准地图(审图号为GS(2019)1697号)制作,底图无修改;数据来源于快递收货量无统计数据,根据本研究样本收货比例估算而来。网民数量数据主要来源于中国互联网络信息中心(CNNIC)的《中国互联网络发展状况统计报告》(http://www.cnnic.net.cn/hlwfzyj/hlwxzbg/);2017年及以后的网民数据结合百度统计(https://tongji.baidu.com/research/site#profile)估算。受图幅限制,b图仅选网民数量前10名省份展示,其余省份网民数量数据在0.0053亿~0.3545亿人之间。 Fig. 5 Spatial pattern of express receipt volume and carbon footprint in utilization stage |
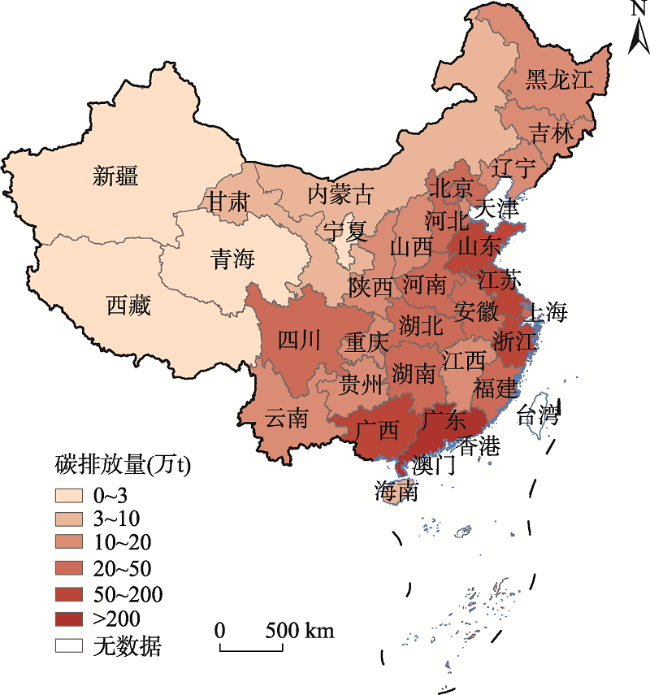
表3 2020年分省快递包装箱碳排放量汇总(万t CO2e)Tab.3 Summary of carbon emissions of express packaging boxes in 2020 (104 t CO2e) |
| 省区 | |||||||
|---|---|---|---|---|---|---|---|
| 安徽 | 5.32 | 16.61 | 15.68 | 37.61 | 52.28 | -14.67 | |
| 北京 | 0.18 | 17.97 | 15.72 | 33.87 | 52.42 | -18.54 | |
| 福建 | 6.76 | 25.89 | 12.15 | 44.80 | 40.52 | 4.28 | |
| 甘肃 | 0.06 | 1.04 | 3.40 | 4.50 | 11.33 | -6.82 | |
| 广东 | 9.86 | 166.56 | 44.96 | 221.37 | 149.85 | 71.52 | |
| 广西 | 36.51 | 5.87 | 9.29 | 51.67 | 30.96 | 20.71 | |
| 贵州 | 3.22 | 2.12 | 7.34 | 12.69 | 24.47 | -11.78 | |
| 海南 | 2.18 | 0.83 | 1.90 | 4.91 | 6.33 | -1.42 | |
| 河北 | 1.12 | 27.93 | 12.93 | 41.98 | 43.11 | -1.13 | |
| 河南 | 2.67 | 23.38 | 16.14 | 42.19 | 53.80 | -11.60 | |
| 黑龙江 | 1.62 | 3.43 | 6.67 | 11.72 | 22.24 | -10.52 | |
| 湖北 | 3.17 | 13.46 | 10.46 | 27.09 | 34.86 | -7.77 | |
| 湖南 | 3.45 | 11.10 | 11.60 | 26.15 | 38.65 | -12.51 | |
| 吉林 | 2.14 | 3.37 | 5.36 | 10.87 | 17.86 | -6.99 | |
| 江苏 | 2.43 | 52.62 | 19.50 | 74.55 | 65.00 | 9.56 | |
| 江西 | 2.89 | 8.45 | 8.08 | 19.42 | 26.95 | -7.53 | |
| 辽宁 | 1.12 | 8.45 | 10.16 | 19.72 | 33.86 | -14.14 | |
| 内蒙古 | 0.89 | 1.48 | 2.83 | 5.19 | 9.43 | -4.24 | |
| 宁夏 | 0.00 | 0.55 | 1.34 | 1.89 | 4.46 | -2.57 | |
| 青海 | 0.00 | 0.18 | 0.87 | 1.04 | 2.89 | -1.84 | |
| 山东 | 5.38 | 31.32 | 19.43 | 56.13 | 64.77 | -8.64 | |
| 山西 | 0.27 | 4.04 | 5.96 | 10.27 | 19.86 | -9.59 | |
| 陕西 | 0.22 | 6.92 | 8.96 | 16.10 | 29.86 | -13.76 | |
| 上海 | 0.00 | 25.37 | 8.63 | 34.00 | 28.78 | 5.22 | |
| 四川 | 2.54 | 16.23 | 13.31 | 32.09 | 44.38 | -12.29 | |
| 天津 | 0.32 | 7.00 | 4.11 | 11.43 | 13.71 | -2.27 | |
| 西藏 | 0.10 | 0.09 | 0.03 | 0.22 | 0.10 | 0.12 | |
| 新疆 | 0.66 | 0.87 | 0.89 | 2.41 | 2.96 | -0.55 | |
| 云南 | 7.77 | 4.75 | 6.79 | 19.31 | 22.65 | -3.33 | |
| 浙江 | 1.29 | 135.36 | 22.89 | 159.54 | 76.28 | 83.26 | |
| 重庆 | 0.66 | 5.51 | 6.99 | 13.16 | 23.31 | -10.15 | |
| 合计 | 105 | 629 | 314 | 1047.91 | 1047.91 | 0.00 | |
表4 各省区排放结构分类Tab. 4 Classification of emission structure of each provincial-level region |
| 排放量 (万t CO2e) | 原料驱动型 | 生产驱动型 | 生产利用型 | 利用驱动型 | 均衡型 |
|---|---|---|---|---|---|
| >50 | 广西 | 广东 浙江 江苏、山东 | |||
| (20,50] | 福建 河南 河北上海 北京 四川 湖北 | 安徽 湖南 | |||
| (10,20] | 云南 贵州 | 天津 | 江西 | 辽宁 陕西 重庆 黑龙江 吉林 山西 | |
| (3,10] | 海南 | 内蒙古 甘肃 | |||
| ≤3 | 西藏 | 宁夏 青海 | 新疆 |
注:原料驱动型在原料阶段的碳排放贡献占比(以下简称占比)大于0.25,生产驱动型在生产阶段占比大于0.5,利用驱动型在利用阶段占比大于0.5,生产利用型在生产、利用阶段占比均在0.4至0.5之间,均衡型在原料、生产、利用阶段均占比在0.25至0.4之间。 |
| [1] |
商务部电子商务和信息化司. 中国电子商务报告2019. 北京: 中国商务出版社, 2020: 2-8.
[Department of Electronic Commerce and Information. E-commerce in China 2019. Beijing: China Commerce and Trade Press, 2020: 2-8.]
|
| [2] |
碳阻迹公司. 中国电子商务企业温室气体排放总量研究报告. https://www.carbonstop.net/reports, 2021-05-23.
[Canbonstop Corporation. The GHG emmisions of e-commerce enterprises in China. https://www.carbonstop.net/reports, 2021-05-23.]
|
| [3] |
刘卫东. “中国碳达峰研究”专栏序言. 资源科学, 2021, 43(4):637-638.
[
|
| [4] |
|
| [5] |
杨会菊. 基于低碳经济的电子商务服务提供商物流配送问题的研究. 物流技术, 2012, 31(15):314-315.
[
|
| [6] |
|
| [7] |
侯旭晖. 低碳经济下的中小型茶企业电子商务物流新模式研究. 福建茶叶, 2016, 38(9):66-67.
[
|
| [8] |
|
| [9] |
刘苏奕, 吴思思, 王欣妍, 等. 电商快递包装垃圾造成的污染及回收方案研究: 以北京为例. 现代商业, 2019, 14(15):33-34.
[
|
| [10] |
魏传立, 宗维佳. 黑龙江省快递包装污染问题治理研究. 经济研究导刊, 2021, 17(8):48-50.
[
|
| [11] |
|
| [12] |
王玉燕, 梁佳平, 申亮, 等. 电商平台公平关切下低碳E-CLSC的决策研究. 中国管理科学, 2021, 29(4):115-125.
[
|
| [13] |
2097-02.
|
| [14] |
|
| [15] |
薛星群, 王旭坪, 詹林敏. 电子商务物流最后一公里配送的碳排放研究. 运筹与管理, 2019, 28(12):118-123.
[
|
| [16] |
|
| [17] |
邢宝平, 吕梦圆, 金培权, 等. 面向绿色数据中心的能耗有效查询优化技术. 计算机研究与发展, 2019, 56(9):1821-1831.
[
|
| [18] |
|
| [19] |
那军, 耿译航, 蒋莹, 等. 快递员痰液和鼻腔冲洗液中微塑料污染分析. 中国公共卫生, 2021, 37(3):451-454.
[
|
| [20] |
|
| [21] |
|
| [22] |
方恺. 足迹家族:概念、类型、理论框架与整合模式. 生态学报, 2015, 35(6):1647-1659.
[
|
| [23] |
英国标准协会. PAS2050:2008 商品和服务在生命周期内的温室气体排放评价规范. https://www.bsigroup.com/zh-CN/pas-2050, 2021-05-23.
[British Standards Institution. PAS2050: 2008Specification for the assessment of greenhouse gas emissions during the life cycle of goods and services. https://www.bsigroup.com/zh-CN/pas-2050, 2021-05-23.]
|
| [24] |
|
| [25] |
|
| [26] |
|
| [27] |
碳阻迹公司. 中国线上线下购物温室气体排放对比研究报告.https://www.carbonstop.net/reports, 2021-05-23.
[Canbonstop Corporation. The GHG emmisions of shopping: E-commerce & bricks and mortar in China. https://www.carbonstop.net/reports, 2021-05-23.]
|
| [28] |
|
| [29] |
|
| [30] |
|
| [31] |
沈鸿锴. 中国对外贸易隐含碳排放及区域间碳转移问题研究, 上海: 复旦大学硕士学位论文, 2014: 12-14.
[
|
| [32] |
张晓平, 王兆红, 孙磊. 中国钢铁产品国际贸易流与碳排放跨境转移. 地理研究, 2010, 29(9):1650-1658.
[
|
| [33] |
唐志鹏, 刘卫东, 公丕萍. 出口对中国区域碳排放影响的空间效应测度: 基于1997-2007年区域间投入产出表的实证分析. 地理学报, 2014, 69(10):1403-1413.
[
|
| [34] |
姚秋蕙, 韩梦瑶, 刘卫东. “一带一路”沿线省区隐含碳流动研究. 地理学报, 2018, 73(11):2210-2222.
[
|
| [35] |
石敏俊, 王妍, 张卓颖, 等. 中国各省区碳足迹与碳排放空间转移. 地理学报, 2012, 67(10):1327-1338.
[
|
| [36] |
廖双红, 肖雁飞. 污染产业区域间转移与中部省区碳转移空间特征及启示. 经济地理, 2017, 37(2):132-140.
[
|
| [37] |
钟章奇, 吴乐英, 陈志建, 等. 区域碳排放转移的演变特征与结构分解及减排对策分析: 以河南省为例. 地理科学, 2017, 37(5):773-782.
[
|
| [38] |
王少剑, 黄永源. 中国城市碳排放强度的空间溢出效应及驱动因素. 地理学报, 2019, 74(6):1131-1148.
[
|
| [39] |
刘贤赵, 高长春, 张勇, 等. 中国省域碳强度空间依赖格局及其影响因素的空间异质性研究. 地理科学, 2018, 38(5):681-690.
[
|
| [40] |
程叶青, 王哲野, 张守志, 等. 中国能源消费碳排放强度及其影响因素的空间计量. 地理学报, 2013, 68(10):1418-1431.
[
|
| [41] |
郭忻怡, 闫庆武, 谭晓悦, 等. 基于DMSP/OLS与NDVI的江苏省碳排放空间分布模拟. 世界地理研究, 2016, 25(4):102-110.
[
|
| [42] |
高鸣, 宋洪远. 中国农业碳排放绩效的空间收敛与分异. 经济地理, 2015, 35(4):142-148, 185.
[
|
| [43] |
国家邮政局. 2020 年邮政行业发展统计公报. https://www.mot.gov.cn/tongjishuju/youzheng/202105/t20210519_3594476.html, 2021-05-24.
[State Post Bureau of The People's Repubic of China. Statistical bulletin on the development of the postal industry in 2020. https://www.mot.gov.cn/tongjishuju/youzheng/202105/t20210519_3594476.html, 2021-05-24.]
|
| [44] |
韵达控股股份有限公司. 韵达股份:2020. http://data.eastmoney.com/notices/detail/002120/AN202104291488672185.html, 2021-05-24.
|
| 45 |
[
|
| [45] |
中国互联网络信息中心. 网民量中国互联网络发展状况统计报告. http://www.cnnic.net.cn/hlwfzyj/hlwxzbg, 2021-05-24.
[China Internet Network Information Center. Statistical reports on internet development in China. http://www.cnnic.net.cn/hlwfzyj/hlwxzbg, 2021-05-24.]
|
| [46] |
武钰淳, 付天琴, 薛亮. 基于碳足迹的快递包装研究. 现代工业经济和信息化, 2017, 7(20):45-47.
[
|
| [47] |
袁奇. 运输包装的碳足迹计算. 印刷技术, 2013, 57(10):34-35.
[
|
| [48] |
张清文, 陈曦. 100% OCC生产的箱纸板碳足迹评价. 中国造纸, 2015, 34(3):20-24.
[
|
| [49] |
|
| [50] |
锐观网. 瓦楞纸箱行业概述及发展趋势分析. https://www.reportrc.com/article/20200402/5704.html, 2021-05-23.
[Reportrc.com. Corrugated box industry overview and development trend analysis. https://www.reportrc.com/article/20200402/5704.html, 2021-05-23.]
|
| [51] |
中国造纸学会. 中国造纸年鉴2020.北京: 中国轻工业出版社, 2020.
[China Technical Association of Paper Industry. China Papermaking Yearbook: 2020. Beijing: China Light Industry Press, 2020.]
|
| [52] |
人民日报. 1年300亿个快递包裹纸箱回收率不到20%. http://www.nbd.com.cn/articles/2016-11-14/1052645.html, 2021-05-23.
[
|
| [53] |
陈水合. 我国木材加工业促进林业生态发展. 中国人造板, 2019, 26(8):36-39.
[
|
| [54] |
阿里研究院. 2020 中国淘宝村研究报告. https://baijiahao.baidu.com/s?id=1681041947207037125, 2021-05-23.
[AliResearch. 2020 Research report on Taobao villages in China. https://baijiahao.baidu.com/s?id=1681041947207037125, 2021-05-23.]
|
/
| 〈 |
|
〉 |