
基于MODIS的新疆地表温度时空变化特征分析
|
康紫薇(1996-),女,安徽灵璧人,硕士,主要从事气候变化与生态环境研究。E-mail: 1357924818@qq.com |
收稿日期: 2021-03-22
录用日期: 2021-07-26
网络出版日期: 2022-06-10
基金资助
国家自然科学基金项目(41761108)
国家自然科学基金项目(41771077)
国家自然科学基金项目(41641003)
石河子大学高层次人才科研启动项目(校20200075)
版权
Spatio-temporal variation characteristics of land surface temperature in Xinjiang based on MODIS
Received date: 2021-03-22
Accepted date: 2021-07-26
Online published: 2022-06-10
Copyright
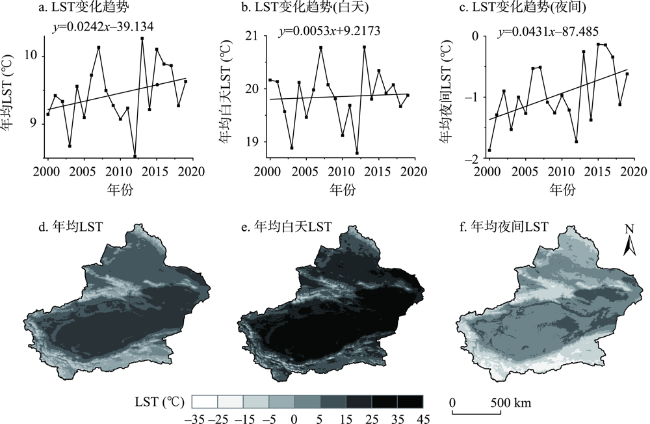
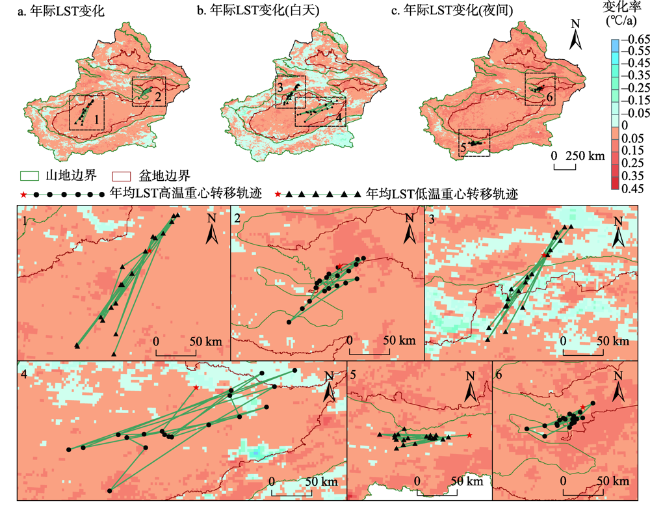
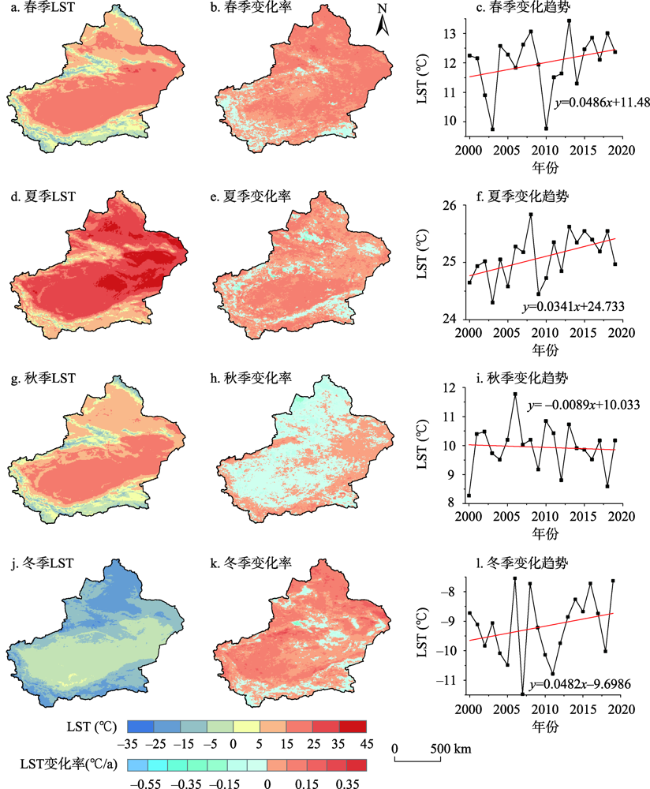
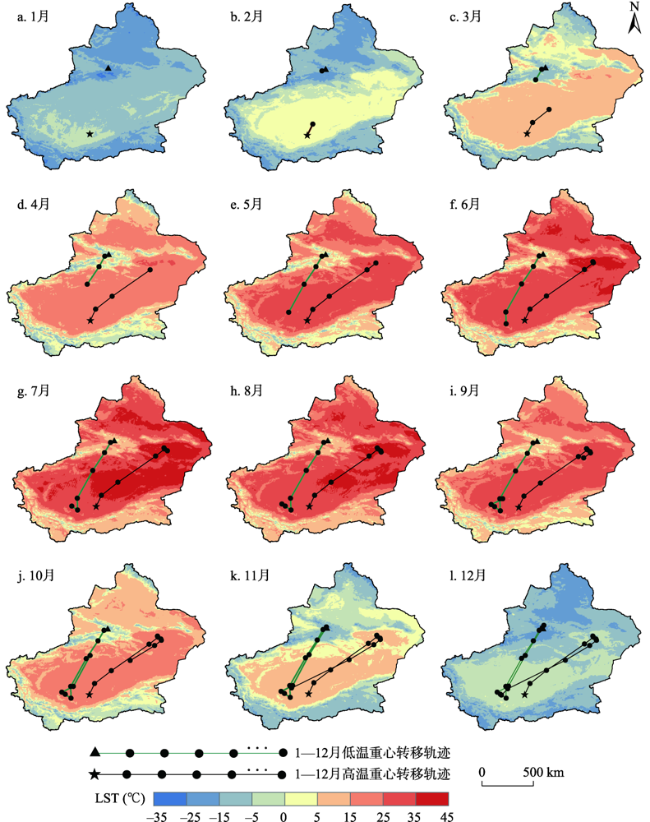
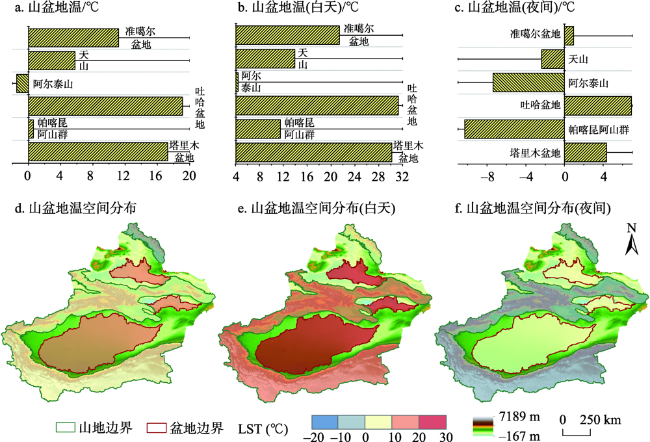
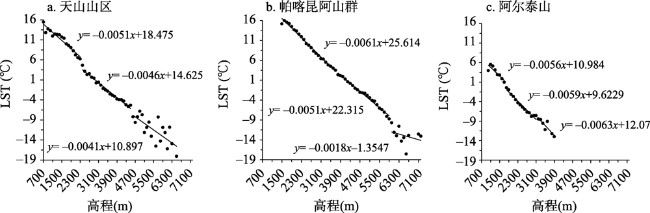
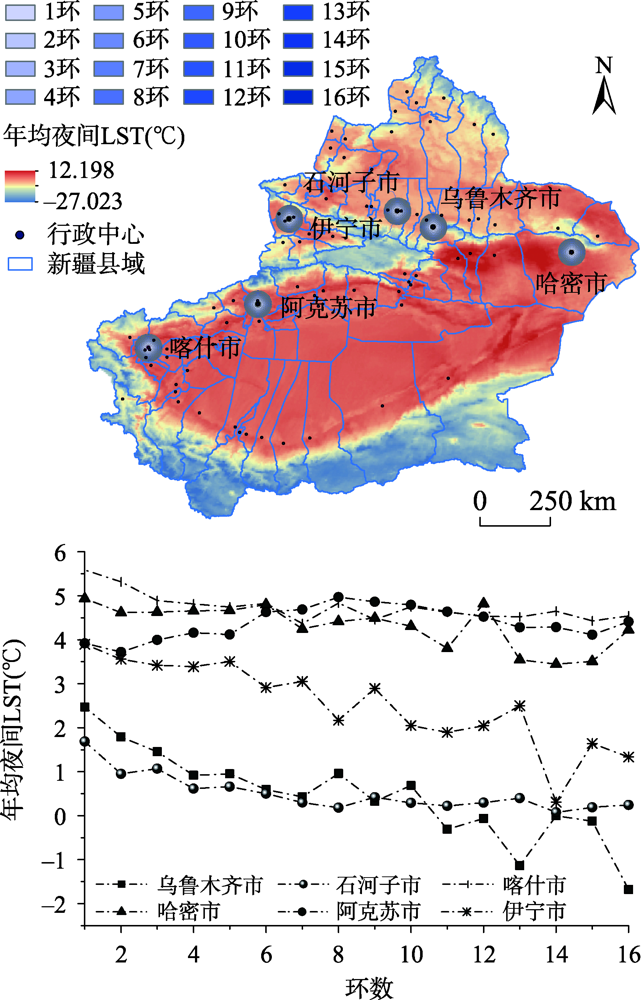
地表温度(LST)作为陆地环境相互作用过程研究中的重要地学参量,其时空分异与下垫面属性、地形地貌格局等息息相关。本文基于2000—2020年MOD11C3数据,采用GIS空间分析、空间重心模型及改进的半径法等手段,对新疆地区月、季、年及昼夜等序列时空尺度LST的分布特征及变化趋势进行研究,并借助LUCC、DEM等多源遥感数据进一步探讨各类下垫面、不同地貌单元及部分典型区域的LST垂直递减率、增减温及热(冷)岛效应等地理特征。结果表明:① 研究期间新疆年均LST为9.45 ℃,呈减温和增温趋势的区域分别占研究区面积的13.3%和86.7%,增温区域占绝大部分,故近20年研究区整体呈升温趋势(0.024 ℃·a-1),较全国高出约0.01 ℃·a-1,其中春季增幅最大,冬季次之;夜间LST变化明显强于白天,春、夏两季昼夜温差均大于23.7 ℃,而冬季最小(约15 ℃);研究区年际高、低温重心迁移轨迹大多分布于LST变幅较大区域,各月LST空间分布及高低温重心转移轨迹均表现出以7月为中点的年内强对称性规律。② 不同下垫面地表冷热环境空间分布差异较显著。其中以荒漠和裸土为主的未利用地年均LST最高(13.42 ℃)且昼夜温差最大(23.6 ℃),高寒区冰川年均LST最低(-7 ℃)且昼夜温差(14.3 ℃)最小,其他下垫面年均LST在2.6~11 ℃之间,昼夜温差较小且较一致(平均16.75 ℃)。③ 东西走向的“三山夹两盆”地貌结构,使新疆LST的纬度地带规律被大幅削弱。研究区各山区(群)LST垂直递减率不尽相同,地处较高纬的阿尔泰山递变(0.63 ℃/100 m)最明显,山体高大的帕喀昆阿山群递变(0.57 ℃/100 m)次之,天山山脉递变(0.54 ℃/100 m)最小。另外各山区(群)山麓处均出现了不同程度的逆温现象,而山腰处LST垂直递减率线性拟合效果最佳。④ 本研究所选取的部分典型城市大都表现出不同程度的热岛效应。其中乌鲁木齐市热岛效应最为强烈,伊宁市其次,哈密市最微弱,而阿克苏市则表现出绿洲城市冷岛效应,但各城市热(冷)岛效应均存在一定环数(8环)范围的冷、热岛足迹。
康紫薇 , 张正勇 , 刘琳 , 王统霞 , 田浩 , 陈泓瑾 , 张雪莹 . 基于MODIS的新疆地表温度时空变化特征分析[J]. 地理研究, 2022 , 41(4) : 997 -1017 . DOI: 10.11821/dlyj020210232
Land surface temperature (LST) is an extremely important geological parameter in the study of the process of terrestrial environmental interaction, and its spatio-temporal differentiation is closely related to the attributes of the underlying surface and the topography and geomorphology pattern. Based on MOD11C3 data from 2000 to 2020, this paper uses GIS spatial analysis, spatial center of gravity model and improved radius method to study the distribution characteristics and changing trends of LST on the spatial and temporal scales of the month, season, year, day and night sequences in Xinjiang, and with the help of multi-source remote sensing data such as LUCC and DEM, we further explore the geographical characteristics of various underlying surfaces, different geomorphic units and some typical areas of LST vertical decline rate, temperature increase and decrease, and urban heat (cold) island effect. The results show that: (1) during the study period, the average annual LST in Xinjiang was 9.45 ℃. The areas with decreasing temperature and increasing temperature accounted for 13.3% and 86.7% of the study area, respectively. So in the past 20 years, the study area showed an overall warming trend (0.024℃·a-1), which was about 0.01 ℃·a-1 higher than that of the whole country. The largest increase was observed in spring, followed by winter; the change of LST at night was significantly stronger than that in the daytime. The temperature differences between day and night in both spring and summer are greater than 23.7 ℃, and the smallest temperature difference is in winter (about 15 ℃); the interannual high and low temperature centers of gravity migration trajectory in the study area is mostly distributed in the area with large LST variation, and the spatial distribution of LST and the centers of high and low temperature in each month The transfer trajectories all showed strong symmetry during the year with July as the midpoint. (2) The spatial distribution of the hot and cold environments on different underlying surfaces is significantly different. Among them, the unused land dominated by deserts and bare soil has the highest average annual LST (13.42 ℃) and the largest day-night temperature difference (23.6 ℃). The glaciers in alpine regions have the lowest annual average LST (-7 ℃) and the lowest day-night temperature difference (14.3 ℃). The average annual LST of other underlying surfaces is between 2.6-11 ℃, and the temperature difference between day and night is small and consistent (average 16.75 ℃). (3) The east-west trending of “three mountains and two basins” geomorphic structure greatly makes the latitude zone of Xinjiang LST less stable. The vertical decline rates of LST in the mountainous areas (groups) of the study area are not the same. The LSTs of the Altay Mountains at higher latitudes vary (0.63 ℃/100 m), followed by the Pakakun's Group with high mountains (0.57 ℃/100 m), and the Tianshan Mountains (0.54 ℃/100 m). In addition, various degrees of temperature inversion occurred in the foothills of the mountainous areas (groups), and the linear fitting effect of the LST vertical decline rate at the mountainside was the largest. (4) Most of the typical cities selected in this study show different degrees of urban heat island effect. Among them, Urumqi city has the strongest urban heat island effect, followed by Yining city, while Hami city is the weakest; Aksu city exhibits the oasis urban cold island effect, but the urban heat (cold) island effect of each city has a certain number of rings (8 rings) about urban heat (cold) island footprints. The research results can provide theoretical support for soil development and protection, regional agricultural production and planting, urban engineering construction, as well as production and life in Xinjiang.
表1 数据来源Tab. 1 Date sources |
| 数据类型 | 时间 | 时间分辨率 | 空间分辨率 | 数据来源 |
|---|---|---|---|---|
| MOD11C3 | 2000年2月—2020年2月 | 逐月 | 0.05°×0.05° | 美国国家航空航天局( https://www.nasa.gov/) |
| 实测地温数据 | 2000年2月—2020年2月 | 逐月 | - | 国家气象信息中心( http://data.cma.cn/) |
| LUCC | 2010年 | 年 | 30 m×30 m | 资源环境科学数据中心( http://www.resdc.cn/) |
| DEM | - | - | 30 m×30 m | 地理空间数据( http://www.gscloud.cn/) |
| 地貌空间分布数据 | - | - | 1 km×1 km | 资源环境科学数据中心( http://www.resdc.cn/) |
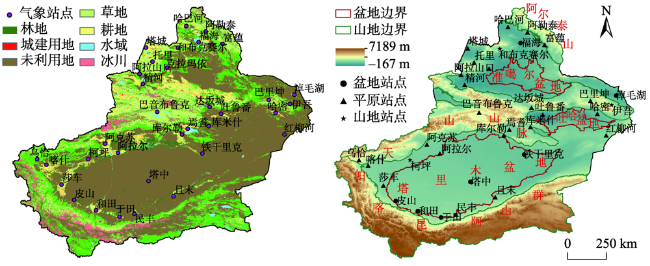
表2 不同地貌区气象站点基本信息Tab. 2 Basic information of meteorological stations in different landform zones |
| 区域 | 站点 |
|---|---|
| 全疆 | 位于林地、草地、耕地、水域、城建用地、未利用地、冰川等下垫面的气象站点 分别有3个、3个、10个、2个、12个、4个、0个,总计34个气象站点 |
| 平原 | 哈巴河、阿勒泰、富蕴、塔城、阿拉山口、托里、克拉玛依、精河、达坂城、库米什、巴音布鲁克、焉耆、吐鲁番、阿克苏、库尔勒、乌恰、喀什、阿拉尔、莎车、民丰、且末、巴里坤、哈密、红柳河 |
| 盆地 | 福海、淖毛湖、铁干里克、皮山、和田、于田、塔中 |
| 山地 | 和布克赛尔、柯坪、伊吾 |
表3 2000—2020年新疆地区各下垫面LST特征Tab. 3 LST characteristics of the underlying surfaces in Xinjiang from 2000 to 2020 (单位:℃) |
| 下垫面 | 年均LST | 年均白天LST | 年均夜间LST | 春季LST | 夏季LST | 秋季LST | 冬季LST |
|---|---|---|---|---|---|---|---|
| 林地 | 9.03 | 17.94 | 0.11 | 11.21 | 24.15 | 9.34 | -8.88 |
| 草地 | 2.57 | 10.14 | -5.00 | 4.18 | 16.72 | 3.13 | -14.02 |
| 耕地 | 10.27 | 18.68 | 1.85 | 13.92 | 26.22 | 11.11 | -10.53 |
| 水域 | 5.81 | 14.36 | -2.73 | 7.40 | 19.85 | 7.14 | -11.55 |
| 城建用地 | 11.00 | 19.41 | 2.54 | 14.55 | 27.45 | 11.68 | -10.15 |
| 未利用地 | 13.42 | 25.24 | 1.60 | 16.22 | 29.92 | 13.66 | -6.50 |
| 冰川 | -7.01 | 0.12 | -14.14 | -6.49 | 2.61 | -6.27 | -18.13 |
真诚感谢匿名评审专家在论文评审中所付出的时间和精力,评审专家对本文引言、数据来源说明、讨论梳理方面的修改意见,使本文获益匪浅。
| [1] |
张祎. 长江流域土地利用/覆被变化对地表温度的影响. 武汉: 中国地质大学硕士学位论文, 2018.
[
|
| [2] |
张慧. 地温变化过程及其机理研究. 长春: 中国科学院大学博士学位论文, 2017.
[
|
| [3] |
祝景彬, 张法伟, 李红琴, 等. 祁连山南麓高寒草甸2002—2016年生长季CO2通量对气温日较差的响应. 科学通报, 2021,66:85-95.
[
|
| [4] |
|
| [5] |
刘哲, 汪雪滢, 刘帝佑, 等. 基于MODIS数据的黄淮海夏玉米高温风险空间分布. 农业工程学报, 2018,34(9):175-181.
[
|
| [6] |
张正勇, 何新林, 刘琳, 等. 中国天山冰川生态服务功能及价值评估. 地理学报, 2018,73(5):856-867.
[
|
| [7] |
刘俊杰, 潘自武, 秦奋, 等. 基于MODIS的秦巴山地气温估算与山体效应分析. 地理研究, 2020,39(3):735-748.
[
|
| [8] |
张扬, 白红英, 苏凯, 等. 1960—2013年秦岭陕西段南北坡极端气温变化空间差异. 地理学报, 2018,73(7):1296-1308.
[
|
| [9] |
丁一汇, 王会军. 近百年中国气候变化科学问题的新认识. 科学通报, 2016,61(10):1029-1041.
[
|
| [10] |
姚永慧, 徐美, 张百平. 青藏高原增温效应对垂直带谱的影响. 地理学报, 2015,25(12):1411-1422.
[
|
| [11] |
|
| [12] |
|
| [13] |
姬霖, 段克勤. 1960—2017年渭河流域极端气温变化及其对区域增暖的响应. 地理科学, 2020,40(3):466-477.
[
|
| [14] |
袁振, 吴相利, 臧淑英, 等. 基于TM影像的哈尔滨市主城区绿地降温作用研究. 地理科学, 2017,37(10):1600-1608.
[
|
| [15] |
王万同, 王卷乐, 杜佳. 基于ETM+与MODIS数据融合的伊洛河流域地表蒸散估算. 地理研究, 2013,32(5):817-827.
[
|
| [16] |
张威, 纪然. 辽宁省地表温度时空变化及影响因素. 生态学报, 2019,39(18):6772-6784.
[
|
| [17] |
叶钰, 秦建新, 胡顺石. 长沙市热岛效应时空特征变化研究. 地球信息科学学报, 2017,19(4):518-527.
[
|
| [18] |
刘劲宏, 姚宜斌, 桑吉章. PM2.5对地表温度的影响及其应用. 大地测量与地球动力学, 2019,39(5):502-505.
[
|
| [19] |
索南东主, 姚永慧, 张百平. 青藏高原和阿尔卑斯山山体效应的对比研究. 地理研究, 2020,39(11):2568-2580.
[
|
| [20] |
|
| [21] |
庹苗苗. 2000—2014年北京地区冬、夏季热环境时空分异研究. 北京: 中国地质大学硕士学位论文, 2017.
[
|
| [22] |
乔治, 黄宁钰, 徐新良, 等. 2003—2017年北京市地表热力景观时空分异特征及演变规律. 地理学报, 2019,74(3):475-489.
[
|
| [23] |
陈超, 周广胜. 1961—2010年阿拉善左旗气温和地温的变化特征分析. 自然资源学报, 2014,29(1):91-103.
[
|
| [24] |
王雪姣, 王森, 吉春容, 等. 1961—2015年新疆0cm地温的时空分布特征及突变分析. 干旱区资源与环境, 2018,32(4):165-169.
[
|
| [25] |
刘世博, 臧淑英, 张丽娟, 等. 东北冻土区MODIS地表温度估算. 地理研究, 2017,36(11):2251-2260.
[
|
| [26] |
宁珊, 张正勇, 刘琳, 等. TRMM偏最小二乘降尺度降水模型在新疆不同地貌的适应性. 农业工程学报, 2020,36(12):99-109.
[
|
| [27] |
杜军, 胡军, 尼玛吉, 等. 1981—2017年西藏“一江两河”流域5 cm地温及其界限温度时空变化特征. 地理学报, 2019,74(9):1821-1834.
[
|
| [28] |
程维明, 周成虎, 李炳元, 等. 中国地貌区划理论与分区体系研究. 地理学报, 2019,74(5):839-856.
[
|
| [29] |
|
| [30] |
赵贵宁, 张正勇, 刘琳, 等. 基于多源遥感数据的玛纳斯河流域冰川物质平衡变化. 地理学报, 2020,75(1):98-112.
[
|
| [31] |
杨贵军, 孙晨红, 历华. 黑河流域ASTER与MODIS融合生成高分辨率地表温度的验证. 农业工程学报, 2015,31(6):193-200.
[
|
| [32] |
邱丽莎, 何毅, 张立峰, 等. 祁连山MODIS LST时空变化特征及影响因素分析. 干旱区地理, 2020,43(3):726-737.
[
|
| [33] |
|
| [34] |
赵冰, 毛克彪, 蔡玉林, 等. 中国地表温度时空演变规律研究. 国土资源遥感, 2020,32(2):233-240.
[
|
| [35] |
管延龙, 王让会, 李成, 等. 基于MODIS数据的天山区域地表温度时空特征. 应用生态学报, 2015,26(3):681-688.
[
|
| [36] |
祝聪, 彭文甫, 张丽芳, 等. 2006—2016年岷江上游植被覆盖度时空变化及驱动力. 生态学报, 2019,39(5):1583-1594.
[
|
| [37] |
|
| [38] |
杨涵洧, 封国林. 2013年盛夏中国持续性高温事件诊断分析. 高原气象, 2016,35(2):484-494.
[
|
| [39] |
邓海军, 陈亚宁, 陈忠升. 增温增湿环境下天山山区降雪量变化. 地理科学, 2018,38(11):1933-1942.
[
|
| [40] |
孙美平, 姚晓军, 李忠勤, 等. 天山东段乌鲁木齐河源区冰雪消融与产汇流水文过程. 地理学报, 2015,25(2):149-164.
[
|
| [41] |
黄丽明, 陈健飞. 城市景观格局时空特征的热环境效应研究: 以广州市花都区为例. 自然资源学报, 2015,30(3):480-490.
[
|
| [42] |
|
| [43] |
刘勇洪, 房小怡, 张硕, 等. 京津冀城市群热岛定量评估. 生态学报, 2017,37(17):5818-5835.
[
|
| [44] |
张百平, 姚永慧. 山体效应对生态垂直格局的影响. 地理学报, 2016,26(7):871-877.
[
|
| [45] |
崔耀平, 刘纪远, 张学珍, 等. 京津唐城市群土地利用变化的区域增温效应模拟. 生态学报, 2015,35(4):993-1003.
[
|
| [46] |
高原, 刘普幸, 姚玉龙, 等. 基于遥感的石河子绿洲冷岛效应时空变化特征及其影响因子分析. 自然资源学报, 2015,30(8):1319-1331.
[
|
| [47] |
廖要明, 陈德亮, 刘秋锋. 中国地气温差时空分布及变化趋势. 气候变化研究进展, 2019,15(4):374-384.
[
|
| [48] |
胡文峰, 陈玲玲, 姚俊强, 等. 气候变化背景下新疆气温和降水时空演变特征分析. 阜阳师范学院学报: 自然科学版, 2020,37(3):90-95.
[
|
| [49] |
周连童, 温李明. 我国春夏季地气温差的时空变化特征及其与夏季降水的联系. 气候与环境研究, 2016,21(6):621-632.
[
|
| [50] |
王佳琳, 潘志华, 韩国琳, 等. 1961—2010年中国0cm地温变化特征及其与气温变化的关系. 资源科学, 2016,38(9):1733-1741.
[
|
| [51] |
姚宜斌, 雷祥旭, 张良, 等. 青藏高原地区1979—2014年大气可降水量和地表温度时空变化特征分析. 科学通报, 2016,61:1462-1477.
[
|
/
| 〈 |
|
〉 |