
中国乡镇人口分布时空变化及其影响因素
|
尹旭(1993-),男,河北迁安人,博士研究生,研究方向为资源利用与人口地理。E-mail: yinxubj@163.com |
收稿日期: 2021-06-08
录用日期: 2021-09-02
网络出版日期: 2022-07-10
基金资助
国家自然科学基金项目(41971220)
国家自然科学基金项目(41931293)
中科院战略先导A类项目(XDA20010203)
Spatio-temporal evolution and driving factors of Chinese population at town level
Received date: 2021-06-08
Accepted date: 2021-09-02
Online published: 2022-07-10
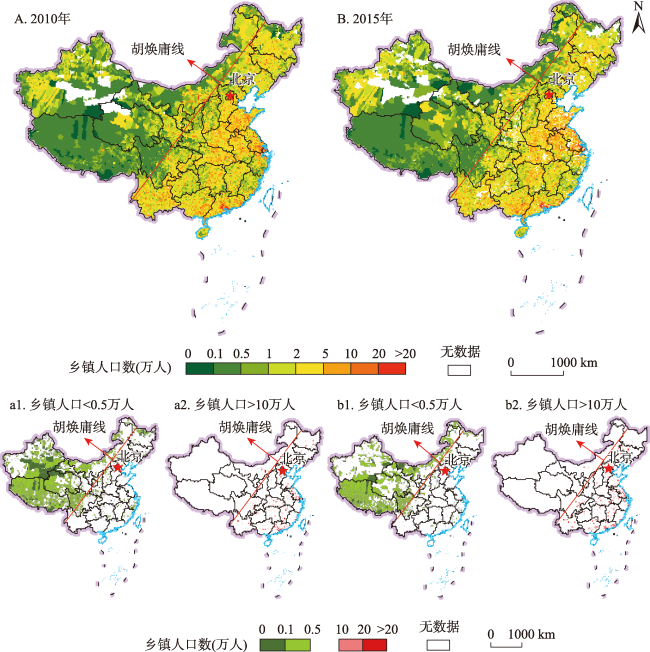
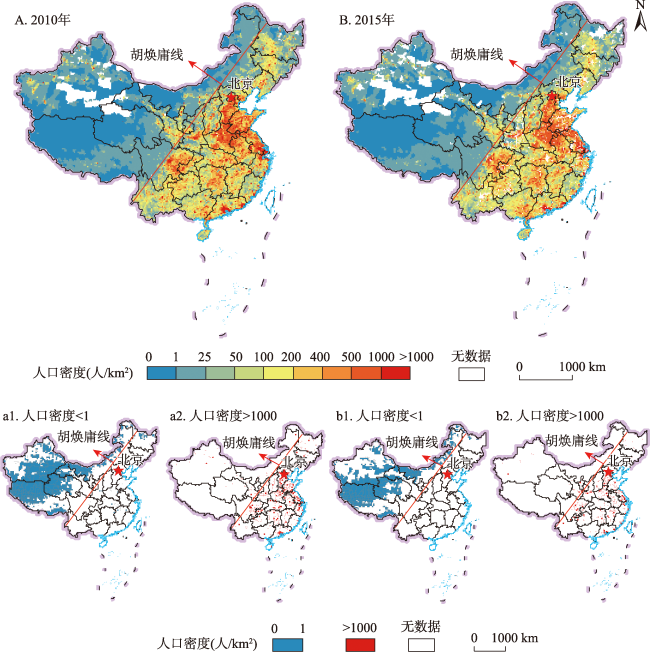
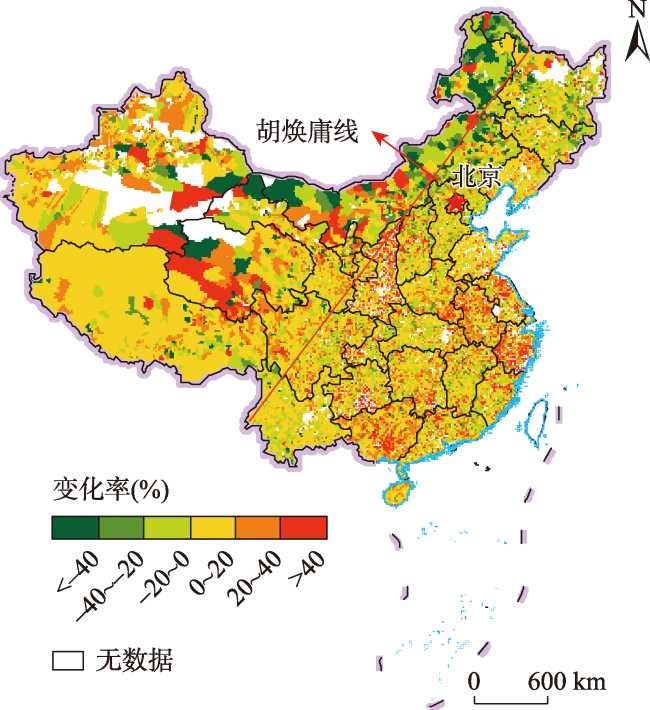
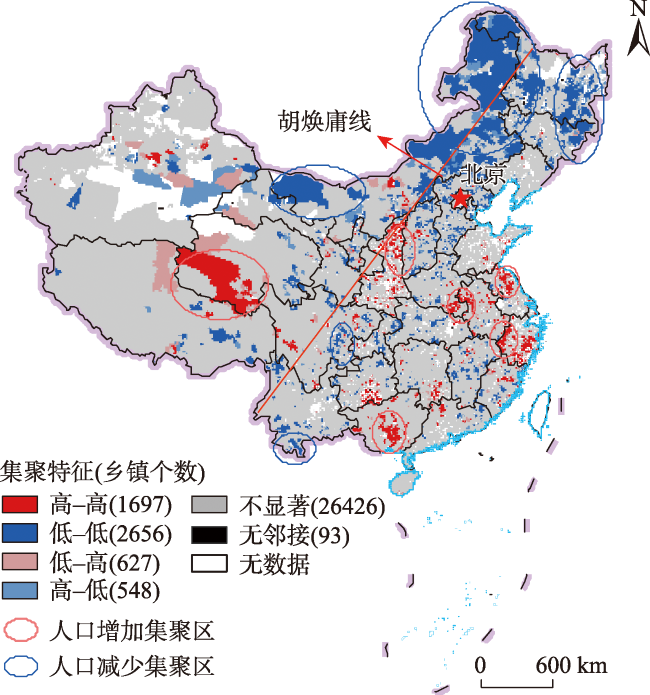
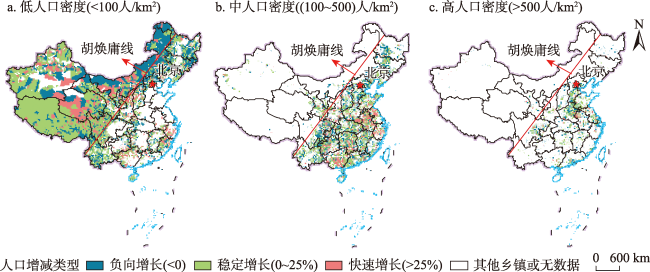
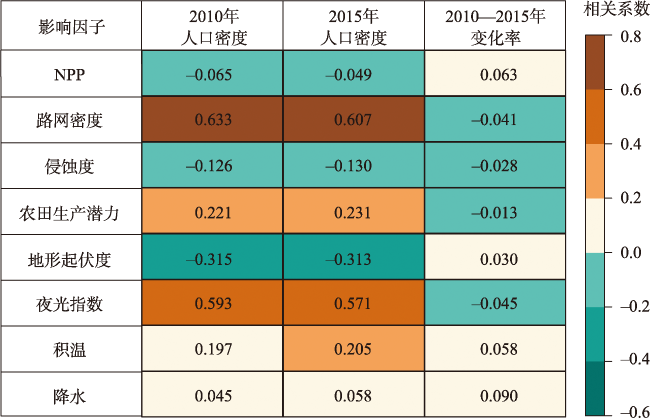
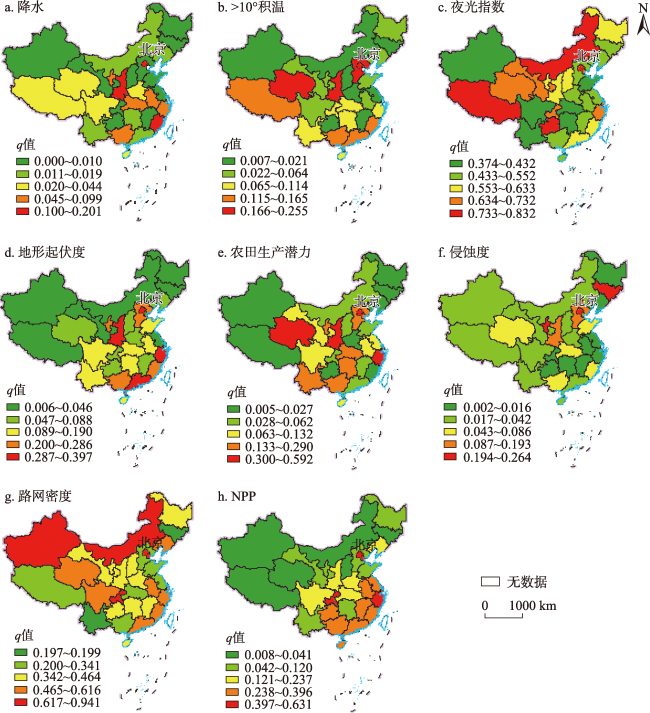
精细尺度的人口变化研究对于理解、模拟和调控人地系统具有重要参考价值,乡镇级的人口数据可以精细化揭示中国人口时空分布的演变特征。本文建立了2010年和2015年中国乡镇人口空间数据库,借助GIS空间分析方法和地理探测器模型揭示了乡镇人口时空变化特征及其影响因素。研究表明:2015年乡镇人口数量均值为2.95万、密度均值为374人/km2,乡镇人口数量和密度分布的区域差异较大;乡镇人口与土地面积分布相较县域呈现更加不均衡特征,人口密度大于150人/km2的19403个乡镇(60.81%),人口总量占比为81.76%、国土面积占比为20.27%,近似符合“二八定律”;2010—2015年,超过70.94%的乡镇人口数量有所增加(平均增幅19.33%),9273个乡镇人口减少(平均减幅13.33%),其中1684个乡镇(5.28%)的减幅超过20%,主要分布在东北、内蒙古和云南的边境地区;人口密度分布受地形起伏等自然地理条件,以及夜间灯光、路网密度所反映的社会经济因素等的综合影响,其作用机制存在明显的空间异质性。研究认为,乡镇人口的大幅增减变化及其显著差异格局对人地系统的优化调控,特别是编制国土空间规划、实施乡村振兴战略和保障国防安全等带来一定挑战,应给予足够重视。
尹旭 , 王婧 , 李裕瑞 , 封志明 , 戚伟 . 中国乡镇人口分布时空变化及其影响因素[J]. 地理研究, 2022 , 41(5) : 1245 -1261 . DOI: 10.11821/dlyj020210479
Research on high-resolution population evolution is of great reference for understanding, simulating, and managing the human-nature interrelationship. Town-level demographic data is the highest-resolution data publicly released by the National Bureau of Statistics of China. Therefore, it is of great significance to collect the population data of China at town level, and to carry out research on the spatiotemporal evolution and its influencing factors of Chinese population at town level. In this study, we established a spatial database of Chinese population at town level in 2010 and 2015, and then revealed its spatial and temporal pattern and influencing factors by Geographic Information System (GIS) analytical methods and Geodetector model. The results showed that: (1) In 2015, the average population of towns was 29,500, and the average population density was 374 persons/km2. Furthermore, there existed large spatial heterogeneity in China, the number of townships with a population of more than 10,000 is 781, mainly in the Yangtze River Delta and the Pearl River Delta, while the number of townships with a population of less than 5,000 is 2,498, mainly in the Qinghai-Tibet Plateau and Inner Mongolia. (2) The distribution of population and land area of townships was greatly uneven. There were 19,403 (60.81%) townships with a population density of more than 150 persons/km2, and their total population and land area accounted for 81.76% and 20.27%, respectively, which was approximately in line with “Pareto's Law”. (3) From 2010 to 2015, more than 70% towns’ population increased, by contrast, the population of more than 9,000 towns decreased, of which more than 1,600 towns experienced a population loss of more than 20%, and most of them were located in the border areas of Northeast China, Inner Mongolia and Yunnan. (4) The population distribution is comprehensively affected by physical geography (e.g., relief degree of land surface, negative effect) and socio-economic factors (e.g., night time light index and road density, positive effect), and its mechanism has obvious spatial stratified heterogeneity in different regions. This study argues that the rapid population growth or loss brings great challenges for harmonizing human-environment relationships, such as territory spatial planning, rural revitalization and national border security.
Key words: towns; population distribution; Geodetector; driving factor; China
表1 2010年和2015年中国乡镇人口的密度分级Tab. 1 Classification of town-level population density in China in 2010 and 2015 |
| 人口密度 (人/km2) | 乡镇个数 | 总人口(万人) | 人口占比(%) | 面积(万km2) | 面积占比(%) | |||||
|---|---|---|---|---|---|---|---|---|---|---|
| 2010年 | 2015年 | 2010年 | 2015年 | 2010年 | 2015年 | 2010年 | 2015年 | 2010年 | 2015年 | |
| 0~1 | 293 | 276 | 78.69 | 72.09 | 0.09 | 0.08 | 232.50 | 224.42 | 26.70 | 25.77 |
| 1~25 | 2616 | 2498 | 1753.99 | 1738.51 | 2.02 | 1.84 | 259.03 | 264.85 | 29.75 | 30.41 |
| 25~50 | 2315 | 2114 | 2441.79 | 2373.42 | 2.82 | 2.52 | 66.03 | 63.92 | 7.58 | 7.34 |
| 50~100 | 4560 | 4216 | 6783.73 | 6363.06 | 7.83 | 6.75 | 92.54 | 86.76 | 10.63 | 9.96 |
| 100~200 | 6230 | 6036 | 12755.90 | 12799.87 | 14.72 | 13.58 | 89.48 | 89.77 | 10.28 | 10.31 |
| 200~400 | 7197 | 7007 | 20890.85 | 20932.21 | 24.10 | 22.20 | 72.90 | 73.25 | 8.37 | 8.41 |
| 400~500 | 2433 | 2517 | 8649.39 | 9389.87 | 9.98 | 9.96 | 19.37 | 20.99 | 2.22 | 2.41 |
| 500~1000 | 4881 | 5497 | 21269.01 | 25420.62 | 24.54 | 26.97 | 32.27 | 38.13 | 3.71 | 4.38 |
| >1000 | 1384 | 1748 | 12050.93 | 15178.55 | 13.90 | 16.10 | 6.68 | 8.72 | 0.77 | 1.00 |
表2 2010年和2015年中国乡镇人口密度与增长类型的耦合特征Tab. 2 Coupling characteristics of town-level population density and growth types in China |
| 人口密度 (人/km2) | 负向增长(<0) (乡镇个数,占比) | 稳定增长(0~25%) (乡镇个数,占比) | 快速增长(>25%) (乡镇个数,占比) |
|---|---|---|---|
| 低密度(<100) | 低密度负向增长(2713, 8.50) | 低密度稳定增长(5092, 15.96) | 低密度快速增长(1979, 6.20) |
| 中密度(100~500) | 中密度负向增长(4452, 13.95) | 中密度稳定增长(8062, 25.27) | 中密度快速增长(3346, 10.49) |
| 高密度(>500) | 高密度负向增长(2108, 6.61) | 高密度稳定增长(3137, 9.83) | 高密度快速增长(1020, 3.20) |
from 2010 to 2015 |
表3 2010—2015年中国乡镇人口密度及变化率影响因子探测结果Tab. 3 Detection results of town-level population density and change rate in China from 2010 to 2015 |
| 影响因子 | 降水 | >10°积温 | 夜光指数 | 地形起伏度 | 农田生产潜力 | 侵蚀度 | 路网密度 | NPP |
|---|---|---|---|---|---|---|---|---|
| 2010人口密度 | 0.010** | 0.050** | 0.435** | 0.103** | 0.053** | 0.023** | 0.472** | 0.008** |
| 2015人口密度 | 0.012** | 0.054** | 0.376** | 0.102** | 0.056** | 0.025** | 0.477** | 0.007** |
| 人口密度变化率 | 0.011** | 0.006** | 0.003 | 0.001 | 0.001 | 0.003 | 0.002 | 0.006** |
注:**表示0.01水平上显著相关。 |
表4 2010年中国四大地理区域乡镇人口密度分布的影响因子探测Tab. 4 Detection results of town-level population density in four geographical regions of China in 2010 |
| 降水 | >10°C积温 | 夜光指数 | 地形起伏度 | 农田生产潜力 | 侵蚀度 | 路网密度 | NPP | |
|---|---|---|---|---|---|---|---|---|
| 全国 | 0.010** | 0.050** | 0.435** | 0.103** | 0.053** | 0.023** | 0.472** | 0.008** |
| 东北 | 0.003 | 0.045** | 0.473** | 0.027** | 0.011** | 0.073** | 0.374** | 0.048** |
| 东部 | 0.077** | 0.043** | 0.569** | 0.102** | 0.018** | 0.012** | 0.432** | 0.243** |
| 中部 | 0.031** | 0.007** | 0.449** | 0.114** | 0.060** | 0.014** | 0.410** | 0.051** |
| 西部 | 0.021** | 0.046** | 0.373** | 0.066** | 0.081** | 0.019** | 0.670** | 0.019** |
注:**表示在0.01水平上显著相关。 |
真诚感谢匿名评审专家在论文评审中所付出的时间和精力,评审专家对本文研究综述、整体研究框架设计、结果分析、结论梳理方面的修改意见,使本文获益匪浅。
| [1] |
|
| [2] |
李裕瑞, 尹旭. 镇域发展研究进展与展望. 经济地理, 2019, 39(7):1-8.
|
| [3] |
顾朝林, 管卫华, 刘合林. 中国城镇化2050: SD模型与过程模拟. 中国科学: 地球科学, 2017, 47(7):818-832.
|
| [4] |
刘彦随. 中国新时代城乡融合与乡村振兴. 地理学报, 2018, 73(4): 637-650.
|
| [5] |
|
| [6] |
|
| [7] |
|
| [8] |
|
| [9] |
董南, 杨小唤, 蔡红艳. 人口数据空间化研究进展. 地球信息科学学报, 2016, 18(10): 1295-1304.
|
| [10] |
|
| [11] |
封志明, 杨艳昭, 游珍, 等. 基于分县尺度的中国人口分布适宜度研究. 地理学报, 2014, 69(6):723-737.
|
| [12] |
梁昊光, 刘彦随. 北京市人口时空变化与情景预测研究. 地理学报, 2014, 69(10):1487-1495.
|
| [13] |
王超, 阚瑷珂, 曾业隆, 等. 基于随机森林模型的西藏人口分布格局及影响因素. 地理学报, 2019, 74(4):664-680.
|
| [14] |
柏中强, 王卷乐, 杨雅萍, 等. 基于乡镇尺度的中国25省区人口分布特征及影响因素. 地理学报, 2015, 70(8):1229-1242.
|
| [15] |
|
| [16] |
|
| [17] |
葛美玲, 封志明. 中国人口分布的密度分级与重心曲线特征分析. 地理学报, 2009, 64(2):202-210.
|
| [18] |
胡焕庸. 中国人口之分布: 附统计表与密度图. 地理学报, 1935, 2(2):33-74.
[
|
| [19] |
陆大道, 王铮, 封志明, 等. 关于“胡焕庸线能否突破”的学术争鸣. 地理研究, 2016, 35(5):805-824.
|
| [20] |
|
| [21] |
张善余. 中国人口地理. 北京: 科学出版社, 2007: 243-285.
[
|
| [22] |
刘睿文, 封志明, 游珍. 中国人口集疏格局与形成机制研究. 中国人口·资源与环境, 2010, 20(3):89-94.
|
| [23] |
|
| [24] |
吕晨, 蓝修婷, 孙威. 地理探测器方法下北京市人口空间格局变化与自然因素的关系研究. 自然资源学报, 2017, 32(8):1385-1397.
|
| [25] |
|
| [26] |
|
| [27] |
|
| [28] |
|
| [29] |
敖荣军, 常亮. 基于结构方程模型的中国县域人口老龄化影响机制. 地理学报, 2020, 75(8):1572-1584.
|
| [30] |
戚伟, 刘盛和, 周亮. 青藏高原人口地域分异规律及“胡焕庸线”思想应用. 地理学报, 2020, 75(2):255-267.
|
| [31] |
中华人民共和国国家统计局. 中国2010年人口普查分乡、镇、街道资料. 北京: 中国统计出版社, 2012.
[ National Bureau of Statistics of China. Tabulation on the 2010 Population Census of The People′s Republic of China by Township. Beijing: China Statistics Press, 2012.]
|
| [32] |
中华人民共和国国家统计局. 中国县域统计年鉴(乡镇卷)-2016. 北京: 中国统计出版社, 2017.
[ National Bureau of Statistics of China. China Statistical Yearbook Township-2016. Beijing: China Statistics Press, 2017.]
|
| [33] |
游珍, 封志明, 杨艳昭. 中国1km地形起伏度数据集. 全球变化数据学报(中英文), 2018, 2(2): 151-155.
|
| [34] |
中国人口分布适宜度研究课题组. 中国人口分布适宜度报告. 北京: 科学出版社, 2014: 37-41.
[ Group of China Population Distribution Suitability. Report on Suitability Evaluation of Population Distribution in China. Beijing: Science Press, 2014: 37-41.]
|
| [35] |
|
| [36] |
王劲峰, 徐成东. 地理探测器:原理与展望. 地理学报, 2017, 72(1):116-134.
|
| [37] |
戚伟, 刘盛和, 赵美风. “胡焕庸线”的稳定性及其两侧人口集疏模式差异. 地理学报, 2015, 70(4):551-566.
|
| [38] |
|
| [39] |
曹智, 刘彦随, 李裕瑞, 等. 中国专业村镇空间格局及其影响因素. 地理学报, 2020, 75(8):1647-1666.
|
| [40] |
陈发虎, 傅伯杰, 夏军, 等. 近70年来中国自然地理与生存环境基础研究的重要进展与展望. 中国科学: 地球科学, 2019, 49(11):1659-1696.
|
| [41] |
|
| [42] |
|
| [43] |
胡焕庸. 句容县之人口分布. 地理学报, 1936, (3):621-627+673.
[
|
| [44] |
樊杰. 中国人文地理学70年创新发展与学术特色. 中国科学: 地球科学, 2019, 49(11):1697-1719.
|
| [45] |
戚伟, 刘盛和, 周侃, 等. 国土空间规划:人口和城乡布局单幅总图的研制. 地理研究, 2019, 38(10):2473-2485.
|
| [46] |
郝庆, 邓玲, 封志明. 面向国土空间规划的“双评价”:抗解问题与有限理性. 自然资源学报, 2021, 36(3):541-551.
|
| [47] |
封志明, 唐焰, 杨艳昭, 等. 中国地形起伏度及其与人口分布的相关性. 地理学报, 2007, 62(10):1073-1082.
|
/
| 〈 |
|
〉 |