
中国1980—2019年1 m土层贮水量的时空变化特征分析
|
王宗侠(1998-),男,广东湛江人,博士研究生,主要从事水文水资源研究。E-mail: wangzongxia731x@igsnrr.ac.cn |
收稿日期: 2021-12-09
录用日期: 2022-07-19
网络出版日期: 2023-01-11
基金资助
国家重点研发计划项目(2018YFE0106500)
第二次青藏高原综合科学考察研究课题(2019QZKK0903)
第三次新疆综合科学考察项目课题(2021xjkk0803)
Spatiotemporal variation of water storage in 1-m soil layer in China from 1980 to 2019
Received date: 2021-12-09
Accepted date: 2022-07-19
Online published: 2023-01-11
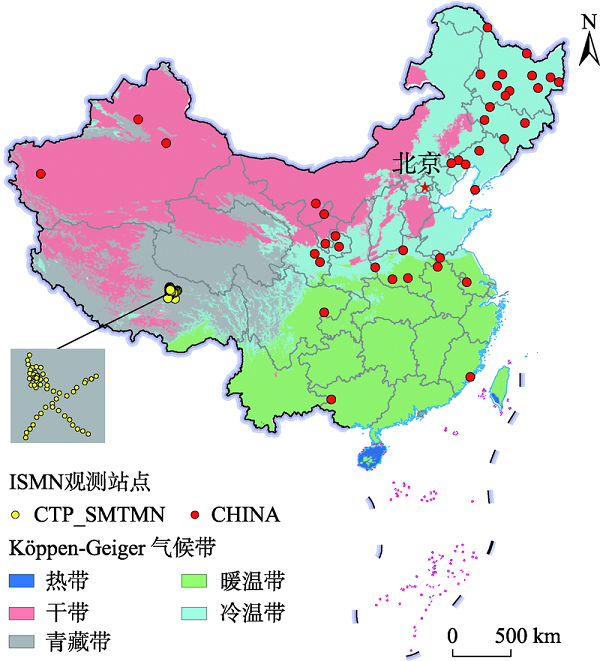
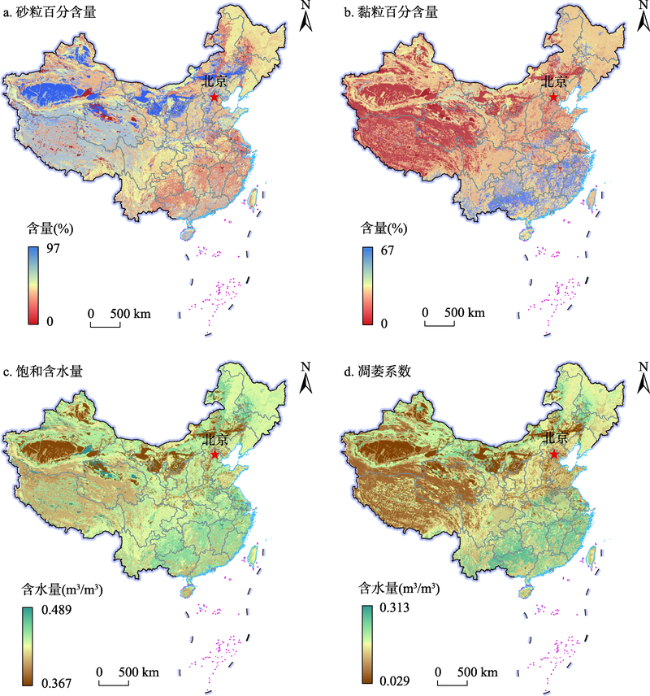
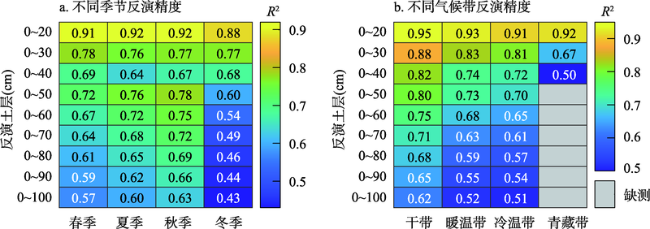
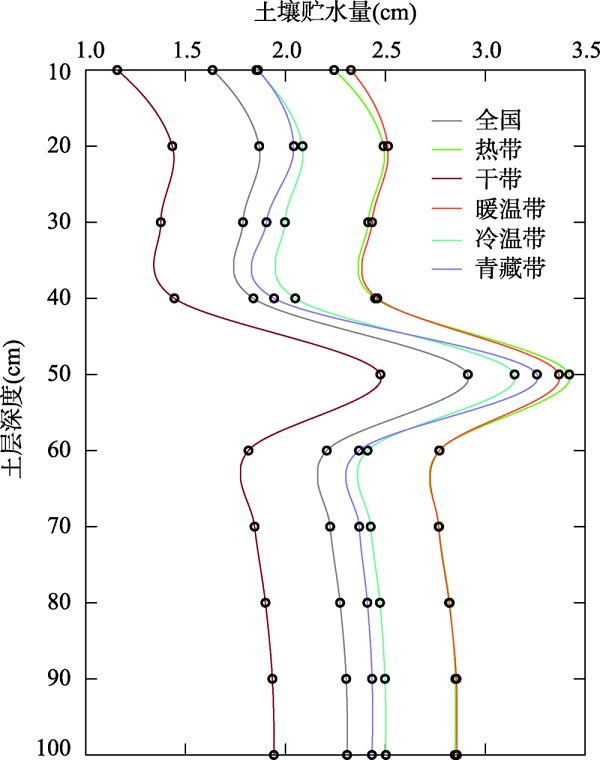
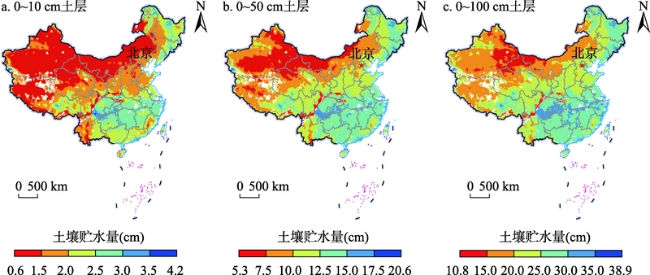
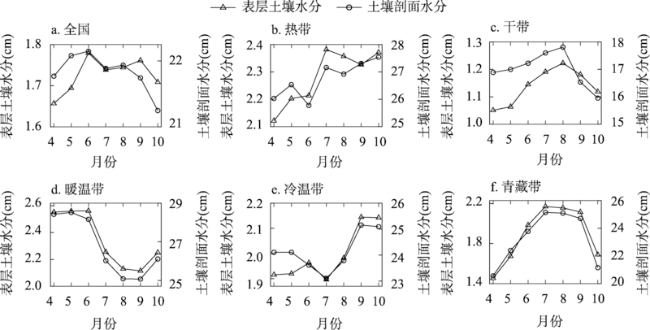
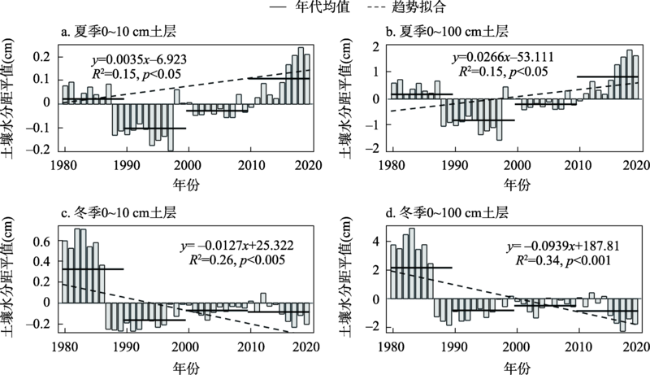
土壤剖面水分信息比表层土壤水分信息难以获取,但对全面认识整个土层的水分含量至关重要。融合多源数据是估算区域土壤剖面水分的有效途径。本文采用随机森林回归算法,利用中国实测土壤水分数据建立了不同季节的表层-深层土壤水分关系模型。据此采用ESA CCI SM遥感表层土壤水分产品估算获得了中国1980—2019年0~10、0~20、0~30、0~40、0~50、0~60、0~70、0~80、0~90和0~100 cm 共10个深度层次土壤水分的时空变化特征。ESA CCI SM产品与实测数据整体上匹配较好但普遍高估,本文提出采用饱和含水量和凋萎系数信息对其进行值域控制,有效降低了该产品的高估误差。随机森林回归模型的精度在秋季最高,夏季和春季次之,冬季最低。模型对干带土壤水分的估算最准确,暖温带和冷温带次之,青藏带准确性最低。计算了中国10个深度层次的土壤贮水量,其多年平均值和标准差分别为1.64±0.11、3.50±0.21、5.29±0.30、7.13±0.38、10.04±0.46、12.25±0.54、14.47±0.62、16.75±0.69、19.05±0.76和21.36±0.83 cm。各深度的土壤水分呈明显的分层,即波动层(0~40 cm)、跃变层(40~60 cm)和稳定层(60~100 cm)。中国1m土层贮水量呈自西北向东北和东南方向递增的分布格局,寒旱区该值较低且空间变异明显,暖湿区该值较高且空间分布更均一。热带、干带和青藏带的1 m土层贮水量在夏季最高,暖温带和冷温带该值在夏季最低。近40年来中国1m土层贮水量在空间上“湿区愈湿,干区愈干”,在时间上“湿季愈湿,干季愈干”。热带土壤在2004—2009年显著变湿,干带土壤显著变湿和变干的转折年份分别为1985—1986年和2013—2014年。中国1m土层贮水量序列最常见的周期是5年和11年。

王宗侠 , 刘苏峡 , 邱建秀 , 莫兴国 . 中国1980—2019年1 m土层贮水量的时空变化特征分析[J]. 地理研究, 2022 , 41(11) : 2979 -2999 . DOI: 10.11821/dlyj020211166
Profile soil moisture (PSM), which is essential for a comprehensive understanding of the entire soil layer water content, is more difficult to retrieve than surface soil moisture (SSM). It is an effective approach to estimate PSM at regional scale by combining multi-source data. Based on random forest regression (RFR), this study established SSM-deep layer soil moisture (DLSM) relationship models for different seasons with in-situ observations over China. European Space Agency Climate Change Initiative Soil Moisture (ESA CCI SM) product was used to estimate DLSM. Spatiotemporal variation of SM in 10 soil layers, i.e., 0-10, 0-20, 0-30, 0-40, 0-50, 0-60, 0-70, 0-80, 0-90 and 0-100 cm, in China from 1980 to 2019 was analyzed in detail. ESA CCI SM product matched well with in-situ observations, but the former was generally higher than the latter. A method using saturated soil water content and wilting point for range constraining was proposed, which effectively reduced the overestimation error of ESA CCI SM product. As a whole, accuracy of RFR models was the highest in autumn, followed by summer and spring, and the lowest in winter. The models performed best in arid zone (ARZ), followed by temperate zone (TEZ) and cold zone (COZ), and worst in Qinghai-Tibet zone (QTZ). The multi-year mean and standard deviation of soil water storage of 10 soil layers were 1.64±0.11, 3.50±0.21, 5.29±0.30, 7.13±0.38, 10.04±0.46, 12.25±0.54, 14.47±0.62, 16.75±0.69, 19.05±0.76, and 21.36±0.83 cm, respectively. Soil profile was divided into fluctuating layer (0-40 cm), leap layer (40-60 cm) and stable layer (60-100 cm). Water storage of 1-m soil layer (WS-1m) over China increased from northwest to northeast and southeast, with lower PSM and greater heterogeneity in cold and arid regions and higher PSM and lower heterogeneity in warm and humid regions. WS-1m in tropical zone (TRZ), ARZ and QTZ peaked in summer, while that in TEZ and COZ was the lowest in summer. Soil profile became wetter in wet zone and wet season and drier in dry zone and dry season over the last 40 years. WS-1m in TRZ significantly increased after 2004-2009, and that in ARZ increased and decreased during 1985-1986 and 2013-2014, respectively. The main cycles of WS-1m over China were 5 a and 11 a.
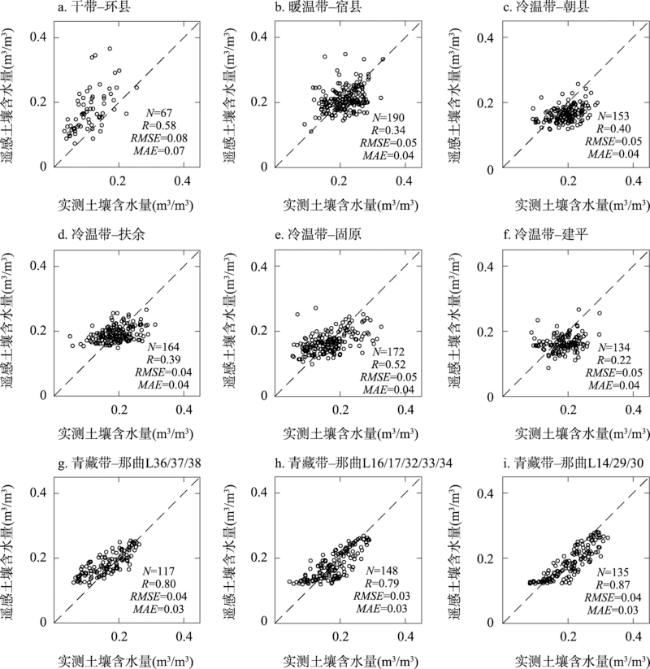
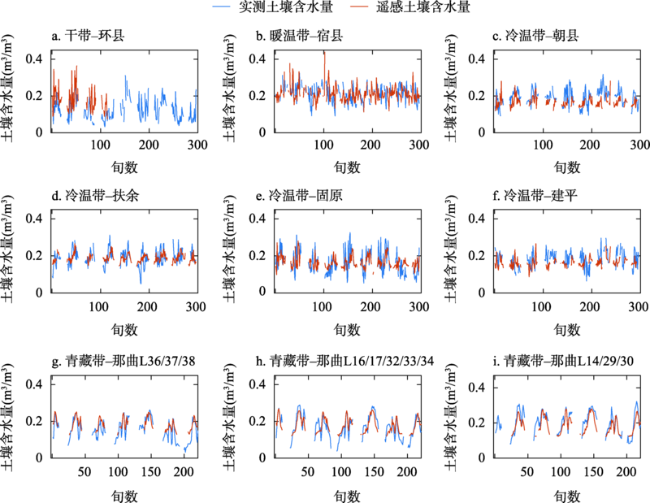
图3 实测与遥感土壤含水量的散点分布Fig. 3 Scatter plots of in-situ observed and remotely sensed soil water content |
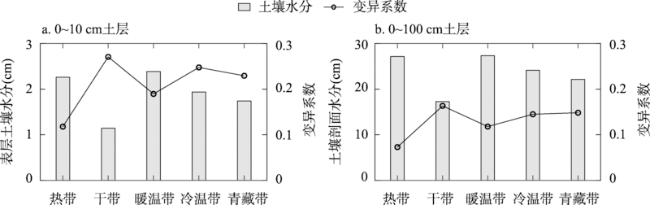
图9 不同气候带多年平均表层土壤水分和土壤剖面水分的平均值与空间变异系数Fig. 9 Mean and spatial coefficient of variation of multi-year average surface soil moisture and profile soil moisture in different climatic zones |
表1 1980—2019年表层土壤水分和土壤剖面水分的变化趋势Tab. 1 Trend of surface soil moisture and profile soil moisture from 1980 to 2019 (cm/10年) |
| 地区 | 全年 | 春季 | 夏季 | 秋季 | 冬季 | |||||||||
|---|---|---|---|---|---|---|---|---|---|---|---|---|---|---|
| 表层 | 剖面 | 表层 | 剖面 | 表层 | 剖面 | 表层 | 剖面 | 表层 | 剖面 | |||||
| 全国 | -0.03 | -0.25 | -0.03 | -0.21 | 0.04* | 0.27* | -0.02 | -0.11 | -0.13** | -0.94** | ||||
| 热带 | 0.07** | 0.48** | 0.03 | 0.20 | 0.06** | 0.47** | 0.08** | 0.72** | 0.09** | 0.52** | ||||
| 干带 | -0.02** | -0.16** | -0.02** | -0.13** | 0.02** | 0.13** | 0.00 | -0.04 | -0.06** | -0.58** | ||||
| 暖温带 | 0.00 | 0.05 | 0.01 | 0.06 | 0.07** | 0.50** | -0.04* | -0.26 | -0.03 | -0.10 | ||||
| 冷温带 | 0.00 | 0.01 | -0.01 | -0.02 | 0.03* | 0.20* | 0.01 | 0.13 | -0.04* | -0.28** | ||||
| 青藏带 | -0.02 | -0.16 | -0.05** | -0.38** | 0.04* | 0.32* | -0.06* | -0.48* | -0.02 | -0.08 | ||||
注:*和**分别表示在0.05和0.01水平上显著;大部分地区生长季土壤水分的变化趋势不显著,故不列入表中。 |
表2 表层土壤水分与土壤剖面水分的主要周期Tab. 2 Main cycles of surface soil moisture and profile soil moisture (年) |
| 地区 | 全年 | 春季 | 夏季 | 秋季 | 冬季 | 生长季 | |||||||||||
|---|---|---|---|---|---|---|---|---|---|---|---|---|---|---|---|---|---|
| 表层 | 剖面 | 表层 | 剖面 | 表层 | 剖面 | 表层 | 剖面 | 表层 | 剖面 | 表层 | 剖面 | ||||||
| 全国 | — | — | 5 | 5 | 5 | 5 | 4 | 4 | — | 12 | 7 | 7 | |||||
| 热带 | 6/2 | 7/2 | 8 | 8 | 6 | 6 | 5/2 | 6/2 | 5 | 9/2 | 6/2 | 7 | |||||
| 干带 | 11/8/3 | — | 8/3 | 8/5/3 | 11/5/2 | 11/5/2 | 7 | 7 | 11 | 11 | 2 | 7/2 | |||||
| 暖温带 | 12/7/3 | 7/3 | 7 | 7 | 7/2 | 7/2 | 12/5/3 | 12/5/3 | 12/3 | 12/6/3 | 7 | 7 | |||||
| 冷温带 | 10 | 10 | 10/5 | 10/5 | 6/9 | 6/10 | 10 | 9 | 11/4 | 11 | 9 | 9/6 | |||||
| 青藏带 | 5 | — | 11/6 | 11/6/4 | 5/8 | 5/8 | 4 | 4 | 11/4 | 7/12/3 | 5 | 5/8 | |||||
注:“—”表示在研究时段内未识别出周期。 |
真诚感谢两位匿名评审专家在论文评审中所付出的时间和精力,评审专家对本文的研究在数据质量控制、随机森林算法表述和研究结果的合理性解释等方面提出了宝贵的修改意见,使本文获益匪浅。
| [1] |
|
| [2] |
|
| [3] |
|
| [4] |
|
| [5] |
|
| [6] |
|
| [7] |
|
| [8] |
刘苏峡, 邢博, 袁国富, 等. 中国根层与表层土壤水分关系分析. 植物生态学报, 2013, 37(1): 1-17.
[
|
| [9] |
|
| [10] |
|
| [11] |
|
| [12] |
| [13] |
|
| [14] |
|
| [15] |
|
| [16] |
|
| [17] |
|
| [18] |
|
| [19] |
|
| [20] |
|
| [21] |
|
| [22] |
|
| [23] |
|
| [24] |
|
| [25] |
刘苏峡, 毛留喜, 莫兴国, 等. 黄河沿岸陕豫区土壤水分的空间变化特征及其驱动力因子分析. 气候与环境研究, 2008, 13(5): 645-657.
[
|
| [26] |
郝志新, 郑景云, 葛全胜. 黄河中下游地区降水变化的周期分析. 地理学报, 2007, 62(5): 537-544.
[
|
| [27] |
谢庄, 曹鸿兴, 李慧, 等. 近百余年北京气候变化的小波特征. 气象学报, 2000, 58(3): 362-369.
[
|
| [28] |
|
| [29] |
|
| [30] |
申晓骥, 安如. 欧空局主、被动微波土壤湿度产品的比较验证. 遥感信息, 2017, 32(2): 89-93.
[
|
| [31] |
赖欣, 文军, 岑思弦, 等. CLM4. 0模式对中国区域土壤湿度的数值模拟及评估研究. 大气科学, 2014, 38(3): 499-512.
[
|
| [32] |
张蕾, 吕厚荃, 王良宇, 等. 中国土壤湿度的时空变化特征. 地理学报, 2016, 71(9): 1494-1508.
[
|
| [33] |
卓嘎, 巴桑曲珍, 杜军. 青藏高原土壤湿度时空分布特征研究进展. 高原山地气象研究, 2020, 40(2): 89-96.
[
|
| [34] |
|
| [35] |
|
| [36] |
|
| [37] |
|
| [38] |
|
| [39] |
赵东升, 高璇, 吴绍洪, 等. 基于自然分区的1960-2018年中国气候变化特征. 地球科学进展, 2020, 35(7): 750-760.
[
|
| [40] |
罗红霞, 戴声佩, 李茂芬, 等. 海南岛1959-2015年气候变化特征分析. 江苏农业科学, 2018, 46(15): 261-268.
[
|
| [41] |
于淑秋, 林学椿, 徐祥德. 我国西北地区近50年降水和温度的变化. 气候与环境研究, 2003, 8(1): 9-18.
[
|
| [42] |
|
| [43] |
毕超, 单楠, 毕华兴. 西北极端干旱区近54年降水量和温度变化趋势. 中国水土保持科学, 2015, 13(3): 90-96.
[
|
| [44] |
李哲, 丁永建, 陈艾姣, 等. 1960-2019年西北地区气候变化中的Hiatus现象及特征. 地理学报, 2020, 75(9): 1845-1859.
[
|
| [45] |
李启芬, 吴哲红, 王兴菊, 等. 1981年以来中国夏季降水变化特征及其与SST和前期环流的联系. 高原气象, 2020, 39(1): 58-67.
[
|
| [46] |
刘扬, 韦志刚. 近50年中国北方不同地区降水周期趋势的比较分析. 地球科学进展, 2012, 27(3): 337-346.
[
|
| [47] |
卢鹤立, 邵全琴, 刘纪远, 等. 近44年来青藏高原夏季降水的时空分布特征. 地理学报, 2007, 62(9): 946-958.
[
|
| [48] |
韦志刚, 黄荣辉, 董文杰. 青藏高原气温和降水的年际和年代际变化. 大气科学, 2003, 27(2): 157-170.
[
|
| [49] |
|
| [50] |
|
| [51] |
|
| [52] |
|
| [53] |
|
| [54] |
刘苏峡, 邓珊珊, 莫兴国, 等. 巨型流域水质量变化指标与极移变化的联系. 中国科学: 地球科学, 2018, 48(7): 899-911.
[
|
| [55] |
|
/
| 〈 |
|
〉 |