
历史地理视角下丝绸之路空间格局及影响研究
|
林小标(1991-),男,福建福清人,博士研究生,主要研究方向为城市历史文化地理、土地利用管理与区域规划。E-mail:863158425@qq.com |
收稿日期: 2021-12-22
录用日期: 2022-03-08
网络出版日期: 2023-01-11
基金资助
国家自然科学基金重点项目(41430635)
国家自然科学基金项目(42171171)
国家自然科学基金项目(42171173)
教育部人文社会科学研究规划基金项目(19YJAZH023)
福建省社科联基地重大项目(FJ2020JDZ038)
南京市社会科学基金项目(20ZX01)
Spatial distribution of the Silk Roads and influence from the perspective of historical geography
Received date: 2021-12-22
Accepted date: 2022-03-08
Online published: 2023-01-11
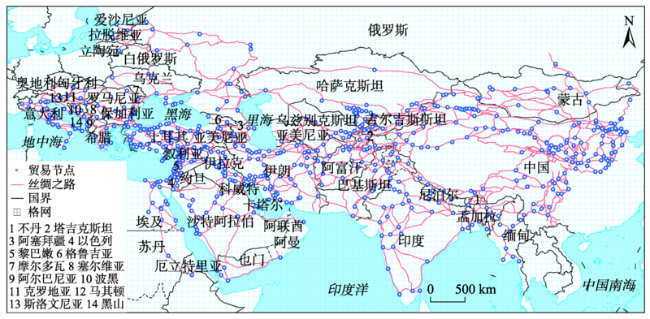
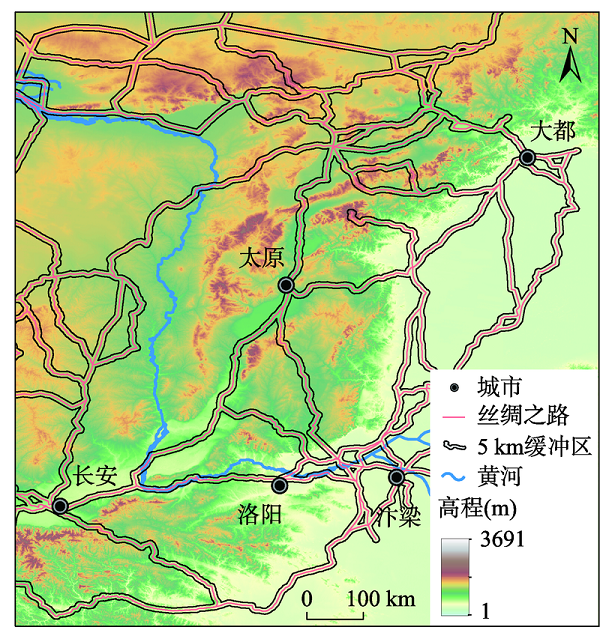
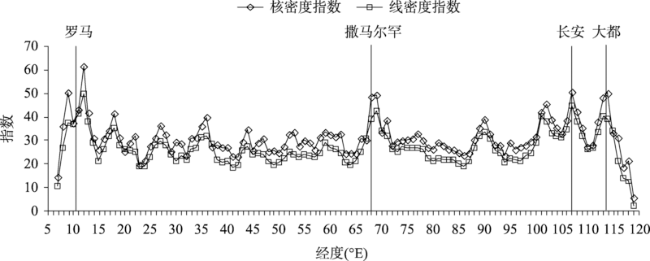
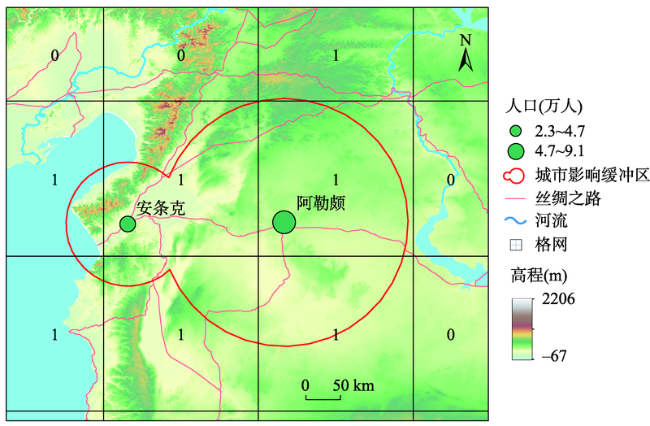
已有的“一带一路”相关研究已逐步引起了学界对历史文化资源于今日发展影响的关注,然而作为“一带一路”倡议的历史依托和出发点,丝绸之路相关量化研究仍处于起步阶段。从文明的角度来说,如何认识丝绸之路是当代中国理解全球的关键。运用OLS、Logistic回归等手段,定量探讨了丝绸之路路线的形成动因以及其对历史及当代的影响。结果表明:① 丝绸之路道路密度分布总体处于波动状态,在以罗马、长安、大都为代表的交通网络起始点以及撒马尔罕、塔什干为代表的内线重要中转枢纽处密度数值大幅提高。② 作为商业贸易通道,丝绸之路路线选择影响最大的因素是地理因子,主要倾向于低坡度、高起伏度的地区,这一点在中亚复杂山地地形中表现得尤为明显。③ 丝绸之路的开辟与通畅,对当时社会经济、城市发展起到了显著的作用。丝绸之路道路密度同距最近海岸距离、纬度、历史文明指数等指标一道构成了古代城市分布的主要影响因素。④ 丝绸之路对区域经济发展的正面影响具有一定的持续性,其对今日经济的发展仍起着难以否认的支撑作用。丝绸之路道路密度每增加1%,所在区域夜间灯光指数增加0.373。本文通过横跨历史学、地理学、经济学的探索能够很好地提供差异化理论视角和技术手段助益,为相关研究的开展起到一定的参考与启发作用,同时也为“一带一路”相关理论的完善提供理论支撑与历史证明。
林小标 , 李娜 , 陆玉麒 , 周颖 , 李玉良 . 历史地理视角下丝绸之路空间格局及影响研究[J]. 地理研究, 2022 , 41(11) : 3069 -3087 . DOI: 10.11821/dlyj020211223
The existing "B&R" studies have gradually drawn attention to the influence of historical and cultural resources on today's development. However, as the historical support and starting point of the Belt and Road Initiative, the quantitative studies related to the Silk Roads are still in their initial stage. From a civilizational perspective, how the Silk Road is understood is key to contemporary China's understanding of the global situation. Using OLS Regression, Logistic Regression and other means, we quantitatively explored the driving factors influencing the formation of the Silk Roads and Silk Roads' influence on the historical and contemporary world. Some conclusions can be drawn as follows: (1) The density distribution of the Silk Roads is generally fluctuating. The density value has increased significantly at the starting points of the transportation network represented by Rome, Chang'an, and Dayidu, and the important internal transit hubs represented by Samarkand and Tashkent. (2) The analysis of the influencing factors of the Silk Roads shows that, as a commercial trade route, the most influential factor on its route selection is geography, which mainly favors areas with low slope and high ruggedness, and this is especially evident in the complex mountainous terrain of Central Asia. (3) The opening and unobstruction of the Silk Roads played a significant role in the socio-economic, and urban development in history. The density of the Silk Roads, together with the distance from the nearest coastline, latitude, historical civilization index and other indicators, constituted the main influencing factors for the distribution of ancient cities. (4) The positive impact of the Silk Roads on regional economic development has a certain persistence, and the Silk Roads continue to play an undeniable role in supporting economic development today. For every 1% increase in road density of the Silk Roads, the night light index of the region where it is located increases by 0.373. This paper can provide differentiated theoretical perspectives and technical tools through the exploration of history, geography and economics, serve as a reference and inspiration for the development of related studies, and offer theoretical support and historical evidence for the improvement of the theory of "B&R".
Key words: Silk Roads; "B&R" Initiative; spatial distribution; persistence; Eurasia
表1 数据来源与描述性统计Tab. 1 Data sources and descriptive statistics |
| 维度 | 指标 | 单位 | 均值 | 标准差 | 原始数据来源 |
|---|---|---|---|---|---|
| 因变量 | |||||
| 丝绸之路道路密度 | % | 12.166 | 7.730 | — | |
| 当代道路密度 | % | [64] | |||
| 1300A.D.城市 | — | 0.205 | 0.404 | [65] | |
| 夜间灯光指数 | % | 33.821 | 24.400 | [69] | |
| 人口(2015年) | 万人 | 63.051 | 25.712 | [92] | |
| 自变量 | |||||
| 坐标方位 | 纬度 | ° | 36.687 | 10.359 | ArcGIS计算 |
| 经度 | ° | 64.984 | 28.254 | ArcGIS计算 | |
| 高程 | m | 8.900 | 10.618 | [73] | |
| 地形地貌 | 坡度 | ° | 1.590 | 2.279 | ArcGIS计算 |
| 起伏度 | — | 7.882 | 8.700 | ArcGIS计算 | |
| GPP | gC /(m2·day) | 533.340 | 535.139 | [74] | |
| 农业禀赋与发展状况 | 可耕地比例 | % | 22.857 | 25.037 | [75] |
| 可灌溉比例 | % | 10.033 | 16.001 | [76] | |
| 可牧地比例 | % | 27.271 | 27.524 | [75] | |
| 历史文明指数1 | — | 28.690 | 15.380 | [72] | |
| 历史文明指数2 | — | 31.676 | 11.891 | [72] | |
| 区位交通条件 | 距最近城市距离 | km | 2.616 | 2.266 | [65] |
| 距最近水源距离 | km | 0.116 | 0.121 | [77] | |
| 距最近海岸距离 | km | 7.477 | 6.515 | ArcGIS计算 | |
| 气候条件 | 多年均温 | ℃ | 13.092 | 9.041 | [78] |
| 多年均降水量 | mm | 571.351 | 592.897 | [78] |
注:由于核心因变量丝绸之路道路密度数值较小,为便于叙述,部分指标单位采用扩大化处理。 |
表2 丝绸之路密度影响因素的回归结果Tab. 2 Regression results of influencing factors for Silk Roads′ density |
| 自变量 | 因变量:丝绸之路密度 | |||||
|---|---|---|---|---|---|---|
| 系数 | 标准误 | 标准化系数 | T值 | P值 | VIF | |
| 纬度 | 0.212 | 0.022 | 0.301 | 9.567 | 0.000*** | 3.901 |
| 经度 | 0.015 | 0.008 | 0.057 | 1.882 | 0.060 | 2.535 |
| 高程 | 0.018 | 0.028 | 0.028 | 0.629 | 0.530 | 7.898 |
| 坡度 | -1.535 | 0.117 | -0.473 | -13.124 | 0.000*** | 5.059 |
| 起伏度 | 0.671 | 0.028 | 0.814 | 23.950 | 0.000*** | 2.930 |
| GPP | -0.000 | 0.000 | -0.028 | -0.932 | 0.351 | 2.970 |
| 可耕地比例 | 0.027 | 0.009 | 0.090 | 2.989 | 0.003** | 2.830 |
| 可灌溉比例 | 0.081 | 0.018 | 0.139 | 4.487 | 0.000*** | 1.941 |
| 可牧地比例 | 0.023 | 0.006 | 0.089 | 4.062 | 0.000*** | 1.565 |
| 历史文明指数1 | 0.050 | 0.013 | 0.107 | 3.770 | 0.000*** | 2.440 |
| 距最近城市距离 | -0.339 | 0.065 | -0.117 | -5.193 | 0.000*** | 1.921 |
| 距最近河流距离 | -4.160 | 1.033 | -0.073 | -4.028 | 0.000*** | 1.083 |
| 距最近海岸距离 | -0.053 | 0.035 | -0.048 | -1.508 | 0.132 | 3.081 |
| 温度 | 1.349 | 0.811 | 0.068 | 1.663 | 0.096 | 6.633 |
| 降水 | -0.477 | 0.197 | -0.078 | -2.429 | 0.015* | 3.428 |
| 常数项 | -2.520 | 3.760 | — | -0.670 | 0.503 | — |
注:*p<0.05;**p<0.01;***p<0.001。 |
表3 古代城市分布影响因素Logistic回归结果Tab. 3 Logistic regression results of influencing factors for ancient cities |
| 自变量 | 因变量:1300A.D.城市(中国元朝大德四年) | 因变量:1300A.D.—1500A.D.新兴城市 | |||||||
|---|---|---|---|---|---|---|---|---|---|
| 回归系数 | 标准误 | P值 | OR值 | 回归系数 | 标准误 | P值 | OR值 | ||
| 丝绸之路密度 | 0.043 | 0.011 | 0.000*** | 1.044 | 0.067 | 0.025 | 0.006** | 1.069 | |
| 纬度 | 0.042 | 0.016 | 0.009** | 1.043 | -0.008 | 0.051 | 0.883 | 0.992 | |
| 经度 | -0.002 | 0.004 | 0.521 | 0.998 | 0.023 | 0.015 | 0.133 | 1.023 | |
| 高程 | -0.020 | 0.022 | 0.364 | 0.980 | -0.278 | 0.081 | 0.001** | 0.757 | |
| 坡度 | 0.032 | 0.080 | 0.691 | 1.032 | 0.030 | 0.294 | 0.918 | 1.031 | |
| 起伏度 | 0.018 | 0.016 | 0.248 | 1.018 | 0.001 | 0.000 | 0.062 | 1.001 | |
| GPP | 0.000 | 0.000 | 0.018 | 1.000 | 0.000 | 0.001 | 0.593 | 1.000 | |
| 可耕地比例 | 0.006 | 0.005 | 0.224 | 1.006 | -0.004 | 0.011 | 0.700 | 0.996 | |
| 可灌溉比例 | 0.023 | 0.006 | 0.000*** | 1.024 | 0.026 | 0.014 | 0.063 | 1.026 | |
| 可牧地比例 | 0.005 | 0.004 | 0.244 | 1.005 | 0.014 | 0.016 | 0.379 | 1.014 | |
| 历史文明指数1 | 0.053 | 0.009 | 0.000*** | 1.054 | 0.034 | 0.027 | 0.201 | 1.035 | |
| 据最近河流距离 | 0.798 | 0.535 | 0.136 | 2.222 | 2.520 | 1.132 | 0.026* | 12.429 | |
| 据最近海岸距离 | -0.116 | 0.022 | 0.000*** | 0.890 | -0.093 | 0.079 | 0.237 | 0.911 | |
| 多年均温 | 0.509 | 0.736 | 0.49 | 1.663 | -3.248 | 2.523 | 0.198 | 0.039 | |
| 多年均降水量 | -0.123 | 0.105 | 0.24 | 0.884 | -0.691 | 0.388 | 0.075 | 0.501 | |
| 常量 | -6.549 | 3.254 | 0.043* | 0.001 | 12.398 | 11.384 | 0.276 | 24.234 | |
注:*p<0.05;**p<0.01;***p<0.001。 |
表4 丝绸之路与当代发展联系的回归结果Tab. 4 Regression results between Silk Roads and modern development |
| 变量 | 夜间灯光指数 | 人口 | 现代道路 | ||||||||
|---|---|---|---|---|---|---|---|---|---|---|---|
| 系数 | 标准化系数 | P值 | 系数 | 标准化系数 | P值 | 系数 | 标准化系数 | P值 | |||
| 丝绸之路密度 | 0.068 | 0.091 | 0.000*** | 0.014 | 0.041 | 0.000*** | 0.001 | 0.060 | 0.059 | ||
| 纬度 | -0.014 | -0.025 | 0.493 | 0.096 | 0.385 | 0.000*** | 0.001 | 0.055 | 0.371 | ||
| 经度 | -0.040 | -0.205 | 0.000*** | 0.103 | 1.136 | 0.000*** | -0.002 | -0.369 | 0.000*** | ||
| 高程 | -0.163 | -0.335 | 0.000*** | -0.019 | -0.086 | 0.010* | -0.003 | -0.189 | 0.023* | ||
| 坡度 | -0.043 | -0.017 | 0.698 | 0.053 | 0.046 | 0.138 | -0.000 | -0.008 | 0.920 | ||
| 起伏度 | -0.014 | -0.023 | 0.542 | 0.000 | 0.116 | 0.000*** | 0.000 | -0.021 | 0.752 | ||
| GPP | 0.001 | 0.092 | 0.005** | 0.001 | 0.113 | 0.000*** | 0.000 | 0.240 | 0.004** | ||
| 可耕地比例 | -0.042 | -0.181 | 0.000*** | -0.004 | -0.040 | 0.043* | -0.001 | -0.140 | 0.002** | ||
| 可灌溉比例 | 0.164 | 0.361 | 0.000*** | 0.023 | 0.109 | 0.000*** | 0.001 | 0.123 | 0.002** | ||
| 可放牧比例 | -0.011 | -0.053 | 0.025* | 0.012 | 0.130 | 0.000*** | 0.000 | 0.009 | 0.828 | ||
| 历史文明指数2 | 0.063 | 0.134 | 0.000*** | 0.004 | 0.020 | 0.241 | 0.002 | 0.132 | 0.001** | ||
| 据最近河流距离 | 3.886 | 0.088 | 0.000*** | -0.044 | -0.002 | 0.859 | 0.141 | 0.135 | 0.000*** | ||
| 据最近海岸距离 | -0.146 | -0.170 | 0.000*** | -0.298 | -0.754 | 0.000*** | -0.001 | -0.052 | 0.296 | ||
| 温度 | -4.178 | -0.271 | 0.000*** | -0.625 | -0.088 | 0.004** | -0.066 | -0.133 | 0.074 | ||
| 降水 | 0.172 | 0.036 | 0.293 | -0.941 | -0.426 | 0.000*** | -0.003 | -0.156 | 0.754 | ||
| 常数项 | 22.370 | — | 0.000*** | 4.812 | — | 0.000*** | 0.375 | — | 0.028* | ||
注:*p<0.05;**p<0.01;***p<0.001。 |
衷心感谢两位匿名评审专家在论文评审中所付出的宝贵时间和精力。评审专家在文献综述、模型完善、语言规范及行文逻辑等方面提出的修改意见,使本文获益匪浅。
| [1] |
阙维民. 世界遗产预备项目“丝绸之路-海路-中国段”研究. 地理科学, 2017, 37(11): 1678-1688.
[
|
| [2] |
|
| [3] |
张晓平, 高珊珊, 陈明星, 等. 李希霍芬的中国考察及其当代人文: 经济地理学价值刍议. 世界地理研究, 2020, 29(1): 8-17.
[
|
| [4] |
杜德斌, 马亚华. “一带一路”: 中华民族复兴的地缘大战略. 地理研究, 2015, 34(6): 1005-1014.
[
|
| [5] |
马瑞琼. 8-10世纪丝绸之路中段呼罗珊大道考述. 中国历史地理论丛, 2016, 31(3): 17-28.
[
|
| [6] |
乌云毕力格. 丝路沿线的民族交融: 占星家与乌珠穆沁部. 历史研究, 2020, (1): 92-112+221.
[
|
| [7] |
崔思朋. 明清时期丝绸之路上农作物传播及对中国的影响. 全球史评论, 2021, (1):101-122+342.
[
|
| [8] |
张萍. 地理信息系统(GIS)与中国历史研究. 史学理论研究, 2018, (2): 35-47+158.
[
|
| [9] |
|
| [10] |
张抗. 新丝绸之路和中国地缘格局新思维. 世界地理研究, 2015, 24(3): 59-64.
[
|
| [11] |
|
| [12] |
昝涛. “一带一路”、“丝路学”与区域研究. 新丝路学刊, 2018,(1): 134-143.
[
|
| [13] |
|
| [14] |
|
| [15] |
孙程九, 张勤勤. 气候变迁、政府能力与王朝兴衰: 基于中国两千年来历史经验的实证研究. 经济学(季刊), 2019, 18(1): 311-336.
[
|
| [16] |
|
| [17] |
林小标, 郑衡泌, 伍世代, 等. 两汉侯国时空特征及其影响因素分析. 地理学报, 2017, 72(4): 723-736.
[
|
| [18] |
霍仁龙, 杨煜达. 田野调查和GIS方法在近300年来小尺度区域土地利用变化研究中的应用. 中国历史地理论丛, 2018, 33(4): 62-69.
[
|
| [19] |
蒋秀林. 近代芜湖城市空间形态演变及其影响因素. 中国历史地理论丛, 2017, 32(4): 140-150.
[
|
| [20] |
钱超峰, 杜德斌. 北宋官僚家族网络的空间结构及其演化: 基于CBDB和CHGIS的考察. 历史地理研究, 2019, 39(2): 83-94+161-162.
[
|
| [21] |
郭岩, 杨昌鸣, 张雨洋. 场域视角下清代北京宣南雅文化核心区范围及空间关联特征. 地理研究, 2020, 39(4): 836-852.
[
|
| [22] |
|
| [23] |
|
| [24] |
|
| [25] |
|
| [26] |
马锦, 李发源, 庞国伟, 等. 古陆上丝绸之路复原及沿线基本地理特征分析. 地理与地理信息科学, 2017, 33(4): 123-129.
[
|
| [27] |
张萍. GIS技术与二千年丝绸之路道路复原研究的新思路. 中国史研究动态, 2017,(2): 57-61.
[
|
| [28] |
张萍. 丝绸之路交通地理定位与道路网络复原研究. 首都师范大学学报(社会科学版), 2018,(2):33-40.
[
|
| [29] |
郝志新, 梁亚妮, 刘洋, 等. 古丝绸之路沿线地区千年冷暖变化的若干特征. 地理科学进展, 2018, 37(4):485-494.
[
|
| [30] |
安成邦, 王伟, 段阜涛, 等. 亚洲中部干旱区丝绸之路沿线环境演化与东西方文化交流. 地理学报, 2017, 72(5): 875-891.
[
|
| [31] |
|
| [32] |
贾百俊, 李建伟, 王旭红. 丝绸之路沿线城镇空间分布特征研究. 人文地理, 2012, 27(2):103-106.
[
|
| [33] |
|
| [34] |
王丰龙, 司月芳. “一带一路”倡议背景下亚投行设立对中国海外投资的影响研究. 世界地理研究, 2019, 28(5): 1-10.
[
|
| [35] |
|
| [36] |
马卫, 曹小曙, 黄晓燕, 等. 丝绸之路沿线交通基础设施空间经济溢出效应测度. 经济地理, 2018, 38(3): 21-29+71.
[
|
| [37] |
陆梦秋, 陈娱, 陆玉麒. “一带一路”倡议下中国陆海运输的空间竞合格局. 地理研究, 2018, 37(2): 404-418.
[
|
| [38] |
陆梦秋, 陈娱, 陆玉麒. “一带一路”倡议下欧亚大陆陆海运输的空间均衡分析. 地理学报, 2018, 73(8): 1526-1539.
[
|
| [39] |
|
| [40] |
|
| [41] |
|
| [42] |
|
| [43] |
余江, 田庆立. 当前国别和区域研究的若干重大问题. 国别和区域研究, 2021, 6(1): 27-33+252.
[
|
| [44] |
马腾, 葛岳静, 刘晓凤, 等. 中美两国在南美洲的地缘经济格局比较. 经济地理, 2018, 38(3): 1-10.
[
|
| [45] |
邱桃, 张士锋, 贤雯. 中南半岛五国水资源分区研究. 地理研究, 2021, 40(5): 1421-1431.
[
|
| [46] |
刘倩, 李富佳, 庄岩, 等. 蒙古国省级行政单元投资环境评价与投资对策研究. 地理研究, 2021, 40(11): 3046-3062.
[
|
| [47] |
王佳果, 吴忠军, 曹宏丽. “一带一路”背景下民族地区入境旅游时空特征. 经济地理, 2017, 37(7): 208-215.
[
|
| [48] |
尹旭, 李鹏, 封志明, 等. 2000-2019年越南人口时空分异特征及其演变类型. https://kns.cnki.net/kcms/detail/31.1626.P.20210721.1823.004.html, 2022-09-03.
[
|
| [49] |
李奇, 董晔, 刘云刚. 巴基斯坦城镇体系特征及其影响因素. 热带地理, 2021, 41(2): 290-302.
[
|
| [50] |
葛全胜, 何凡能, 郑景云, 等. 21世纪中国历史地理学发展的思考. 地理研究, 2004, 23(3): 374-384.
[
|
| [51] |
|
| [52] |
胡宇蒙, 晏波, 张萍. 两汉丝绸之路交通数据集. http://www.csdata.org/p/184/3/, 2022-09-20.
[
|
| [53] |
徐雪强, 张萍. 唐代丝绸之路东中段交通线路数据集(618-907年). http://www.csdata.org/p/183/, 2022-09-20.
[
|
| [54] |
程军, 张萍. 蒙元时期丝绸之路旅行家行程GIS数据集. http://www.csdata.org/p/185/, 2022-09-20.
[
|
| [55] |
|
| [56] |
|
| [57] |
谭其骧. 中国历史地图集:第五册. 北京: 中国地图出版社, 1987: 3-10.
[
|
| [58] |
王姣娥, 莫辉辉, 张萌, 等. 简明中国交通历史地图集. 北京: 星球地图出版社, 2018: 20-21.
[
|
| [59] |
|
| [60] |
|
| [61] |
|
| [62] |
|
| [63] |
|
| [64] |
|
| [65] |
|
| [66] |
吴健生, 刘浩, 彭建, 等. 中国城市体系等级结构及其空间格局: 基于DMSP/OLS夜间灯光数据的实证. 地理学报, 2014, 69(4): 759-770.
[
|
| [67] |
吴子璇, 张强, 宋长青, 等. 珠三角城市化对气温时空差异性影响. 地理学报, 2019, 74(11): 2342-2357.
[
|
| [68] |
曾冰. 基于NPP/VIIRS夜间灯光数据的湘鄂赣省际交界区县域经济空间格局及影响因素. 地理科学, 2020, 40(6): 900-907.
[
|
| [69] |
National Aeronautics and Space Administration. Earth at night: Flat maps. https://earthobservatory.nasa.gov/features/NightLights/page3.php, 2022-09-20.
|
| [70] |
|
| [71] |
|
| [72] |
|
| [73] |
|
| [74] |
|
| [75] |
|
| [76] |
Food and Agriculture Organization. Area equipped for irrigation as a percentage of land area. http://www.fao.org/nr/water/aquamaps/index.html, 2022-09-20.
|
| [77] |
|
| [78] |
|
| [79] |
|
| [80] |
|
| [81] |
刘昫. 旧唐书. 北京: 中华书局, 1975: 941.
[
|
| [82] |
班固. 汉书. 北京: 中华书局, 1964: 3342-3384.
[
|
| [83] |
|
| [84] |
哈凯, 丁庆龙, 门明新, 等. 山地丘陵区土地利用分布及其与地形因子关系: 以河北省怀来县为例. 地理研究, 2015, 34(5): 909-921.
[
|
| [85] |
吕晨, 蓝修婷, 孙威. 地理探测器方法下北京市人口空间格局变化与自然因素的关系研究. 自然资源学报, 2017, 32(8): 1385-1397.
[
|
| [86] |
荣新江. 中古中国与粟特文明. 生活·读书·新知三联书店, 2014: 126-142.
[
|
| [87] |
|
| [88] |
欧阳修, 宋祁. 新唐书. 北京: 中华书局 , 1975: 6261.
[
|
| [89] |
|
| [90] |
|
| [91] |
|
| [92] |
张莉. 楼兰古绿洲的河道变迁及其原因探讨西北历史环境研究. 中国历史地理论丛, 2001, 16(1): 87-98.
[
|
| [93] |
|
| [94] |
|
| [95] |
Center for International Earth Science Information Network. Gridded population of the world, Version 4 (GPWv4): Population density adjusted to match 2015 revision UN WPP country totals, Revision 11, http://sedac.ciesin.columbia.edu/data, 2022-09-20.
|
| [96] |
陈航. 中国交通地理. 北京: 科学出版社, 2000: 35-38.
[
|
| [97] |
|
| [98] |
|
| [99] |
|
| [100] |
|
| [101] |
|
/
| 〈 |
|
〉 |