
长三角地区专精特新“小巨人”企业空间分布及影响因素研究
|
丁建军(1980-),男,湖南衡东人,博士,教授,博士生导师,主要研究方向为区域经济、产业经济。E-mail: latt514@163.com |
收稿日期: 2022-06-13
修回日期: 2022-10-24
网络出版日期: 2023-04-13
基金资助
国家自然科学基金项目(42161033)
湖南省杰出青年科学基金项目(2020JJ2025)
湖南省教育厅科学研究项目重点项目(21A0330)
湖南省研究生科研创新项目(CX20221100)
Spatial distribution and influencing factors of specialized and sophisticated "Little Giants" Enterprises in the Yangtze River Delta
Received date: 2022-06-13
Revised date: 2022-10-24
Online published: 2023-04-13
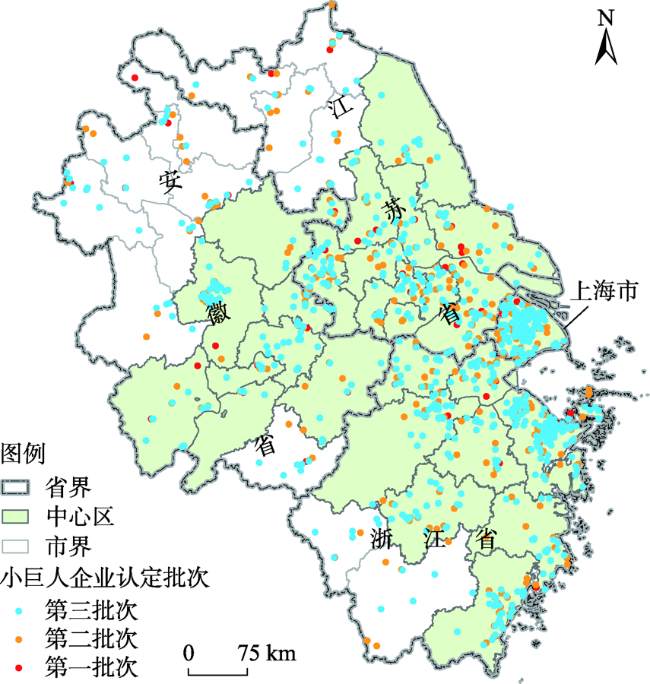
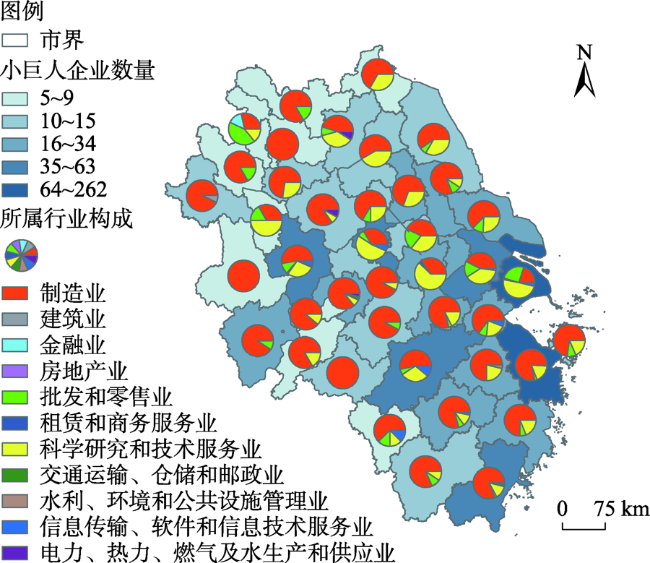
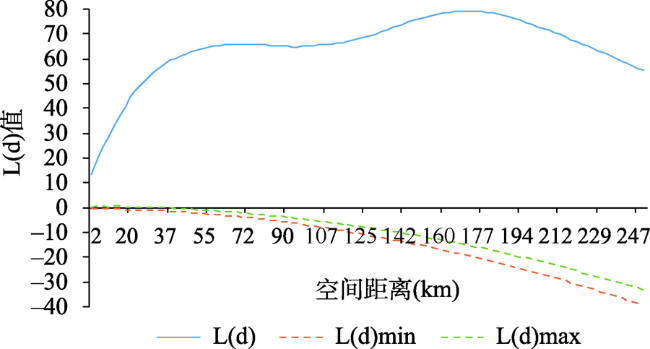
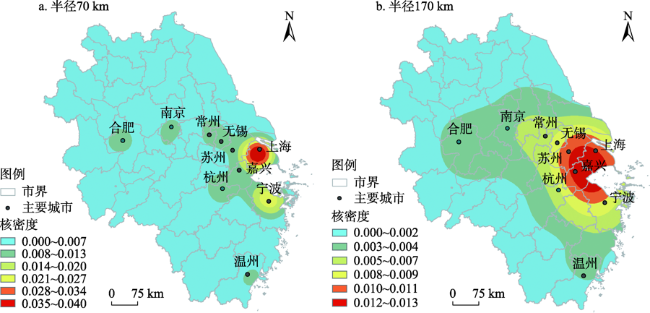
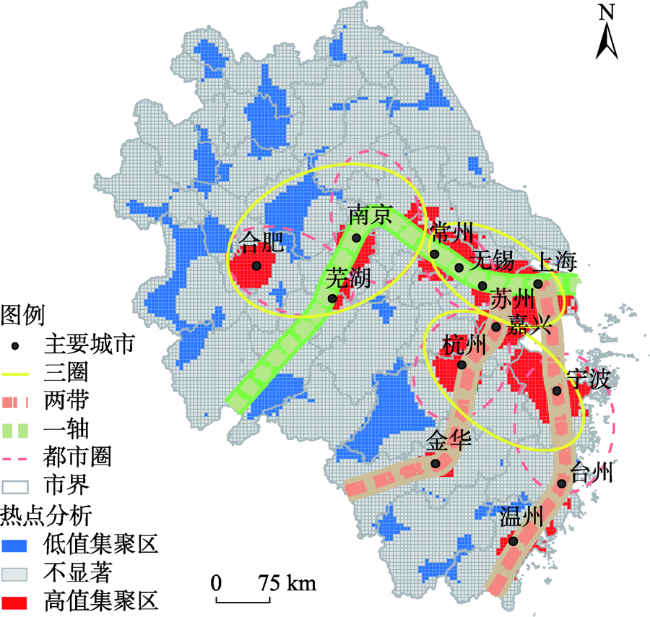
培育专精特新“小巨人”企业是“补链强链”专项行动的关键内容,关注其空间分布格局及成因对促进中小企业转型发展具有重要意义。基于工业和信息化部认定的三批次专精特新“小巨人”企业名单,运用Ripley's K函数、核密度分析以及空间热点聚类等方法,探究长三角地区“小巨人”企业的空间分布与集聚特征,并采用负二项回归模型识别“小巨人”企业空间分布的影响因素。研究发现:① 长三角地区“小巨人”企业行业分布主要集中于制造业,其次是科学研究和技术服务业,而技术密集型制造业、知识密集型服务业“小巨人”企业具有明显的中心城市偏向。② 在不同距离尺度上,“小巨人”企业集聚强度呈现明显的“双峰”特征,对应集聚尺度相当于都市圈内“一小时通勤圈”,由此形成了以上海市为主要核心,宁波市为次要核心,省会城市及部分沿海沿江城市为极点的“两核多极”局部集聚特征和以沿江、临海都市圈为热点区域的“一轴两带三圈”总体空间分布格局。③ 从“小巨人”企业的空间集聚机制来看,交通可达性、土地利用及成本、地理区位、外部支撑条件、产业发展基础、科研创新条件等是影响“小巨人”企业空间分布的主要因素。④ 高技术和战略重点制造业、科研及信息技术服务业“小巨人”企业空间集聚影响因素具有异质性。土地利用及成本方面,前者呈现“亲工业用地价,疏商服用地价”的分布态势,而后者对商服用地价格不敏感;外部支撑条件方面,仅显著影响前者空间分布;产业发展基础方面,物流水平仅对后者分布具有显著作用;科研创新条件方面,前者偏向人力资本集聚,后者则更偏向科研机构集聚。
丁建军 , 王淀坤 , 刘贤 . 长三角地区专精特新“小巨人”企业空间分布及影响因素研究[J]. 地理研究, 2023 , 42(4) : 1009 -1028 . DOI: 10.11821/dlyj020220620
The spatial distribution pattern and causes are of great significance to promote the transformation and development of SMEs, as the cultivation of specialized and sophisticated “Little Giant” Enterprises is a key element of the special action of “strengthening the weakness in the industrial and supply chains”. Based on the list of three batches of “Little Giant”Enterprises recognized by the Ministry of Industry and Information Technology, using Ripley's K function, kernel density analysis, and spatial hotspot clustering to explore the spatial distribution and clustering characteristics of “Little Giant” Enterprises in the Yangtze River Delta. Further, a negative binomial regression model was used to identify the factors affecting the spatial distribution of “Little Giant” Enterprises by combining geospatial data and socioeconomic statistics. The conclusions are drawn as follows: (1) The industry distribution of “Little Giant” Enterprises in the study region mainly cluster in manufacturing industries, followed by scientific research and technology service industries, and the “Little Giant” Enterprises in technology-intensive manufacturing industries and knowledge-intensive service industries cluster in the central cities. (2) At different distance scales, the agglomeration intensity of “Little Giant” Enterprises shows obvious “bimodal” characteristics, and the corresponding agglomeration scale is equivalent to the “one-hour commuting circle” in the metropolitan area, thus it has formed the “two cores and multiple poles” local clustering characteristics with Shanghai as the main core, Ningbo as the secondary core, provincial capital cities and some coastal and riverine cities as the poles, and the “one axis, two belts and three circles” overall spatial distribution pattern with the riverine and coastal metropolitan regions as the hotspot area. (3) From the spatial clustering mechanism of “Little Giant” Enterprises, traffic accessibility, land use and cost, geography location, external support, industrial foundation, scientific research and innovation conditions are the main factors affecting the spatial distribution of “Little Giant” Enterprises. (4) The factors, which influence the spatial agglomeration of "Little Giant" Enterprises in high-tech and strategic focus manufacturing industries, research and information technology service industries, are heterogeneous. In terms of land use and cost, the former shows a distribution trend of “the higher industrial land price but closer, the higher commercial land price then farther away”, while the latter is not sensitive to commercial land price; in terms of external support conditions, they only significantly affect the spatial distribution of the former; in terms of industrial development foundation, logistics level only plays a significant role in the distribution of the latter; in terms of research and innovation conditions, the former is more inclined to human capital agglomeration, while the latter is more inclined to research institutions.
表1 长三角地区“小巨人”企业分布的影响因素选取Tab. 1 Factors influencing the distribution of “Little Giant” Enterprises in the Yangtze River Delta |
| 一级维度 | 影响因素 | 变量描述 | 数据来源 |
|---|---|---|---|
| 自然地理及区位 | 海拔高度 | 网格内平均高程的对数 | 地理空间数据云平台30 m精度DEM高程数据 |
| 亲水性 | 距最近水体距离的对数 | OSM水体矢量数据 | |
| 中心区 | 是否长三角一体化中心区 | 《长江三角洲区域一体化发展规划纲要》 | |
| 距城市建成区距离 | 中国城市2020年建成区数据集 | ||
| 交通可达性 | 短程交通可达性 | 网格内公交车站数 | 高德地图长三角地区POI数据 |
| 即时交通可达性 | 网格内地铁站数 | 高德地图长三角地区POI数据 | |
| 中远程交通可达性 | 网格中心点距最近高速收费站距离的对数 | 高德地图长三角地区POI数据 | |
| 路网密度 | 网格内道路网总长度的对数 | OSM道路网矢量数据 | |
| 土地利用及成本 | 土地利用程度 | 网格内城镇建设用地面积占比 | 中科院资源环境科学数据中心土地利用数据 |
| 工业用地成本 | 网格内工业用地均价 | 中国土地市场网土地出让数据 | |
| 商服用地成本 | 网格内商服用地均价 | 中国土地市场网土地出让数据 | |
| 住房成本 | 网格内房价均价 | 聚汇数据网 | |
| 生活便利性 | 居住便利程度 | 网格内住宅小区数 | 高德地图长三角地区POI数据 |
| 车辆承载程度 | 网格内停车场数 | 高德地图长三角地区POI数据 | |
| 科研创新条件 | 协同创新基础 | 网格内高等院校数 | 高德地图长三角地区POI数据 |
| 网格内科研机构数 | 高德地图长三角地区POI数据 | ||
| 人力资本水平 | 普通本专科在校学生数/地区总人口 | 《中国城市统计年鉴》 | |
| 产业发展基础 | 产业平台 | 网格内产业园区数 | 高德地图长三角地区POI数据 |
| 产业结构 | 二、三产业增加值占地区GDP的比例 | 《中国城市统计年鉴》 | |
| 物流水平 | 公路货运量/行政区面积 | 《中国城市统计年鉴》 | |
| 外部支撑条件 | 信贷资源可得性 | 网格内银行数 | 高德地图长三角地区POI数据 |
| 政府财政支出占比 | 一般公共预算支出占地区GDP的比例 | 《中国城市统计年鉴》 | |
| 外贸依存度 | (货物进口额+货物出口额)/地区GDP | 《中国城市统计年鉴》 |
表2 “小巨人”企业空间分布负二项回归结果Tab. 2 Negative binomial regression results of the spatial distribution of “Little Giant” Enterprises |
| 变量 | 模型1 | 模型2 | 模型3 | 模型4 | 模型5 |
|---|---|---|---|---|---|
| 企业数 | 高技术和战略重点制造业 | 科研及信息技术服务业 | 企业进入 | 企业数 | |
| 平均高程 | -0.048 | 0.038 | -0.108 | -0.065 | -0.024 |
| (-0.93) | (0.63) | (-1.01) | (-1.20) | (-0.46) | |
| 与水体距离 | -0.065** | -0.068* | -0.052 | -0.066* | -0.048 |
| (-1.98) | (-1.71) | (-1.01) | (-1.80) | (-1.52) | |
| 是否中心区 | 1.024*** | 1.437*** | 0.318 | 1.029*** | 0.988*** |
| (5.89) | (6.51) | (0.85) | (5.71) | (5.78) | |
| 与城区距离 | -0.033*** | -0.026* | -0.076*** | -0.040*** | -0.026* |
| (-2.65) | (-1.78) | (-3.22) | (-2.95) | (-1.94) | |
| 公交车站数 | 0.004* | 0.007** | 0.002 | 0.007** | 0.002 |
| (1.73) | (2.48) | (0.68) | (2.41) | (0.86) | |
| 地铁站数 | 0.002 | -0.012 | 0.004 | -0.006 | -0.000 |
| (0.13) | (-0.48) | (0.25) | (-0.30) | (-0.01) | |
| 与高速入口距离 | -0.196*** | -0.161** | -0.152* | -0.186*** | -0.148*** |
| (-3.72) | (-2.37) | (-1.83) | (-3.03) | (-3.02) | |
| 路网密度 | 1.111*** | 1.288*** | 1.220*** | 1.019*** | 1.291*** |
| (7.63) | (7.96) | (4.14) | (7.66) | (10.06) | |
| 建设用地比 | 1.401*** | 1.413*** | 0.915** | 1.546*** | 0.906*** |
| (4.89) | (4.00) | (1.97) | (4.44) | (3.41) | |
| 工业用地价 | 0.813*** | 1.279*** | 0.645* | 0.821*** | 0.721*** |
| (4.42) | (5.17) | (1.91) | (3.77) | (3.70) | |
| 商服用地价 | -0.407*** | -0.677*** | -0.182 | -0.369*** | -0.406*** |
| (-4.81) | (-6.29) | (-1.13) | (-3.57) | (-4.52) | |
| 房价 | -0.349*** | -0.464*** | -0.123 | -0.468*** | -0.305** |
| (-2.62) | (-2.58) | (-0.58) | (-3.01) | (-2.32) | |
| 住宅小区数 | -0.001 | -0.005** | -0.001 | -0.003** | -0.001* |
| (-1.50) | (-2.43) | (-0.86) | (-2.08) | (-1.68) | |
| 停车场数 | -0.009*** | -0.011*** | -0.003* | -0.011*** | -0.006*** |
| (-4.19) | (-4.03) | (-1.75) | (-5.52) | (-5.19) | |
| 科研机构数 | 0.028*** | 0.020 | 0.020** | 0.041*** | 0.024*** |
| (2.95) | (1.33) | (2.17) | (2.72) | (4.20) | |
| 高等院校数 | -0.005 | -0.006 | -0.004 | -0.007 | -0.005 |
| (-1.35) | (-0.79) | (-0.99) | (-1.04) | (-1.63) | |
| 人力资本 | 4.364* | 9.366*** | 5.970* | 4.276 | 5.847*** |
| (1.92) | (3.11) | (1.66) | (1.53) | (2.73) | |
| 产业园区数 | 0.045*** | 0.049*** | 0.034*** | 0.074*** | 0.034*** |
| (7.63) | (6.43) | (5.81) | (7.46) | (8.92) | |
| 产业结构 | -0.020 | -0.061 | -0.031 | -0.021 | -0.037 |
| (-0.71) | (-1.63) | (-0.53) | (-0.65) | (-1.36) | |
| 物流水平 | 0.055 | -0.069 | 0.188** | 0.040 | 0.057 |
| (1.22) | (-1.20) | (2.27) | (0.78) | (1.32) | |
| 银行数 | 0.011** | 0.019*** | -0.005 | 0.017** | 0.008* |
| (2.07) | (2.82) | (-0.69) | (2.13) | (1.93) | |
| 财政支出占比 | 5.361*** | 6.306*** | -1.964 | 5.393*** | 4.432*** |
| (4.42) | (4.13) | (-0.72) | (4.03) | (3.71) | |
| 外贸依存度 | -0.338* | -0.402* | -0.098 | -0.191 | -0.149 |
| (-1.79) | (-1.78) | (-0.32) | (-0.84) | (-0.88) | |
| Constant | -11.013*** | -10.035*** | -14.308*** | -9.452*** | -11.634*** |
| (-3.92) | (-2.81) | (-2.71) | (-3.12) | (-4.41) | |
| lnalpha | 0.215* | 0.518*** | -0.118 | - | - |
| (1.65) | (3.15) | (-0.37) | - | - | |
| Observations | 14427 | 14427 | 14427 | 14427 | 14427 |
| Pseudo R-squared | 0.302 | 0.267 | 0.368 | 0.365 | 0.415 |
| Log pseudolikelihood | -2697 | -1823 | -983.1 | -1946 | -2837 |
注:变量系数下括号内数字为使用稳健标准误的Z统计量,*、**和***分别表示在10%、5%和1%的置信度水平下显著。 |
真诚感谢匿名评审专家在论文评审中所付出的时间和精力,专家对本文的文章结构、文献回顾、影响因素指标选取、图表展示与结果分析、结论与讨论内容梳理等方面提出的针对性修改意见,使本文获益匪浅。
| [1] |
苟尤钊, 吕琳媛. 多样性VS高效率: 对“黄金十年”和“失落十年”的一种新诠释. 财经问题研究, 2019, (11): 23-30.
[
|
| [2] |
董志勇, 李成明. “专精特新”中小企业高质量发展态势与路径选择. 改革, 2021, (10): 1-11.
[
|
| [3] |
工业和信息化部. 优质中小企业梯度培育管理暂行办法. http://www.gov.cn/zhengce/zhengceku/2022-06/02/content_5693548.htm, 2022-06-13.
[Ministry of Industry and Information Techonology of the People's Republic of China. Interim measures for the management of quality SME gradient cultivation. http://www.gov.cn/zhengce/zhengceku/2022-06/02/content_5693548.htm, 2022-06-13.]
|
| [4] |
财政部, 工业和信息化部. 关于支持“专精特新”中小企业高质量发展的通知. http://www.gov.cn/zhengce/zhengceku/2021-02/03/content_5584629.htm, 2022-06-13.
[Ministry of Finance, Ministry of Industry and Information Technology of the People's Republic of China. Notice on supporting high quality development of “specialized and sophisticated” SMEs. http://www.gov.cn/zhengce/zhengceku/2021-02/03/content_5584629.htm, 2022-06-13.]
|
| [5] |
|
| [6] |
|
| [7] |
|
| [8] |
刘颖, 郭琪, 贺灿飞. 城市区位条件与企业区位动态研究. 地理研究, 2016, 35(7): 1301-1313.
[
|
| [9] |
傅十和, 洪俊杰. 企业规模、城市规模与集聚经济: 对中国制造业企业普查数据的实证分析. 经济研究, 2008, 43(11): 112-125.
[
|
| [10] |
陈建军, 崔春梅, 陈菁菁. 集聚经济、空间连续性与企业区位选择: 基于中国265个设区城市数据的实证研究. 管理世界, 2011, (6): 63-75.
[
|
| [11] |
林柄全, 谷人旭, 王俊松, 等. 从集聚外部性走向跨越地理边界的网络外部性: 集聚经济理论的回顾与展望. 城市发展研究, 2018, 25(12): 82-89.
[
|
| [12] |
黄晓东, 马海涛, 苗长虹. 基于创新企业的中国城市网络联系特征. 地理学报, 2021, 76(4): 835-852.
[
|
| [13] |
范剑勇, 刘念, 刘莹莹. 地理距离、投入产出关系与产业集聚. 经济研究, 2021, 56(10): 138-154.
[
|
| [14] |
|
| [15] |
|
| [16] |
|
| [17] |
|
| [18] |
李金华. 我国“小巨人”企业发展的境况与出路. 改革, 2021, (10): 101-113.
[
|
| [19] |
陆岷峰, 高绪阳. 关于新时期进一步推动中小企业群体高质量发展的路径研究: 基于培育“专精特新”中小企业视角. 新疆社会科学, 2022, (1): 1-18.
[
|
| [20] |
张兵, 梅强, 李文元. 江苏省中小企业专精特新发展影响因素研究: 以镇江市为例. 科技管理研究, 2014, 34(11): 80-83.
[
|
| [21] |
刘昌年, 梅强. “专精特新”与小微企业成长路径选择研究. 科技管理研究, 2015, 35(5): 126-130.
[
|
| [22] |
朱天一, 徐天舒, 王卫一. 基于SEM的专精特新企业评价体系优化与应用: 来自苏州297家参评企业的实证分析. 科技与经济, 2018, 31(3): 101-105.
[
|
| [23] |
张璠, 王竹泉, 于小悦. 政府扶持与民营中小企业“专精特新”转型: 来自省级政策文本量化的经验证据. 财经科学, 2022, (1): 116-132.
[
|
| [24] |
张睿, 石晓鹏, 陈英武. “专精特”小巨人企业培育路径研究: 以苏南地区为例. 中国工程科学, 2017, 19(5): 97-102.
[
|
| [25] |
中共中央, 国务院. 长江三角洲区域一体化发展规划纲要. http://www.gov.cn/zhengce/2019-12/01/content_5457442.htm, 2022-06-13.
[Central Committee of the Communist Party of China, General Office of the State Council of the People's Republic of China. Outline of the Yangtze River Delta Regional Integrated Development Plan. http://www.gov.cn/zhengce/2019-12/01/content_5457442.htm, 2022-06-13.]
|
| [26] |
浙江省科学技术厅. 长三角区域协同创新指数2021. http://kjt.zj.gov.cn/art/2022/2/7/art_1229441961_59001035.html, 2022-06-13.
[Zhejiang Provincial Department of Science and Technology. Yangtze River Delta Regional collaborative innovation index 2021. http://kjt.zj.gov.cn/art/2022/2/7/art_1229441961_59001035.html, 2022-06-13]
|
| [27] |
工业和信息化部中小企业局. 关于第三批专精特新“小巨人”企业名单的公示. http://www.ncsti.gov.cn/kjdt/tzgg/202107/t20210720_37004.html, 2022-06-13.
[Small and Medium Enterprise Bureau, Ministry of Industry and Information Technology of the People's Republic of China. Announcement of the third batch of “Little Giants” enterprises. http://www.ncsti.gov.cn/kjdt/tzgg/202107/t20210720_37004.html, 2022-06-13.]
|
| [28] |
宓泽锋, 尚勇敏, 徐维祥, 等. 长三角创新产学合作与企业创新绩效: 尺度与效应. 地理研究, 2022, 41(3): 647-662.
[
|
| [29] |
孙洁, 孙中昶, 郭华东, 等. 中国城市2020年建成区数据集. 中国科学数据: 中英文网络版, 2022, 7(1): 190-204.
[
|
| [30] |
国家发展改革委. 国家发展改革委关于培育发展现代化都市圈的指导意见. https://zfxxgk.ndrc.gov.cn/web/iteminfo.jsp?id=16110, 2022-06-13.
[National Development and Reform Commission of the People's Republic of China. National Development and Reform Commission's Guidance on Fostering the Development of Modernized Urban Areas. https://zfxxgk.ndrc.gov.cn/web/iteminfo.jsp?id=16110, 2022-06-13.]
|
| [31] |
澎湃新闻. 长三角市域/城际铁路大盘点, 85条线路助力都市圈加速融合. https://www.thepaper.cn/newsDetail_forward_13990669, 2022-06-13.
[The Surging News. Yangtze River Delta municipal/intercity railway inventory, 85 lines to help accelerate integration of metropolitan areas. https://www.thepaper.cn/newsDetail_forward_13990669, 2022-06-13.]
|
| [32] |
国家发展改革委, 交通运输部. 长江三角洲地区交通运输更高质量一体化发展规划. http://www.gov.cn/zhengce/zhengceku/2020-04/29/content_5507368.htm, 2022-06-13.
[National Development and Reform Commission, Ministry of Transport of the People's Republic of China. Yangtze River Delta Regional transportation development plan for better quality integration. http://www.gov.cn/zhengce/zhengceku/2020-04/29/content_5507368.htm, 2022-06-13.]
|
| [33] |
李晓萍, 李平, 吕大国, 等. 经济集聚、选择效应与企业生产率. 管理世界, 2015, (4): 25-37, 51.
[
|
| [34] |
周浩, 余壮雄, 杨铮. 可达性、集聚和新建企业选址: 来自中国制造业的微观证据. 经济学: 季刊, 2015, 14(4): 1393-1416.
[
|
| [35] |
|
| [36] |
|
| [37] |
吴松强, 尹航, 蔡婷婷. 嵌入性创新网络、跨界合作与先进制造业企业创新能力: 基于长三角地区先进制造业集群的实证研究. 华东经济管理, 2021, 35(4): 34-41.
[
|
| [38] |
何永达. 人力资本、知识创新与服务业空间集聚: 基于省际面板数据的计量分析. 经济地理, 2015, 35(9): 120-125.
[
|
| [39] |
韩峰, 阳立高. 生产性服务业集聚如何影响制造业结构升级? 一个集聚经济与熊彼特内生增长理论的综合框架. 管理世界, 2020, 36(2): 72-94, 219.
[
|
| [40] |
尹志超, 钱龙, 吴雨. 银企关系、银行业竞争与中小企业借贷成本. 金融研究, 2015, (1): 134-149.
[
|
| [41] |
贾俊雪. 税收激励、企业有效平均税率与企业进入. 经济研究, 2014, 49(7): 94-109.
[
|
| [42] |
刘修岩, 何玉梅. 集聚经济、要素禀赋与产业的空间分布: 来自中国制造业的证据. 产业经济研究, 2011, (3): 10-19.
[
|
| [43] |
国家统计局. 高技术产业(制造业)分类(2017). http://www.stats.gov.cn/tjsj/tjbz/201812/t20181218_1640081.html, 2022-06-13.
[National Bureau of Statistics of the People's Republic of China. High technology industry (Manufacturing) classification (2017). http://www.stats.gov.cn/tjsj/tjbz/201812/t20181218_1640081.html. 2022-06-13.]
|
| [44] |
国务院. 中国制造2025. http://www.gov.cn/zhengce/content/2015-05/19/content_9784.htm, 2022-06-13.
[General office of the State Council of the People's Republic of China. Made in China 2025. http://www.gov.cn/zhengce/content/2015-05/19/content_9784.htm, 2022-06-13.]
|
| [45] |
刘冲, 吴群锋, 刘青. 交通基础设施、市场可达性与企业生产率: 基于竞争和资源配置的视角. 经济研究, 2020, 55(7): 140-158.
[
|
| [46] |
席强敏, 梅林. 工业用地价格、选择效应与工业效率. 经济研究, 2019, 54(2): 102-118.
[
|
| [47] |
冯萍, 刘建江, 罗双成. 房价、劳动力成本与制造业区位布局: 理论与证据. 产业经济研究, 2019, (2): 88-101.
[
|
| [48] |
颜燕, 贺灿飞, 刘涛, 等. 工业用地价格竞争、集聚经济与企业区位选择: 基于中国地级市企业微观数据的经验研究. 城市发展研究, 2014, 21(3): 9-13.
[
|
| [49] |
符婷婷, 张艳, 柴彦威. 大城市郊区居民通勤模式对健康的影响研究: 以北京天通苑为例. 地理科学进展, 2018, 37(4): 547-555.
[
|
| [50] |
吕大国, 耿强, 简泽, 等. 市场规模、劳动力成本与异质性企业区位选择: 中国地区经济差距与生产率差距之谜的一个解释. 经济研究, 2019, 54(2): 36-53.
[
|
| [51] |
张杰, 毕钰, 金岳. 中国高新区“以升促建”政策对企业创新的激励效应. 管理世界, 2021, 37(7): 76-91, 6.
[
|
| [52] |
周宇亮, 赵海珠, 张彩江. 银企关系对中小企业银行贷款的影响: 技术创新的调节作用. 广东财经大学学报, 2017, 32(6): 33-45.
[
|
| [53] |
毛其淋, 许家云. 政府补贴对企业新产品创新的影响: 基于补贴强度“适度区间”的视角. 中国工业经济, 2015, (6): 94-107.
[
|
| [54] |
张可云, 朱春筱. 中国工业结对集聚和空间关联性分析. 地理学报, 2021, 76(4): 1019-1033.
[
|
| [55] |
陈建军, 杨书林. 城市群生产网络与企业效率变革: 以长三角为例. 西南民族大学学报: 人文社科版, 2019, 40(12): 129-136.
[
|
| [56] |
姚常成, 吴康. 集聚外部性、网络外部性与城市创新发展. 地理研究, 2022, 41(9): 2330-2349.
[
|
| [57] |
陈蕊, 刘逸. 全球生产网络(GPN)的理论问题和中国实践启示. 地理研究, 2021, 40(12): 3259-3271.
[
|
| [58] |
王文宇, 贺灿飞. 关系经济地理学与贸易网络研究进展. 地理科学进展, 2022, 41(3): 461-476.
[
|
/
| 〈 |
|
〉 |