
“鸟起巢中,水出源头”:区域产业动态的碳排放效应
|
贺舒琪(1995-),女,山西朔州人,博士研究生,主要研究方向为经济地理与区域可持续发展。 E-mail: heshuqi@stu.pku.edu.cn |
收稿日期: 2023-05-24
录用日期: 2024-01-31
网络出版日期: 2024-03-07
基金资助
国家自然科学基金项目(42171169)
国家自然科学基金项目(41731278)
Tracing the origin: Carbon emission effects of regional industrial dynamics
Received date: 2023-05-24
Accepted date: 2024-01-31
Online published: 2024-03-07
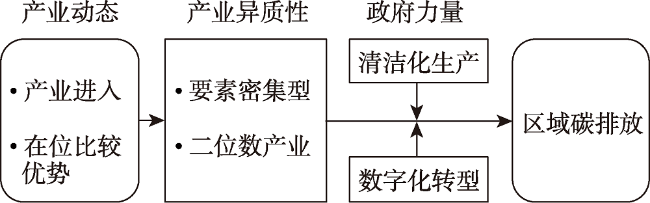
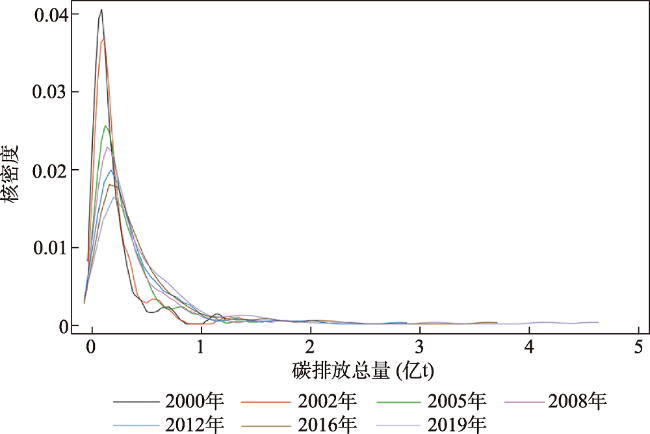
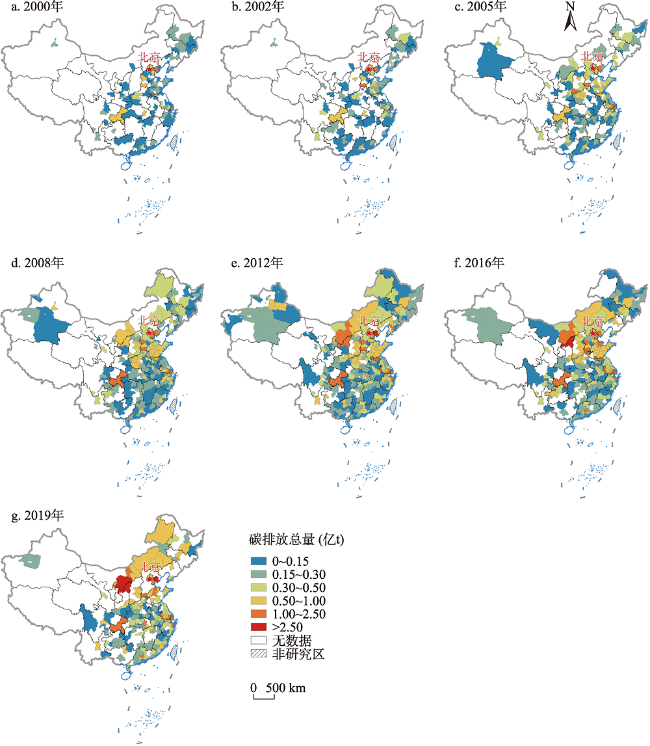
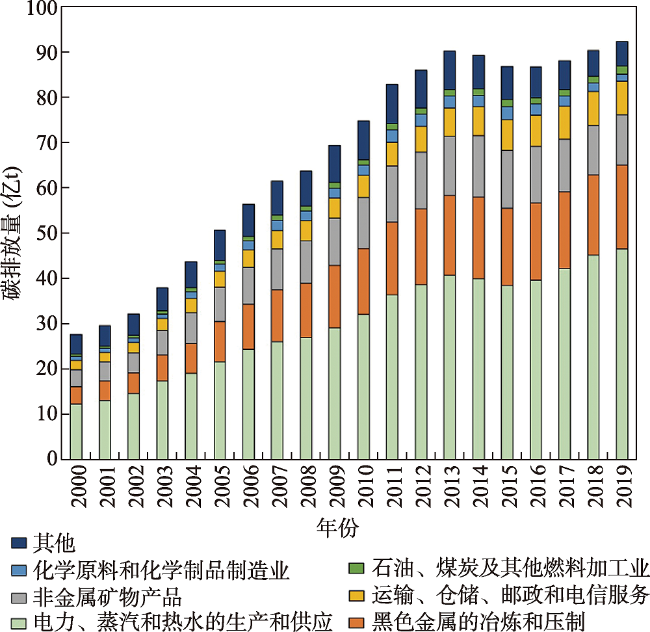
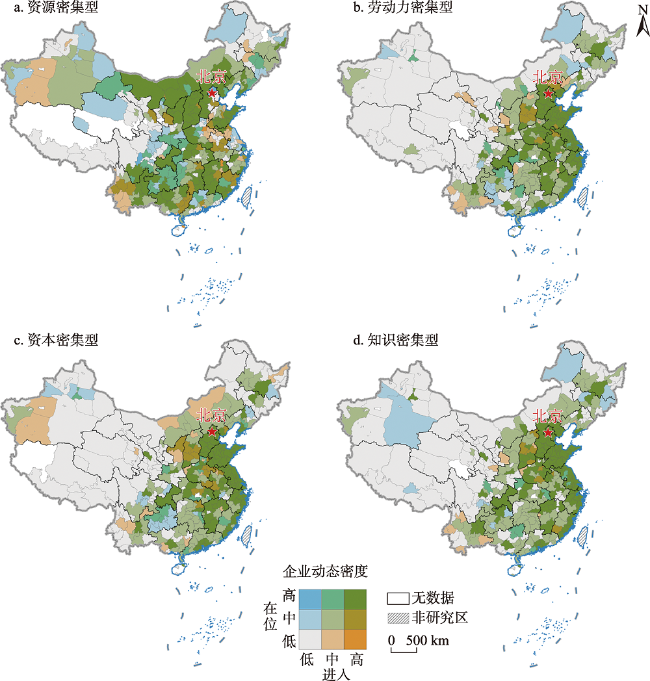
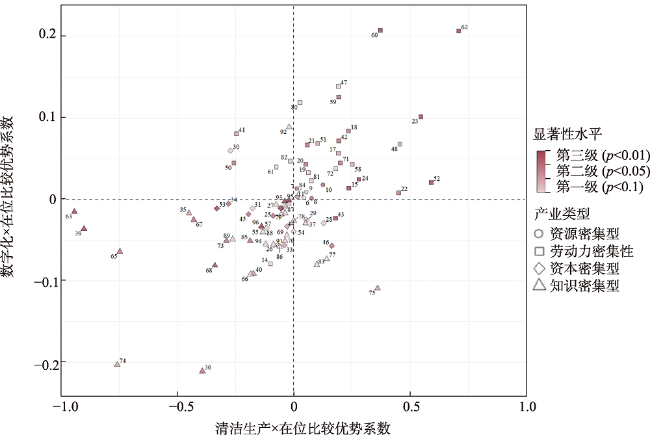
在“双碳”目标下,区域产业结构及动态的碳效应成为重要议题。基于中国工商企业注册数据库和CEADs碳排放数据库,实证分析了中国区域产业动态的碳排放效应。研究发现:①中国的区域碳排放格局具有明显的空间分异性,呈现“北高南低”以及向大中城市簇状聚集的分布格局。②不同要素密集型产业具有异质性碳排放效应。资本密集型及知识密集型产业的进入有利于城市减少碳排放;资源密集型以及劳动力密集型产业具有比较优势的城市会产生更多的碳排放。具体而言,煤炭开采和洗选业、金属制品业等产业进入对区域碳排增长有显著正向影响。③政府推动下的清洁化生产与数字化转型能够削减产业动态的碳排增长效应,其调节效应同样存在产业异质性。相关研究成果对“双碳”目标下中国区域产业转型与高质量发展具有一定的指导意义。
贺舒琪 , 穆恩怡 , 戴晓冕 , 盛涵天 , 贺灿飞 . “鸟起巢中,水出源头”:区域产业动态的碳排放效应[J]. 地理研究, 2024 , 43(3) : 535 -557 . DOI: 10.11821/dlyj020230387
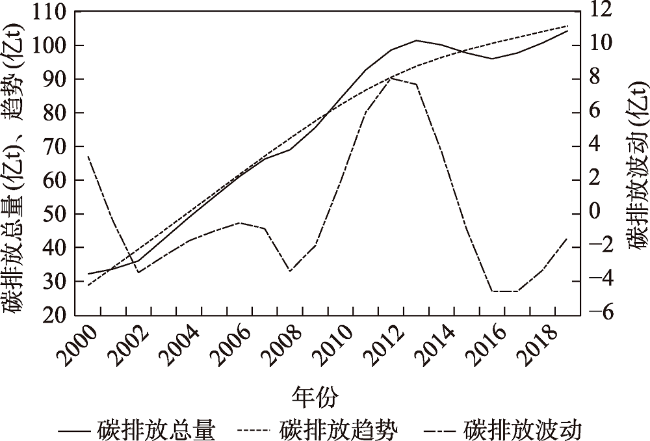
In recent years, global climate change and the problems it poses are becoming increasingly serious. Global warming caused by anthropogenic greenhouse gas emissions, particularly from industrial development, is a major challenge to human well-being, compared to the role of natural factors. The regional industrial structure and the dynamic carbon effect, under the goals of "carbon peaking and carbon neutrality", have become important issues. Based on the China Business Enterprise Registration Database and the CEADs Carbon Emission Database, this paper systematically analyzes the spatio-temporal evolution pattern and industry characteristics of regional carbon emissions in China from 2000 to 2019 based on a dynamic evolutionary perspective. It also empirically analyzes the carbon emission effects of regional industrial dynamics, and further explores the regulatory mechanisms of cleanup and digital carbon reduction pathways. The main findings are as follows. Firstly, China′s carbon emissions have experienced three stages in time: steady growth, rapid growth and structural transformation. Spatially, the regional carbon emissions have obvious spatial differentiation, showing a pattern of high in the north and low in the south, concentrated in large and medium-sized cities, particularly in developed heavy industry areas and several major urbanization and industrialization agglomerations. Industry characteristics are strongly correlated with the number of firm entries and incumbents in high carbon emission industries. Secondly, different factor-intensive industries have heterogeneous carbon emission effects. The entry of capital-intensive and knowledge-intensive industries is beneficial for cities to reduce carbon emissions. Cities with comparative advantages in resource-intensive as well as labor-intensive industries may generate more carbon emissions. Specifically, the entrants of industries, such as coal mining and washing and metal products, have significant positive impacts on the growth of regional carbon emissions. Thirdly, government-driven cleaner production and digital transformation can reduce the carbon emission growth effect of industry dynamics, while the moderating effect is industry-heterogeneous. Specifically, cleaner production promotes the carbon-reducing effect of capital-intensive business entry and weakens the carbon-increasing effect of resource-intensive industry entry. Overall, the research results contribute to an in-depth analysis of the potential carbon emission peaking paths in China′s regions. And the results are of certain significance for the transformation and high-quality development of China′s regional industries under the national target.
表1 企业与政府在碳排市场博弈的收益支付矩阵Tab.1 The payoff matrix of firm-government game in carbon emission market |
| 政府指导减排y | 政府不指导减排1-y | |
|---|---|---|
| 企业排放x | S1-C1-P,S2+P-C2 | S1-C1,S2-T |
| 企业不排放1-x | -C1,-C2 | -C1,-T |
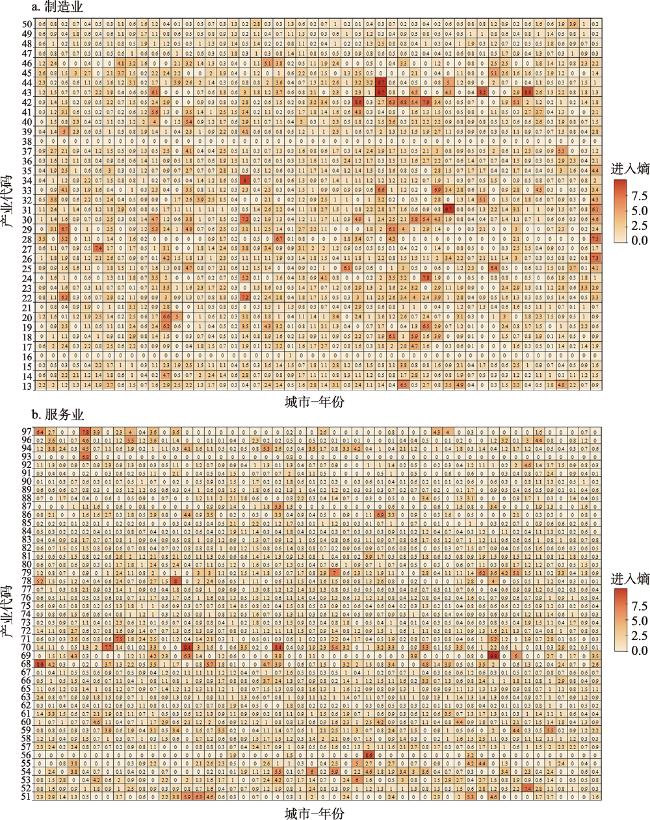
图7 中国制造业、服务业产业碳排放热力进入熵注:所有产业进入数量均参照样本城市高增长年份滞后一期。 Fig.7 The heat map of carbon emissions from manufacturing and service industries |
附表1 国民经济产业及代码Appendix Tab.1 The classification and codes of national economic sectors |
| 产业类别 | 国民经济二位数产业及代码 |
|---|---|
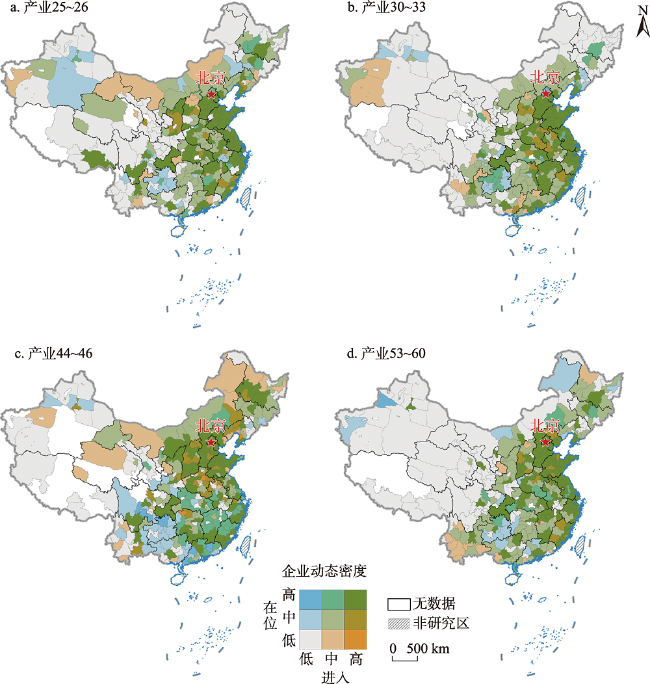
| 制造业 | 煤炭开采和洗选业(06)、石油和天然气开采业(07)、黑色金属矿采选业(08)、有色金属矿采选业(09)、非金属矿采选业(10)、开采专业及辅助性活动(11)、其他采矿业(12)、农副食品加工业(13)、食品制造业(14)、酒、饮料和精制茶制造业(15)、烟草制品业(16)、纺织业(17)、纺织服装、服饰业(18)、皮革、毛皮、羽毛及其制品和制鞋业(19)、木材加工和木、竹、藤、棕、草制品业(20)、家具制造业(21)、造纸和纸制品业(22)、印刷和记录媒介复制业(23)、文教、工美、体育和娱乐用品制造业(24)、石油、煤炭及其他燃料加工业(25)、化学原料和化学制品制造业(26)、医药制造业(27)、化学纤维制造业(28)、橡胶和塑料制品业(29)、非金属矿物制品业(30)、黑色金属冶炼和压延加工业(31)、有色金属冶炼和压延加工业(32)、金属制品业(33)、通用设备制造业(34)、专用设备制造业(35)、汽车制造业(36)、铁路、船舶、航空航天和其他运输设备制造业(37)、电气机械和器材制造业(38)、计算机、通信和其他电子设备制造业(39)、仪器仪表制造业(40)、其他制造业(41)、废弃资源综合利用业(42)、金属制品、机械和设备修理业(43)、电力、热力生产和供应业(44)、燃气生产和供应业(45)、水的生产和供应业(46)、房屋建筑业(47)、土木工程建筑业(48)、建筑安装业(49)、建筑装饰、装修和其他建筑业(50) |
| 服务业 | 批发业(51)、零售业(52)、铁路运输业(53)、道路运输业(54)、水上运输业(55)、航空运输业(56)、管道运输业(57)、多式联运和运输代理业(58)、装卸搬运和仓储业(59)、邮政业(60)、住宿业(61)、餐饮业(62)、电信、广播电视和卫星传输服务(63)、互联网和相关服务(64)、软件和信息技术服务业(65)、货币金融服务(66)、资本市场服务(67)、保险业(68)、其他金融业(69)、房地产业(70)、租赁业(71)、商务服务业(72)、研究和试验发展(73)、专业技术服务业(74)、科技推广和应用服务业(75)、水利管理业(76)、生态保护和环境治理业(77)、公共设施管理业(78)、土地管理业(79)、居民服务业(80)、机动车、电子产品和日用产品修理业(81)、其他服务业(82)、教育(83)、卫生(84)、社会工作(85)、新闻和出版业(86)、广播、电视、电影和录音制作业(87)、文化艺术业(88)、体育(89)、娱乐业(90)、中国共产党机关(91)、国家机构(92)、人民政协、民主党派(93)、社会保障(94)、群众团体、社会团体和其他成员组织(95)、基层群众自治组织(96)、国际组织(97) |
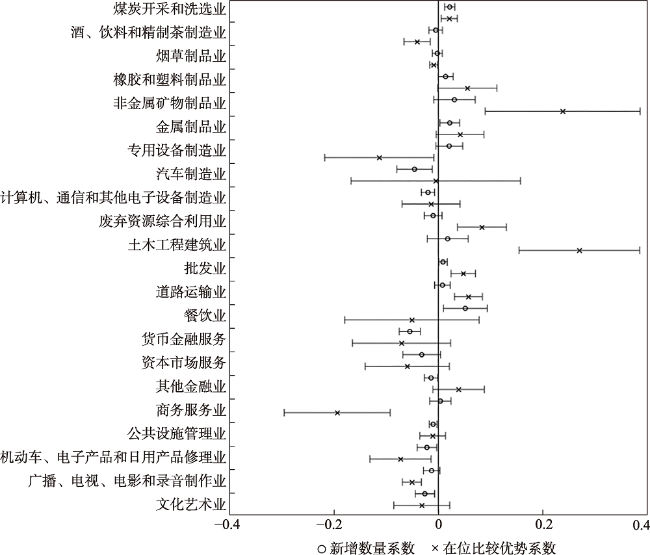
表2 不同要素密集类型产业的碳排放效应Tab.2 Carbon emission effects of different factor-intensive industries |
| 新增企业数量 | 在位企业比较优势系数 | ||||
|---|---|---|---|---|---|
| (1)当期 | (2)滞后一期 | (3)当期 | (4)滞后一期 | ||
| 资源密集型产业 | 2.361 | 0.486 | 0.319*** | 0.292*** | |
| (1.091) | (0.221) | (4.584) | (3.959) | ||
| 劳动力密集型产业 | 0.645 | 0.614 | 0.832** | 0.679** | |
| (1.463) | (1.149) | (2.031) | (2.537) | ||
| 资本密集型产业 | -1.969** | -2.084** | 0.014 | 0.013 | |
| (-2.571) | (-2.283) | (0.853) | (0.787) | ||
| 知识密集型产业 | -8.166*** | -7.816*** | -0.039 | -0.086 | |
| (-6.609) | (-5.522) | (-0.212) | (-0.432) | ||
| 常数项 | -4.174*** | -4.516*** | -4.989*** | -4.662*** | |
| (-3.995) | (-4.241) | (-4.221) | (-3.913) | ||
| 控制变量 | 控制 | 控制 | 控制 | 控制 | |
| 城市固定效应 | 控制 | 控制 | 控制 | 控制 | |
| 年份固定效应 | 控制 | 控制 | 控制 | 控制 | |
| 观测值 | 3862 | 3862 | 3146 | 3146 | |
| R2 | 0.872 | 0.869 | 0.938 | 0.937 | |
注:*** p<0.01, ** p<0.05, *p<0.1;括号中的数值表示稳健t值。 |
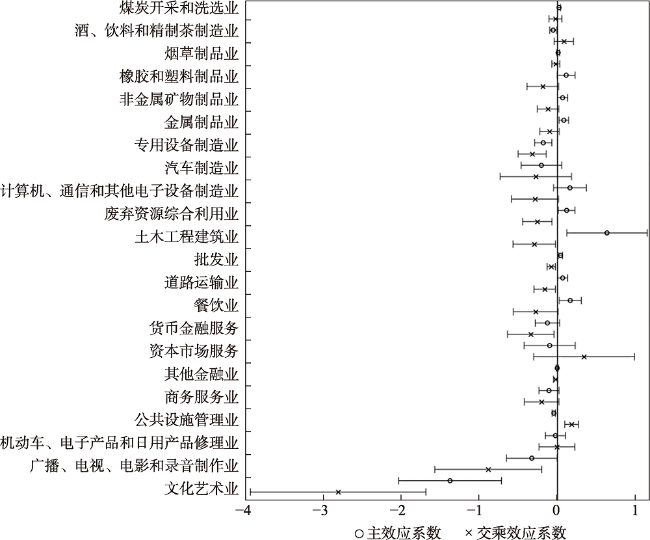
表3 不同要素密集型产业与清洁化生产的互动作用Tab.3 The interaction between different factor-intensive industries and cleaner production |
| 新进入 | 在位比较优势 | |
|---|---|---|
| 资源密集型产业 | 5.812** | 0.082*** |
| (2.041) | (2.679) | |
| 劳动力密集型产业 | 1.459 | 1.228** |
| (0.957) | (2.321) | |
| 资本密集型产业 | -2.795 | 0.255 |
| (-0.924) | (1.152) | |
| 知识密集型产业 | -21.577*** | -1.546 |
| (-3.042) | (-1.145) | |
| 清洁生产 | -0.082 | -11.632** |
| (-0.670) | (-2.233) | |
| 资源密集型产业×清洁生产 | -0.352*** | -0.268*** |
| (-3.547) | (-3.251) | |
| 劳动力密集型产业×清洁生产 | -0.165 | -3.767 |
| (-0.201) | (-0.772) | |
| 资本密集型产业×清洁生产 | -3.568*** | 0.530 |
| (-4.624) | (0.971) | |
| 知识密集型产业×清洁生产 | -3.818 | -6.911** |
| (-1.541) | (-2.062) | |
| 常数项 | -10.031*** | -3.129 |
| (-6.492) | (-1.359) | |
| 控制变量 | 控制 | 控制 |
| 城市固定效应 | 控制 | 控制 |
| 年份固定效应 | 控制 | 控制 |
| 观测值 | 2440 | 2440 |
| R2 | 0.947 | 0.947 |
注:*** p<0.01, ** p<0.05, *p<0.1;括号中的数值表示稳健t值。 |
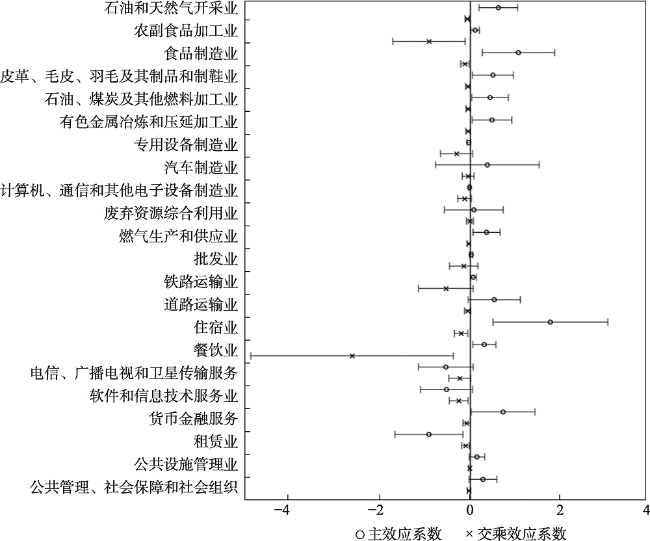
表4 不同要素密集型产业与数字转型的互动作用Tab.4 The interaction between different factor-intensive industries and digitalization |
| 新进入 | 在位比较优势 | |
|---|---|---|
| 资源密集型产业 | 5.660* | 0.387* |
| (1.891) | (1.792) | |
| 劳动力密集型产业 | 2.050* | 4.976 |
| (1.829) | (1.081) | |
| 资本密集型产业 | -4.815** | 2.347 |
| (-2.031) | (1.535) | |
| 知识密集型产业 | -5.661* | 17.678 |
| (-1.941) | (1.491) | |
| 数字化 | -0.001 | -2.898 |
| (-0.039) | (-1.376) | |
| 资源密集型产业×数字化 | -0.026 | -0.039 |
| (-0.394) | (-1.551) | |
| 劳动力密集型产业×数字化 | -0.094 | -0.597 |
| (-0.932) | (-1.109) | |
| 资本密集型产业×数字化 | -0.337 | -0.265 |
| (-1.632) | (-1.501) | |
| 知识密集型产业×数字化 | -0.278 | -2.012 |
| (-0.973) | (-1.462) | |
| 常数项 | -0.686 | -26.592 |
| (-0.592) | (-1.471) | |
| 控制变量 | 控制 | 控制 |
| 城市固定效应 | 控制 | 控制 |
| 年份固定效应 | 控制 | 控制 |
| 观测值 | 2141 | 2141 |
| R2 | 0.959 | 0.959 |
注:***p<0.01, ** p<0.05, *p<0.1;括号中的数值表示稳健t值。 |
真诚感谢二位匿名评审专家在论文评审中所付出的时间和精力,评审专家对本文语言表达、结果分析、结论梳理等方面提出了非常专业且细致的修改意见,使本文获益匪浅。
| [1] |
|
| [2] |
|
| [3] |
|
| [4] |
|
| [5] |
|
| [6] |
|
| [7] |
|
| [8] |
|
| [9] |
|
| [10] |
|
| [11] |
贺灿飞, 周沂. 环境经济地理研究. 北京: 科学出版社, 2016: 37-46.
[
|
| [12] |
|
| [13] |
|
| [14] |
|
| [15] |
郭春丽, 易信. “双碳”目标下的中国经济增长:影响机制、趋势特征及对策建议. 经济学家, 2022, (7): 24-33.
[
|
| [16] |
王睿, 张赫, 强文丽, 等. 基于城镇化的中国县级城市碳排放空间分布特征及影响因素. 地理科学进展, 2021, 40(12): 1999-2010.
[
|
| [17] |
王正, 樊杰. 能源消费碳排放的影响因素特征及研究展望. 地理研究, 2022, 41(10): 2587-99.
[
|
| [18] |
徐英启, 程钰, 王晶晶. 中国资源型城市碳排放效率时空演变与绿色技术创新影响. 地理研究, 2023, 42(3): 878-94.
[
|
| [19] |
刘志华, 徐军委, 张彩虹. 科技创新、产业结构升级与碳排放效率: 基于省际面板数据的PVAR分析. 自然资源学报, 2022, 37(2): 508-20.
[
|
| [20] |
|
| [21] |
王俊松, 贺灿飞. 能源消费、经济增长与中国CO2排放量变化: 基于LMDI方法的分解分析. 长江流域资源与环境, 2010, 19(1): 18-23.
[
|
| [22] |
|
| [23] |
中国社会科学院工业经济研究所课题组. “十四五”时期中国工业发展战略研究. 中国工业经济, 2020, (2): 5-27.
[Research Group of the Institute of Industrial Economics of Chinese Academy of Social Science. Research on China's industry development strategy during the period covered by the 14th Five-Year Plan. China Industrial Economics, 2020, (2): 5-27.]. DOI: 10.19581/j.cnki.ciejournal.2020.02.001.
|
| [24] |
胡鞍钢. 中国实现2030年前碳达峰目标及主要途径. 北京工业大学学报(社会科学版), 2021, 21(3): 1-15.
[
|
| [25] |
|
| [26] |
方冬莉. 数字经济对中国城市能源利用效率的影响: 基于技术赋能和技术外溢视角. 资源科学, 2023, 45(2): 296-307.
[
|
| [27] |
葛立宇, 莫龙炯, 黄念兵. 数字经济发展、产业结构升级与城市碳排放. 现代财经(天津财经大学学报), 2022, 42(10): 20-37.
[
|
| [28] |
|
| [29] |
|
| [30] |
|
| [31] |
|
| [32] |
|
| [33] |
|
| [34] |
|
| [35] |
|
| [36] |
国家统计局. 中国工业企业数据库. 北京: 国家统计局, 2000-2019.
[National Bureau of Statistics of China. Chinese Industrial Enterprise Database. Beijing: National Bureau of Statistics of China, 2000-2019.]
|
| [37] |
童健, 刘伟, 薛景. 环境规制、要素投入结构与工业行业转型升级. 经济研究, 2016, 51(7): 43-57.
[
|
| [38] |
国家统计局城市社会经济调查司. 中国城市统计年鉴. 北京: 中国统计出版社, 2000-2019.
[Department of Urban Socio-Economic Survey, National Bureau of Statistics. China City Statistical Yearbook. Beijing: China Statistics Press, 2000-2019.]
|
| [39] |
韩梦瑶, 姚秋蕙, 劳浚铭, 等. 中国省域碳排放的国内外转移研究: 基于嵌套网络视角. 中国科学: 地球科学, 2020, 50(6): 748-64.
[
|
| [40] |
王薇. 城市化、产业结构与碳排放的动态关系研究: 基于VAR模型的实证分析. 生态经济, 2014, 30(11): 28-35.
[
|
| [41] |
张腾飞, 杨俊, 盛鹏飞. 城镇化对中国碳排放的影响及作用渠道. 中国人口·资源与环境, 2016, 26(2): 47-57.
[
|
| [42] |
余泳泽, 孙鹏博, 宣烨. 地方政府环境目标约束是否影响了产业转型升级? 经济研究, 2020, 55(8): 57-72.
[
|
| [43] |
徐维祥, 周建平, 刘程军. 数字经济发展对城市碳排放影响的空间效应. 地理研究, 2022, 41(1): 111-29.
[
|
| [44] |
谢云飞. 数字经济对区域碳排放强度的影响效应及作用机制. 当代经济管理, 2022, 44(2): 68-78.
[
|
/
| 〈 |
|
〉 |