
中国城市群数字普惠金融演化特征及其对高质量发展的效应分析
|
张国俊(1977-),女,湖北公安人,博士,副教授,硕士生导师,主要研究方向为经济地理、区域发展与城乡规划。E-mail: guojunz@gdufe.edu.cn |
收稿日期: 2023-06-06
录用日期: 2023-11-06
网络出版日期: 2024-03-07
基金资助
国家自然科学基金项目(42171188)
广东省自然科学基金项目(2022A1515010992)
The evolution characteristics of digital financial inclusion in Chinese urban agglomerations and its effects on high-quality development
Received date: 2023-06-06
Accepted date: 2023-11-06
Online published: 2024-03-07
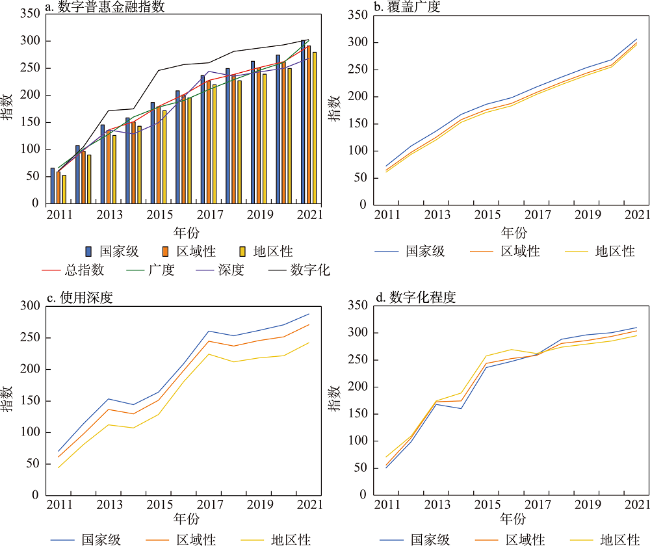
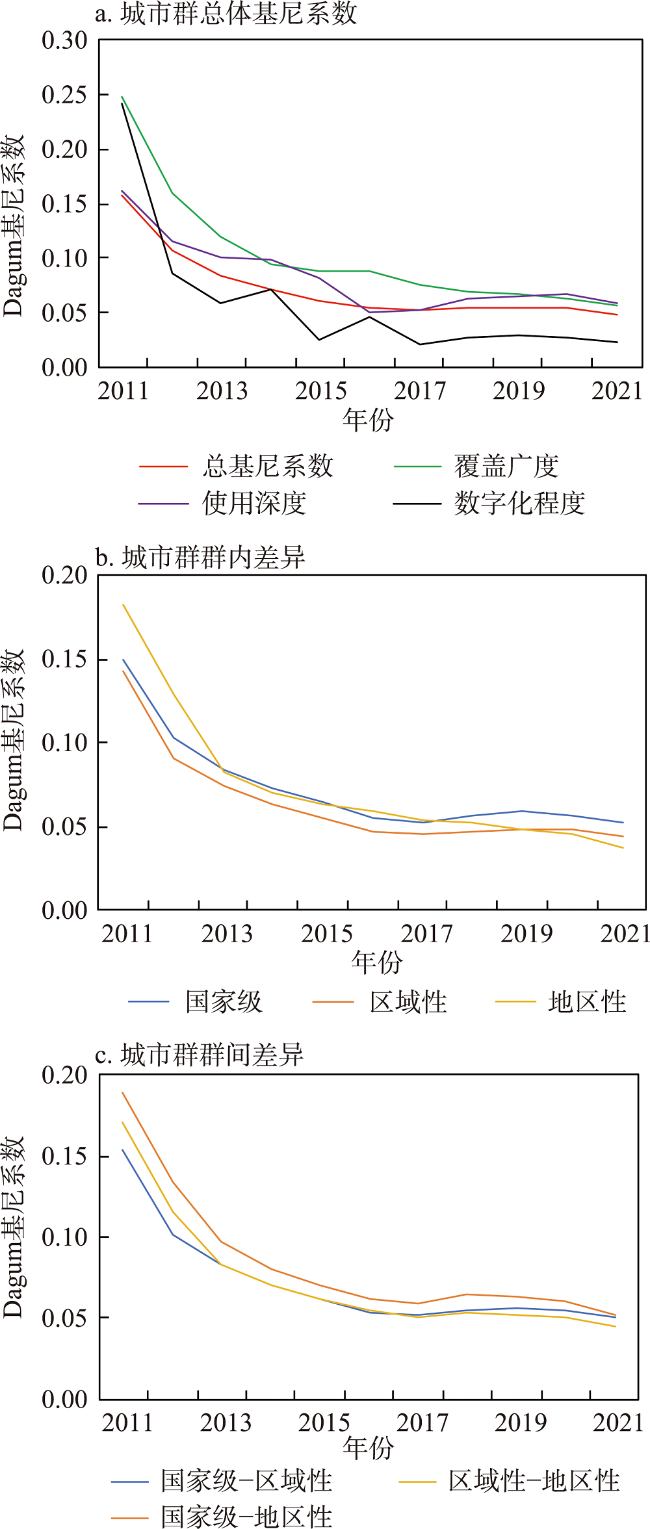
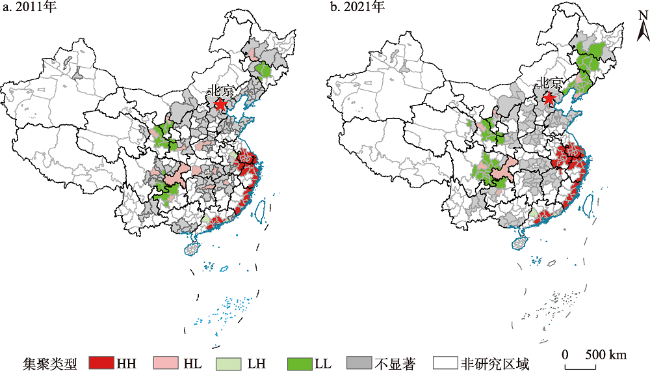
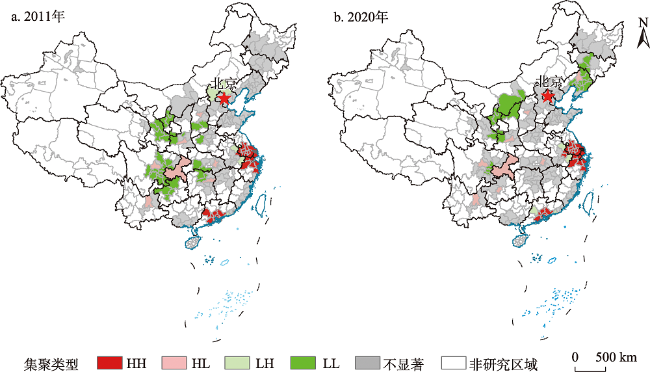
本文在探讨数字普惠金融与高质量发展的理论关系基础上,利用Dagum基尼系数、空间自相关、空间杜宾模型对2011—2021年中国20个城市群数字普惠金融发展时空演化特征及其对高质量发展的效应进行了分析,研究发现:① 从总体发展水平看,中国城市群数字普惠金融发展水平呈上升趋势,且发展差异逐渐缩小;从城市群空间组织格局看,数字普惠金融发展水平呈现“国家级>区域性>地区性”城市群逐级递减态势;从群内差异看,国家级城市群群内差异最大,地区性城市群差异最小。② 中国城市群数字普惠金融具有空间集聚特征,集聚类型以HH、LL型为主,且空间分布与高质量发展格局具有相似性。③ 实证研究表明,数字普惠金融在城市群空间尺度下对高质量发展的正向效应显著,且直接效应大于间接效应;空间效应具有明显异质性,国家级城市群的效应高于其他城市群。因此,对数字普惠金融助力城市群高质量发展需因“群”施策,应针对不同层级城市群数字普惠金融发展提出相应策略以助力城市群引领中国经济高质量发展。
张国俊 , 梁真源 , 吴宗书 . 中国城市群数字普惠金融演化特征及其对高质量发展的效应分析[J]. 地理研究, 2024 , 43(3) : 621 -639 . DOI: 10.11821/dlyj020230426
On the basis of exploring the theoretical relationship between digital financial inclusion and high-quality development, this paper uses the Dagum Gini coefficient, spatial autocorrelation, and spatial Durbin model to analyze the evolution characteristics of digital financial inclusion in 20 urban agglomerations of China from 2011 to 2021 and its impact on high-quality development. The effect of development was analyzed, and the research found that: (1) In terms of overall level, the development of digital financial inclusion in Chinese urban agglomerations shows an upward trend, and their disparities are gradually narrowing. From the perspective of the spatial organization pattern of urban agglomerations, the digital financial inclusion presents a decreasing trend from national-evel, regional-level, to local-level. In terms of intra-cluster differences, the national-level city clusters have the largest differences, while the local city clusters have the smallest. (2) The digital financial inclusion of urban agglomerations in China has the characteristics of spatial agglomeration, and the agglomeration types are mainly HH and LL types. This pattern of concentration is remarkably aligned with the spatial attributes associated with high-quality development. (3) The empirical findings reveal that in urban agglomerations, digital financial inclusion exerts a substantial positive influence on high-quality development, with its direct impact surpassing the indirect consequences. This direct impact reflects the immediate benefits of digital finance in enhancing economic activities and fostering growth. Moreover, there is a notable heterogeneity in the spatial effects of this phenomenon. Specifically, the influence on national-level urban agglomerations is more pronounced compared to other urban clusters. This disparity suggests that national-level urban areas, with their advanced infrastructure and greater economic dynamism, are better positioned to leverage the advantages of digital financial inclusion. This leads to a more significant and measurable enhancement in their development quality compared to other less developed urban agglomerations. Therefore, for digital financial inclusion to effectively contribute to the high-quality development of urban agglomerations, strategies need to be tailored to specific clusters. It is essential to develop targeted strategies for urban agglomerations at different levels to aid in leading China's economy towards high-quality development. This approach acknowledges the unique characteristics and needs of each urban agglomeration, ensuring that the development of digital financial inclusion is aligned with regional development goals, thereby fostering a more balanced and sustainable economic growth across the nation.
表1 城市群空间组织格局分类Tab. 1 The classification of spatial organization pattern in urban agglomerations |
| 城市群数量(个) | 城市群名称 | |
|---|---|---|
| 国家级城市群 | 5 | 京津冀城市群、珠三角城市群、长三角城市群、长江中游城市群、成渝城市群 |
| 区域性城市群 | 9 | 山东半岛城市群、海峡西岸城市群、辽中南城市群、关中平原城市群、中原城市群、江淮城市群、哈长城市群、广西北部湾城市群、天山北坡城市群 |
| 地区性城市群 | 6 | 滇中城市群、兰西城市群、呼包鄂榆城市群、黔中城市群、宁夏沿黄城市群、晋 中城市群 |
表2 城市群高质量发展评价指标体系Tab. 2 Evaluation index system for high-quality development of urban agglomerations |
| 一级指标 | 二级指标 | 指标说明 |
|---|---|---|
| 创新 | 城市群科技支出强度 | 科技支出占财政支出比例(正向) |
| 城市群高素质人口占比 | 高等教育在校学生数占总人口比例(正向) | |
| 城市群科技从业人员占比 | 科技从业人员占从业人员总数比例(正向) | |
| 城市群技术发展活跃度 | 每万人专利申请数(正向) | |
| 城市群技术创新成效度 | 每万人专利授权数(正向) | |
| 协调 | 城市群城乡收入比 | 城镇居民人均可支配收入与农村居民人均纯收入的比值(负向) |
| 城市群产业结构合理化指数 | 产业产出结构与就业结构贴近度(正向) | |
| 城市群产业结构高级化指数 | 第三产业与第二产业产值之比(正向) | |
| 绿色 | 城市群工业废气污染 | 单位工业产值二氧化硫排放量(负向) |
| 城市群工业废水污染 | 单位工业产值废水排放量(负向) | |
| 城市群工业烟粉尘污染 | 单位工业产值烟粉尘排放量(负向) | |
| 城市群废水利用率 | 污水处理厂集中处理率(正向) | |
| 城市群单位GDP二氧化碳排放 | 单位GDP产值二氧化碳排放量(负向) | |
| 城市群单位GDP天然气能耗 | 单位GDP产值天然气消耗量(负向) | |
| 城市群单位GDP石油气能耗 | 单位GDP产值液化石油气消耗量(负向) | |
| 开放 | 城市群对外依存度 | 进出口总额占GDP比例(正向) |
| 城市群外资投资强度 | 实际利用外资占GDP比例(正向) | |
| 城市群交通通达度 | 各种交通方式运输流强度之和(正向) | |
| 城市群社会消费品零售总额占比 | 社会消费品零售总额占GDP比例(正向) | |
| 共享 | 城市群基尼系数 | 收入分配公平程度(负向) |
| 城市群互联网用户数量 | 互联网宽带接入用户数量(正向) | |
| 城市群教育资源比例 | 教师人均负担学生数(负向) | |
| 城市群医疗资源比例 | 每万人享有医生数(正向) |
表3 变量说明Tab. 3 Variable explanation |
| 变量名(符号) | 变量说明(单位) | |
|---|---|---|
| 被解释变量 | 高质量发展水平(Hqd) | 基于创新、协调、绿色、开放、共享五个维度指标测度 |
| 核心解释变量 | 数字普惠金融发展水平(Index) | 基于覆盖广度、使用深度和数字化程度测度 |
| 数字普惠金融覆盖广度(Dpfcov) | 基于账户覆盖率测度 | |
| 数字普惠金融使用深度(Dpfuse) | 基于数字金融业务类型测度 | |
| 数字普惠金融数字化程度(Dpfdig) | 基于数字金融服务便利度、利率优惠度和信用化程度测度 | |
| 控制变量 | 经济发展水平(Pgdp) | 人均GDP(元) |
| 财政分权度(Finadp) | 地方财政预算收入与地方财政支出比值(%) | |
| 人力资本水平(Edu) | 高等在校学生数占总人口数(%) | |
| 城市化水平(Urban) | 城镇人口占总人口比值(%) |
表4 基准回归结果Tab. 4 Regression results |
| 变量 | 模型1 | 模型2 | 模型3 | 模型4 |
|---|---|---|---|---|
| Index | 0.0438***(0.0031) | 0.2282***(0.0093) | 0.0973***(0.0113) | 0.0236**(0.0113) |
| PGDP | 0.0368***(0.0036) | 0.0207***(0.0036) | ||
| Finadp | 0.0573***(0.0068) | 0.0410***(0.0063) | ||
| Edu | 0.4396***(0.0301) | |||
| Urban | 0.1035***(0.0121) | |||
| _cons | -0.1270***(0.0157) | -0.8281***(0.0379) | -0.7254***(0.0415) | -0.3138***(0.0471) |
| 时间固定 | No | Yes | Yes | Yes |
| 地区固定 | No | Yes | Yes | Yes |
| N | 1790 | 1790 | 1790 | 1790 |
| R2 | 0.1015 | 0.5710 | 0.6397 | 0.6967 |
注:***、**分别表示在0.01、0.05的水平上显著;括号内数字为标准误差。 |
表5 稳健性检验Tab. 5 Robustness test |
| 变量 | 覆盖广度 | 使用深度 | 数字化程度 | 剔除极端值 | |||||||
|---|---|---|---|---|---|---|---|---|---|---|---|
| FE | RE | FE | RE | FE | RE | FE | RE | ||||
| Dpf | 0.0054*** | 0.0027* | 0.0076*** | 0.0048*** | 0.0046*** | 0.0024** | 0.0060*** | 0.0045*** | |||
| (0.0017) | (0.0016) | (0.0017) | (0.0016) | (0.0013) | (0.0012) | (0.0017) | (0.0016) | ||||
| PGDP | 0.0187*** | 0.0249*** | 0.0168*** | 0.0231*** | 0.0189*** | 0.0249*** | 0.0171*** | 0.0210*** | |||
| (0.0038) | (0.0036) | (0.0037) | (0.0035) | (0.0037) | (0.0034) | (0.0035) | (0.0033) | ||||
| Finadp | -0.0139*** | -0.0064 | -0.0122*** | -0.0043 | -0.0133*** | -0.0060 | -0.0066 | 0.0043 | |||
| (0.0040) | (0.0039) | (0.0040) | (0.0039) | (0.0040) | (0.0039) | (0.0055) | (0.0053) | ||||
| Edu | 0.4159*** | 0.4210*** | 0.4139*** | 0.4202*** | 0.4162*** | 0.4213*** | 0.8998*** | 0.8819*** | |||
| (0.0230) | (0.0231) | (0.0230) | (0.0231) | (0.0230) | (0.0230) | (0.0749) | (0.0671) | ||||
| Urban | 0.0686*** | 0.0934*** | 0.0632*** | 0.0904*** | 0.0713*** | 0.0946*** | 0.0601*** | 0.0789*** | |||
| (0.0128) | (0.0116) | (0.0128) | (0.0116) | (0.0124) | (0.0114) | (0.0116) | (0.0106) | ||||
| _cons | -0.1767*** | -0.2489*** | -0.1657*** | -0.2399*** | -0.1771*** | -0.2487*** | -0.1731*** | -0.2236*** | |||
| (0.0359) | (0.0329) | (0.0347) | (0.0320) | (0.0349) | (0.0321) | (0.0322) | (0.0298) | ||||
| N | 1753 | 1753 | 1753 | 1753 | 1753 | 1753 | 1753 | 1753 | |||
| R2 | 0.3085 | 0.3124 | 0.3097 | 0.2708 | |||||||
注:***、**、*分别表示在0.01、0.05和0.1的水平上显著;括号内数字为标准误差。 |
表6 工具变量回归结果Tab. 6 Regression results of instrumental variables |
| 变量 | 第一阶段Index | 第二阶段Hqd |
|---|---|---|
| Index | 0.0209***(0.007) | |
| pGDP | 0.0370***(0.0052) | 0.0199**(0.009) |
| Finadp | -0.0236**(0.0099) | 0.0625**(0.026) |
| Edu | 0.1357**(0.0692) | 0.4194***(0.090) |
| Urban | 0.8846***(0.003) | 0.0990***(0.017) |
| 工具变量L.Index | 0.6501*** | |
| Constant | 1.5087***(0.0502) | -0.3290***(0.058) |
| N | 1611 | 1611 |
| R2 | 0.9731 | 0.4970 |
注:***、**分别表示在0.01、0.05的水平上显著;括号内数字为标准误差。 |
表7 空间杜宾模型回归结果及检验Tab. 7 Regression results and testing of spatial Durbin model |
| 变量 | 空间固定 效应模型 | 效应分解 | ||
|---|---|---|---|---|
| 直接效应 | 间接效应 | 总效应 | ||
| Index | 0.0760***0.0126) | 0.0797***(0.0131) | 0.0472***(0.0119) | 0.1270***(0.0191) |
| pGDP | 0.0028(0.0039) | 0.0027(0.0038) | 0.00134(0.0058) | 0.0040(0.0070) |
| Finadp | 0.0522***(0.0071) | 0.0553***(0.0069) | 0.0341***(0.0123) | 0.0894***(0.0149) |
| Edu | 0.3840***(0.0345) | 0.3760***(0.0346) | -0.0937(0.0741) | 0.2820***(0.0911) |
| Urban | 0.1230***(0.0119) | 0.1170***(0.0108) | -0.0796***(0.0176) | 0.0374*(0.0204) |
| W×Index | 0.0200***(0.001) | |||
| W×pGDP | 0.0366***(0.000) | |||
| W×Finadp | 0.0267***(0.000) | |||
| W×Edu | -0.0513(0.143) | |||
| W×Urban | 0.0045(0.814) | |||
| sigma2_e | 0.0005*** | |||
| N | 1790 | 1790 | 1790 | 1790 |
| R2 | 0.0450 | 0.0450 | 0.0450 | 0.2360 |
| LM_Spatial lag | 436.0790*** | |||
| Robust LM_Spatial lag | 22.5890*** | |||
| LM_Spatial error | 531.1080*** | |||
| Robust LM_Spatial error | 117.7180*** | |||
| LR_Spatial lag | 67.0600*** | |||
| LR_spatial error | 47.8300*** | |||
| Hausman test | 32.9500*** | |||
注:***、*分别表示在0.01和0.1的水平上显著;括号内数字为标准误差。 |
表8 不同层级城市群空间杜宾模型的效应分解Tab. 8 Effect decomposition of spatial Durbin model in urban agglomerations at different levels |
| 变量 | 国家级城市群 | 区域性城市群 | 地区性城市群 | |||||
|---|---|---|---|---|---|---|---|---|
| 直接效应 | 间接效应 | 直接效应 | 间接效应 | 直接效应 | 间接效应 | |||
| Index | 0.129*** | 0.0183 | 0.0576*** | 0.0015 | 0.0053 | 0.0296 | ||
| (0.0258) | (0.0187) | (0.0134) | (0.0101) | (0.0163) | (0.0230) | |||
| pGDP | -0.0019 | 0.0159* | 0.0014 | 0.0112** | -0.0228*** | 0.0138 | ||
| (0.0072) | (0.0090) | (0.00376) | (0.0051) | (0.0059) | (0.0084) | |||
| Finadp | 0.0150* | 0.0050 | 0.0350*** | 0.0031 | 0.1070*** | 0.0012 | ||
| (0.0089) | (0.0157) | (0.0113) | (0.0132) | (0.0156) | (0.0191) | |||
| Edu | 0.4480*** | -0.6180*** | 0.6490*** | -0.1140 | 0.3460*** | 0.0248 | ||
| (0.0842) | (0.1850) | (0.0537) | (0.1000) | (0.0277) | (0.0417) | |||
| Urban | 0.2970*** | -0.0669*** | 0.0339*** | -0.0347* | 0.0651*** | -0.1650*** | ||
| (0.0201) | (0.0257) | (0.0119) | (0.0179) | (0.0127) | (0.0218) | |||
| Rho | 0.0861** | 0.1020** | 0.1190* | |||||
| (0.0410) | (0.0467) | (0.0646) | ||||||
| N | 760 | 770 | 260 | |||||
| R2 | 0.3530 | 0.3590 | 0.6480 | |||||
| LM_Spatial lag | 137.1490*** | 104.0220*** | 28.7050*** | |||||
| Robust LM_Spatial lag | 10.9990*** | 1.461 | 1.966 | |||||
| LM_Spatial error | 195.1550*** | 219.7250*** | 30.6640*** | |||||
| Robust LM_Spatial error | 69.0040*** | 117.1650*** | 3.9260** | |||||
| LR_Spatial lag | 42.7900*** | 67.6700*** | 72.6900*** | |||||
| LR_spatial error | 26.2100*** | 67.6300*** | 58.8300*** | |||||
| Hausman test | 35.0400*** | 13.8000 | 20.9800** | |||||
注:***、**、*分别表示在0.01、0.05和0.1的水平上显著;括号内数字为标准误差。 |
真诚感谢匿名评审专家在论文评审中所付出的时间和精力,评审专家对本文中国城市群高质量发展综合指标选取、结果分析等方面的修改意见,使本文受益匪浅。
| [1] |
廖理. 金融科技任重道远. 清华金融评论, 2016, (10): 1-2.
[
|
| [2] |
万佳彧, 周勤, 肖义. 数字金融、融资约束与企业创新. 经济评论, 2020, (1): 71-83.
[
|
| [3] |
张国俊, 周春山, 许学强. 中国金融排斥的省际差异及影响因素. 地理研究, 2014, 33(12): 2299-2311.
[
|
| [4] |
何德旭, 苗文龙. 金融排斥、金融包容与中国普惠金融制度的构建. 财贸经济, 2015, (3): 5-16.
[
|
| [5] |
尹志超, 彭嫦燕, 里昂安吉拉. 中国家庭普惠金融的发展及影响. 管理世界, 2019, 35(2): 74-87.
[
|
| [6] |
傅秋子, 黄益平. 数字金融对农村金融需求的异质性影响: 来自中国家庭金融调查与北京大学数字普惠金融指数的证据. 金融研究, 2018, (11): 68-84.
[
|
| [7] |
郭峰, 王靖一, 王芳, 等. 测度中国数字普惠金融发展:指数编制与空间特征. 经济学(季刊), 2020, 19(4): 1401-1418.
[
|
| [8] |
宋晓玲. 数字普惠金融缩小城乡收入差距的实证检验. 财经科学, 2017, (6): 14-25.
[
|
| [9] |
|
| [10] |
张正平, 陈杨. 人口老龄化影响我国数字普惠金融的发展吗? 基于2011—2018年省级面板数据的实证检验. 财经论丛, 2021, (11): 47-57.
[
|
| [11] |
|
| [12] |
马连福, 杜善重. 数字金融能提升企业风险承担水平吗? 经济学家, 2021, (5): 65-74.
[
|
| [13] |
刘成杰, 冯婷, 李勇. 网络基础设施建设、数字普惠金融与数字鸿沟: 基于“宽带中国”示范城市创建的政策效应分析. 财经科学, 2022, (12): 103-116.
[
|
| [14] |
陈慧卿, 陈国生, 魏晓博, 等. 数字普惠金融的增收减贫效应: 基于省际面板数据的实证分析. 经济地理, 2021, 41(3): 184-191.
[
|
| [15] |
徐子尧, 张莉沙, 刘益志. 数字普惠金融提升了区域创新能力吗? 财经科学, 2020, (11): 17-28.
[
|
| [16] |
郭守亭, 金志博. 数字普惠金融对区域产业结构升级的空间溢出效应研究. 经济经纬, 2022, 39(6): 77-87.
[
|
| [17] |
齐红倩, 刘倩含. 数字普惠金融发展对我国居民消费不平等的影响. 经济问题探索, 2022, (10): 161-172.
[
|
| [18] |
马国旺, 王天娇. 数字普惠金融对就业的影响及空间效应研究. 中南大学学报(社会科学版), 2022, 28(3): 139-152.
[
|
| [19] |
黎翠梅, 周莹. 数字普惠金融对农村消费的影响研究: 基于空间计量模型. 经济地理, 2021, 41(12): 177-186.
[
|
| [20] |
梁榜, 张建华. 中国城市数字普惠金融发展的空间集聚及收敛性研究. 财经论丛, 2020, (1): 54-64.
[
|
| [21] |
谭燕芝, 李云仲, 叶程芳. 省域数字普惠金融与乡村振兴评价及其耦合协同分析. 经济地理, 2021, 41(12): 188-222.
[
|
| [22] |
王耕南, 张国俊, 周春山. 珠三角数字普惠金融的时空演化特征及影响因子. 地域研究与开发, 2022, 41(5): 25-31.
[
|
| [23] |
张德钢, 朱旭森. 中国九大城市群数字普惠金融发展的时空差异及动态演进. 当代经济, 2020, 42(12): 88-96.
[
|
| [24] |
杨刚, 张亨溢. 数字普惠金融、区域创新与经济增长. 统计与决策, 2022, 38(2): 155-158.
[
|
| [25] |
姜松, 周鑫悦. 数字普惠金融对经济高质量发展的影响研究. 金融论坛, 2021, 26(8): 39-49.
[
|
| [26] |
王刚贞, 陈梦洁. 数字普惠金融影响经济高质量发展的渠道机理与异质特征. 财贸研究, 2022, 33(10): 45-56.
[
|
| [27] |
宋诚, 李季刚. 金融发展影响经济高质量发展的空间效应分析: 基于中国五大城市群的面板数据. 城市学刊, 2022, 43(6): 10-16.
[
|
| [28] |
潘爽, 叶德珠, 叶显. 数字金融普惠了吗? 来自城市创新的经验证据. 经济学家, 2021, (3): 101-111.
[
|
| [29] |
周申蓓, 张媛媛, 张应允. 数字金融发展对区域创新的影响路径: 基于“双循环”视域. 科技管理研究, 2022, 42(24): 31-37.
[
|
| [30] |
钱海章, 陶云清, 曹松威. 中国数字金融发展与经济增长的理论与实证. 数量经济技术经济研究, 2020, 23(6): 26-46.
[
|
| [31] |
罗炜琳, 刘松涛, 胥烨, 等. 普惠金融发展水平影响绿色经济效率吗? 环境经济研究, 2018, 3(3): 32-55.
[
|
| [32] |
刘章生, 赖彬彬, 刘桂海, 等. 地区竞争、推广数字普惠金融与绿色经济效率. 管理评论, 2023, 35(1): 40-51.
[
|
| [33] |
周云波, 黄祺雨. 数字普惠金融与居民社会信任: 基于经济公平和机会公平的双视角. 现代经济探讨, 2023, (1): 15-28.
[
|
| [34] |
丁任重, 许渤胤, 张航. 城市群能带动区域经济增长吗: 基于7个国家级城市群的实证分析. 经济地理, 2021, 41(5): 37-45.
[
|
| [35] |
刘传明, 王卉彤, 魏晓敏. 中国八大城市群互联网金融发展的区域差异分解及收敛性研究. 数量经济技术经济研究, 2017, 34(8): 3-20.
[
|
| [36] |
陈明华, 刘华军, 孙亚男. 中国五大城市群金融发展的空间差异及分布动态: 2003—2013年. 数量经济技术经济研究, 2016, (7): 130-144.
[
|
| [37] |
齐昕, 郭薛南. 中国十大城市群金融的辐射力及其一体化发展研究. 武汉金融, 2019, (10): 74-79.
[
|
| [38] |
赵建吉, 王艳华, 吕可文, 等. 内陆区域中心城市金融产业集聚的演化机理: 以郑东新区为例. 地理学报, 2017, 72(8): 1392-1407.
[
|
| [39] |
林彰平, 闫小培. 广州市金融机构微观集聚案例. 经济地理, 2007, 119(1): 84-88.
[
|
| [40] |
郭进, 徐盈之, 王美昌. 金融外部性、技术外部性与中国城市群建设. 经济学动态, 2016, (6): 74-84.
[
|
| [41] |
赵曦, 王金哲. 金融资源空间整合的城市群协调发展效应研究: 基于2005—2015年全国12个城市群面板数据的研究. 经济问题探索, 2019, (1): 66-74.
[
|
| [42] |
唐文进, 李爽, 陶云清. 数字普惠金融发展与产业结构升级: 来自283个城市的经验证据. 广东财经大学学报, 2019, 34(6): 35-49.
[
|
| [43] |
刘新智, 张鹏飞, 史晓宇. 产业集聚、技术创新与经济高质量发展: 基于我国五大城市群的实证研究. 改革, 2022, (4): 58-87.
[
|
| [44] |
张国俊, 王运喆, 陈宇. 中国城市群高质量发展的时空特征及分异机理. 地理研究, 2022, 41(8): 2109-2124.
[
|
| [45] |
方创琳, 王振波, 马海涛. 中国城市群形成发育规律的理论认知与地理学贡献. 地理学报, 2018, 73(4): 651-664.
[
|
| [46] |
马海涛, 徐楦钫. 黄河流域城市群高质量发展评估与空间格局分异. 经济地理, 2020, 40(4): 11-18.
[
|
| [47] |
北京大学数字金融研究中心课题组. 北京大学数字普惠金融指数(2011—2021). 北京: 北京大学数字金融研究中心, 2011- 2021.
[Research Group of Institute of Digital Finance, Peking University. Peking University Digital Inclusive Finance(2011-2021). Beijing: Institute of Digital Finance, Peking University, 2011- 2021.]
|
| [48] |
牛丽娟. 数字金融与经济高质量发展:理论分析与实证检验. 西南民族大学学报(人文社会科学版), 2023, (1): 125-138.
[
|
| [49] |
马黄龙, 屈小娥. 数字普惠金融对经济高质量发展的影响: 基于农村人力资本和数字鸿沟视角的分析. 经济问题探索, 2021, (10): 173-190.
[
|
| [50] |
黄华, 王晓红, 陈小龙, 等. 中国城市统计年鉴. 北京: 中国统计出版社(2011—2020).
[
|
| [51] |
潘辉, 尹翔硕, 陶爱元. 中国三大城市群工资差异的影响因素及其空间外溢效应. 会计与经济研究, 2022, 36(6): 97-113.
[
|
/
| 〈 |
|
〉 |