
上海市就业人群的时间利用行为特征与影响因素研究
|
焦健(1991-),女,陕西西安人,博士,讲师,主要研究方向为时空间行为。E-mail: jiao@nwu.edu.cn |
收稿日期: 2024-01-13
录用日期: 2024-07-22
网络出版日期: 2024-09-13
基金资助
国家自然科学基金资助项目(52378069)
Research on time use behavior patterns and influencing factors of employed people in Shanghai
Received date: 2024-01-13
Accepted date: 2024-07-22
Online published: 2024-09-13
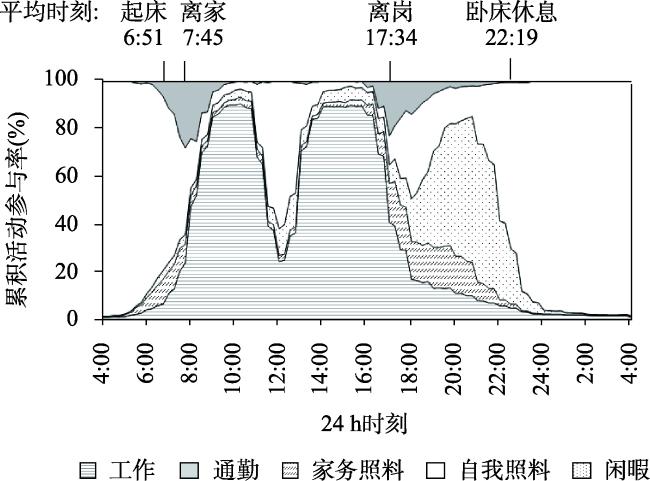
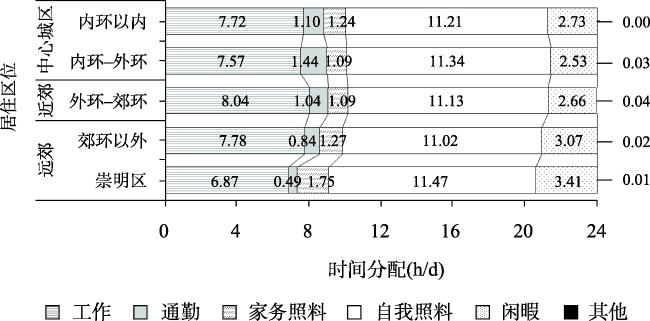
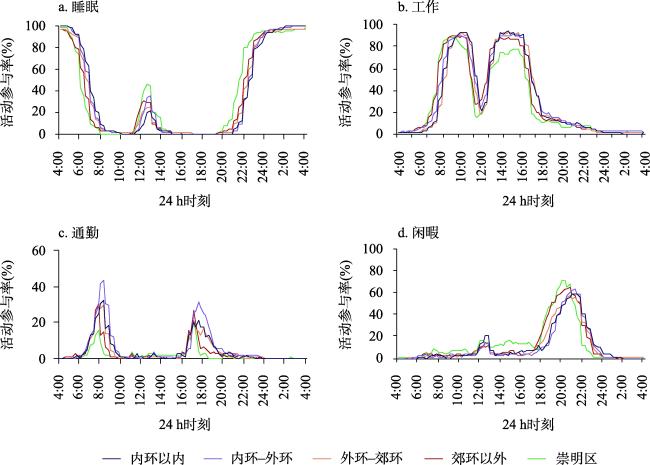
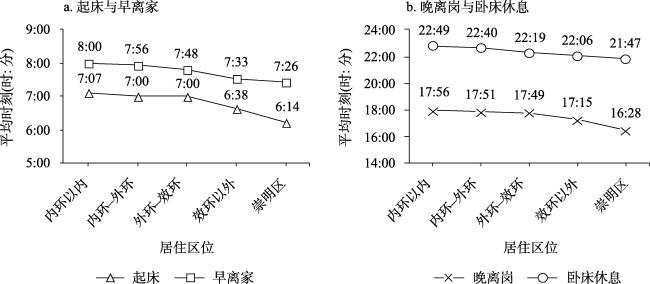
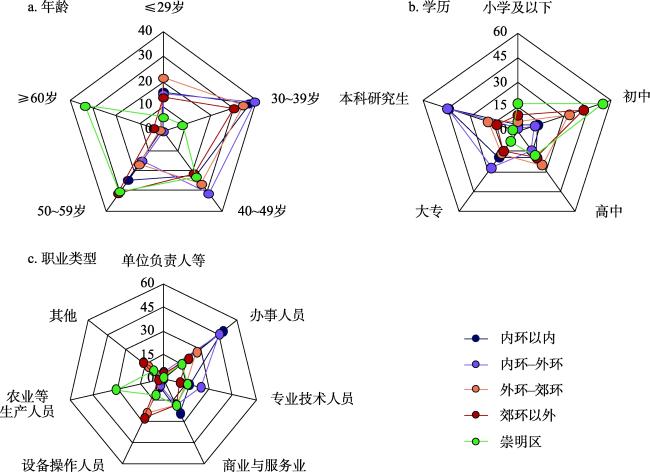
时间利用是洞察居民生活方式,研究活动与出行规律的重要维度。我国时间利用调查与研究起步较晚,尚处于发展与积累阶段。本研究采用2018年上海市时间利用调查数据,研究就业人群时间利用行为特征及其影响因素,研究发现: ① 上海市就业人群现阶段用于维持生理与生存的时间多、闲暇时间少,日常活动时间分布的规律性较强,总体围绕朝8晚6的工作时间节奏展开。② 上海市就业人群社会经济属性与工作、家务照料、闲暇时间分配的关系与已有发现有一致性,女性、养育儿童、部分体力型职业等人群因工作或家务照料压力而闲暇时间少,并提前或推后起床、离岗时间;但性别与养育儿童对通勤时间的影响不显著,不支持家庭责任假说中女性通勤时间短于男性等假设。③ 郊区与中心城区就业人群的时间利用行为有显著差异,这既源于人群属性差异,也与居住空间环境密切相关。研究成果深化了对中国大城市就业人群时间利用模式的理解,为我国时间利用研究提供了研究基础与经验。
焦健 , 王德 , 程英 . 上海市就业人群的时间利用行为特征与影响因素研究[J]. 地理研究, 2024 , 43(9) : 2370 -2391 . DOI: 10.11821/dlyj020240050
Time use is a crucial dimension for studying residents' lifestyles, daily activity patterns, and travel behavior. In China, time use surveys and research are still in their early stages of development, with limited systematic studies on the time use behavior of the employed population. This study utilizes data from the 2018 Shanghai Time Use Survey to examine the characteristics and influencing factors of time use behavior among the employed population. The results show that: (1) Employed residents in Shanghai currently spend more time on maintenance and survival activities but less time on leisure activities. Their daily activity patterns demonstrate strong regularity, with work activities generally following an 8 am to 6 pm schedule. (2) The relationship between socioeconomic attributes and time allocation for work, household care, and leisure activities among Shanghai's employed residents is consistent with previous findings. Women, individuals raising children, and those in certain manual occupations have less leisure time due to work or household care pressures, and their rest and work schedules are earlier or later than the regular schedule. However, gender and child-rearing do not significantly affect commuting time, challenging the household responsibility hypothesis that women have shorter commuting times than men. (3) There are significant differences in the time use behavior of employed residents in suburban and central city areas, due to both demographic differences and the residential spatial environment. Employed residents in the outskirts of the central city experience longer commuting times due to job-housing imbalance. Suburban workers have a higher proportion of manual occupations and longer working hours. Employed residents in Chongming exhibit characteristics of an aging population engaged in agricultural production, with the shortest work and commuting times, and their rest and work schedules are significantly earlier than those in the central city. By comprehensively analyzing the time use behavior of employed residents with different demographic attributes and geographic locations, this study sheds light on the influence of micro-level socioeconomic and geographical factors on time use patterns. It deepens the understanding of time use patterns among the employed population in Chinese metropolises and provides a foundation and empirical evidence for further time use research in China.
Key words: time allocation; temporal rhythms; influencing factors; time use survey; Shanghai
表1 研究样本的社会经济属性特征Tab. 1 Socio-economic attributes of the samples |
| 社会经济属性 | 占比(%) | 社会经济属性 | 占比(%) | ||
|---|---|---|---|---|---|
| 性别 | 男 | 57.73 | 月均收入(元) | <1000 | 10.33 |
| 女 | 42.27 | 1000~2999 | 12.52 | ||
| 年龄(岁) | ≤29 | 16.68 | 3000~4999 | 30.74 | |
| 30~39 | 31.94 | 5000~6999 | 19.19 | ||
| 40~49 | 25.02 | 7000~9999 | 13.03 | ||
| 50~59 | 22.06 | ≥10000 | 14.19 | ||
| ≥60 | 4.30 | 职业类型 | 单位负责人等 | 2.76 | |
| 婚姻状态 | 无配偶 | 14.11 | 办事人员 | 29.06 | |
| 有配偶 | 85.89 | 专业技术人员 | 15.52 | ||
| 育儿状态(岁) | 无孩子 | 55.33 | 商业与服务业 | 18.92 | |
| 孩子0~5 | 16.07 | 设备操作人员 | 19.18 | ||
| 孩子6~11 | 17.87 | 农业等生产人员 | 3.78 | ||
| 孩子12~17 | 10.73 | 其他 | 10.78 | ||
| 学历 | 小学及以下 | 7.18 | 居住区位 | 内环以内 | 10.01 |
| 初中 | 31.75 | 内环-外环 | 15.65 | ||
| 高中 | 20.85 | 外环-郊环 | 39.38 | ||
| 大专 | 17.32 | 郊环以外 | 27.07 | ||
| 本科或研究生 | 22.90 | 崇明区 | 7.89 | ||
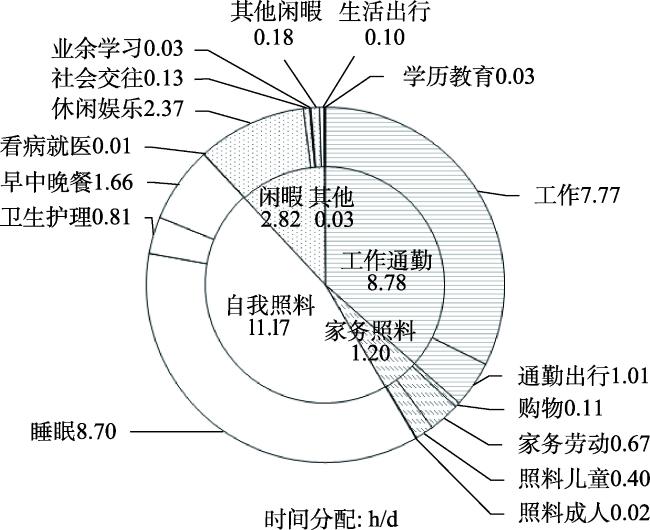
表2 活动类型划分说明Tab. 2 Activity type classification |
| 活动大类 | 活动小类 |
|---|---|
| 工作通勤 | 工作(就业工作、农业生产、非农经营等,不包含工作中断的休息活动)、通勤出行 |
| 家务照料 | 家务劳动、购物、照料儿童(包括接送)、照料成人 |
| 自我照料 | 睡眠(包括午睡)、早中晚餐、卫生护理、看病就医 |
| 闲暇 | 休闲娱乐、社会交往、业余学习(成人教育等)、其他闲暇(饲养宠物等)、生活出行 |
| 其他 | 学历教育(初等、中等、高等学历教育学习) |
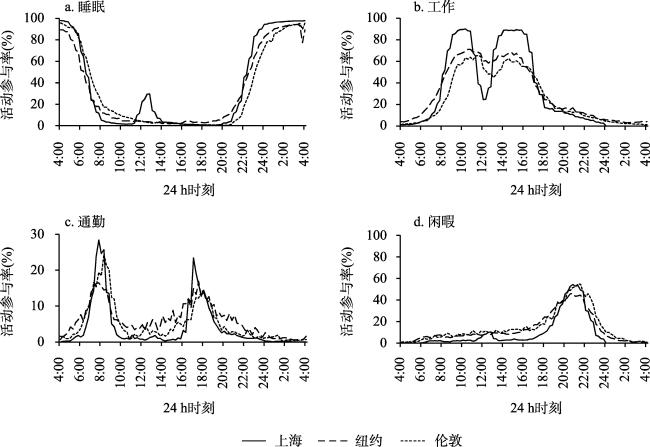
表3 上海、纽约、伦敦就业人群工作日的时间分配Tab. 3 Time allocation of employees on workdays in Shanghai, New York and London |
| 工作 | 通勤 | 家务照料 | 自我照料 | 闲暇 | |
|---|---|---|---|---|---|
| 上海 | 7.77 | 1.01 | 1.20 | 11.17 | 2.82 |
| 纽约 | 7.54 | 0.79 | 1.79 | 9.79 | 3.88 |
| 伦敦 | 7.22 | 1.10 | 1.50 | 10.10 | 3.81 |
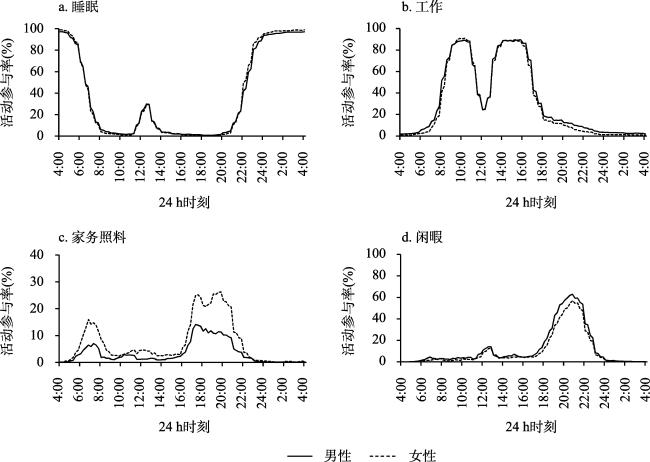
表4 就业人群工作日时间分配的性别差异Tab. 4 Time allocation of employees on workdays by gender (h/d) |
| 工作 | 通勤 | 家务照料 | 自我照料 | 闲暇 | |
|---|---|---|---|---|---|
| 男 | 7.99 | 1.02 | 0.82 | 11.09 | 3.06 |
| 女 | 7.48 | 1.01 | 1.73 | 11.27 | 2.49 |
| Wilcoxon秩和检验P值 | 0.000*** | 0.772 | 0.000*** | 0.092 | 0.000*** |
注:***代表P <0.001。 |
表5 就业人群工作日时间分配的性别差异Tab. 5 Time allocation of employees on workdays by marital and parental status (h/d) |
| 工作 | 通勤 | 家务照料 | 自我照料 | 闲暇 | ||
|---|---|---|---|---|---|---|
| 婚姻状态 | 无配偶 | 7.75 | 1.19 | 0.63 | 11.14 | 3.28 |
| 有配偶 | 7.78 | 0.98 | 1.30 | 11.17 | 2.74 | |
| 育儿状态(岁) | 无孩 | 7.86 | 0.94 | 0.87 | 11.23 | 3.08 |
| 孩子0~5 | 7.72 | 1.21 | 1.60 | 11.09 | 2.31 | |
| 孩子6~11 | 7.83 | 1.13 | 1.51 | 11.01 | 2.47 | |
| 孩子12~17 | 7.56 | 0.99 | 1.36 | 11.22 | 2.86 | |
表6 上海市就业人员工作日时间分配的影响因素模型Tab. 6 Model of influencing factors on time allocation on workdays for employed people in Shanghai |
| 工作 | 通勤 | 家务照料 | 闲暇 | ||||||||
|---|---|---|---|---|---|---|---|---|---|---|---|
| 性别(参照:男) | 女 | -0.384*** (0.116) | -0.010 (0.043) | 0.890*** (0.074) | -0.617*** (0.094) | ||||||
| 年龄(岁,参照:≤29岁) | 30~39 | -0.100 (0.187) | 0.045 (0.069) | 0.241* (0.120) | -0.064 (0.152) | ||||||
| 40~49 | -0.270 (0.202) | -0.031 (0.074) | 0.208 (0.129) | 0.143 (0.164) | |||||||
| 50~59 | -0.550* (0.216) | -0.132 (0.079) | 0.407** (0.138) | 0.265 (0.175) | |||||||
| ≥60 | -1.818*** (0.388) | -0.336* (0.143) | 0.747** (0.248) | 0.857** (0.314) | |||||||
| 婚姻状态(参照:无配偶) | 有配偶 | 0.104 (0.181) | -0.104 (0.067) | 0.316** (0.116) | -0.444** (0.147) | ||||||
| 育儿状态(岁,参照:无孩) | 孩子0~5 | -0.278 (0.175) | 0.085 (0.064) | 0.812*** (0.112) | -0.588*** (0.142) | ||||||
| 孩子6~11 | -0.169 (0.172) | 0.020 (0.063) | 0.627*** (0.110) | -0.361** (0.139) | |||||||
| 孩子12~17 | -0.397* (0.194) | -0.040 (0.071) | 0.410** (0.124) | 0.017 (0.157) | |||||||
| 学历(参照:小学及以下) | 初中 | -0.121 (0.242) | 0.066 (0.089) | -0.505** (0.155) | 0.387* (0.197) | ||||||
| 高中 | -0.458 (0.263) | 0.129 (0.097) | -0.421* (0.169) | 0.536* (0.214) | |||||||
| 大专 | -0.910** (0.286) | 0.328** (0.105) | -0.316 (0.183) | 0.578* (0.232) | |||||||
| 本科或研究生 | -0.810** (0.301) | 0.371*** (0.111) | -0.486* (0.193) | 0.607* (0.245) | |||||||
| 月均收入(元,参照:<1000元) | 1000~2999 | -0.428 (0.241) | 0.064 (0.089) | 0.025 (0.154) | 0.218 (0.195) | ||||||
| 3000~4999 | -0.142 (0.201) | 0.167* (0.074) | -0.148 (0.129) | 0.087 (0.163) | |||||||
| 5000~6999 | 0.073 (0.215) | 0.232** (0.079) | -0.149 (0.138) | -0.089 (0.175) | |||||||
| 7000~9999 | 0.071 (0.238) | 0.128 (0.088) | -0.077 (0.153) | 0.231 (0.193) | |||||||
| ≥10000 | 0.185 (0.247) | 0.309*** (0.091) | -0.194 (0.158) | -0.181 (0.200) | |||||||
| 职业类型(参照:办事人员) | 单位负责人等 | -0.330 (0.355) | -0.158 (0.131) | 0.569* (0.228) | 0.166 (0.288) | ||||||
| 专业技术人员 | 0.251 (0.174) | 0.171** (0.064) | -0.028 (0.112) | -0.245 (0.141) | |||||||
| 商业与服务业人员 | 0.611*** (0.169) | 0.036 (0.062) | -0.096 (0.108) | -0.241 (0.137) | |||||||
| 设备操作人员 | 0.903*** (0.176) | 0.033 (0.065) | -0.163 (0.113) | -0.314* (0.143) | |||||||
| 农业生产人员 | -0.913* (0.372) | 0.047 (0.137) | -0.122 (0.238) | 0.164 (0.302) | |||||||
| 其他 | 0.237 (0.208) | 0.005 (0.076) | -0.079 (0.133) | 0.028 (0.169) | |||||||
| 居住区位(参照:内环以内) | 内环-外环 | -0.088 (0.216) | 0.291*** (0.079) | -0.151 (0.138) | -0.214 (0.175) | ||||||
| 外环-郊环 | 0.125 (0.197) | 0.021 (0.073) | -0.114 (0.126) | -0.071 (0.160) | |||||||
| 郊环以外 | -0.152 (0.208) | -0.094 (0.077) | -0.068 (0.134) | 0.444** (0.169) | |||||||
| 崇明区 | -0.358 (0.303) | -0.251* (0.111) | 0.274 (0.194) | 0.608* (0.246) | |||||||
| 截距 | 8.535*** (0.391) | 0.725*** (0.144) | 0.616* (0.251) | 3.031*** (0.317) | |||||||
| R2 | 0.124 | 0.175 | 0.191 | 0.123 | |||||||
| 样本量 | 1443 | 1443 | 1443 | 1443 | |||||||
注:***、**和*分别代表P<0.001、P<0.01和P<0.05; 括号内为标准误。 |
表7 就业人群通勤时间的性别差异Tab. 7 Gender differences in commuting time (h/d) |
| 无孩 | 孩子0~5岁 | 孩子6~11岁 | 孩子12~17岁 | |
|---|---|---|---|---|
| 男性 | 0.93 | 1.18 | 1.17 | 1.02 |
| 女性 | 0.94 | 1.27 | 1.08 | 0.95 |
| Wilcoxon秩和检验P-value | 0.904 | 0.370 | 0.289 | 0.962 |
表8 上海市就业人员工作日时间节奏的影响因素模型Tab. 8 Model of influencing factors on activity rhythms on workdays for employed people in Shanghai |
| 起床 | 早离家 | 晚离岗 | 卧床休息 | ||||||||
|---|---|---|---|---|---|---|---|---|---|---|---|
| 性别(参照:男) | 女 | -0.193* (0.090) | 0.111 (0.086) | -0.284* (0.135) | 0.011 (0.087) | ||||||
| 年龄(岁,参照:≤29岁) | 30~39 | -0.475*** (0.139) | -0.467*** (0.134) | -0.277 (0.210) | -0.264 (0.136) | ||||||
| 40~49 | -0.562*** (0.148) | -0.551*** (0.142) | -0.620** (0.223) | -0.310* (0.144) | |||||||
| 50~59 | -0.963*** (0.159) | -0.632*** (0.152) | -1.493*** (0.240) | -0.449** (0.155) | |||||||
| ≥60 | -1.387*** (0.296) | -0.651* (0.283) | -1.770*** (0.446) | -0.570* (0.287) | |||||||
| 育儿状态(岁,参照:无孩) | 孩子0~5 | -0.308* (0.130) | -0.125 (0.124) | -0.281 (0.196) | 0.057 (0.126) | ||||||
| 孩子6~11 | -0.178 (0.130) | -0.099 (0.125) | -0.523** (0.195) | -0.225 (0.126) | |||||||
| 孩子12~17 | -0.116 (0.148) | 0.164 (0.143) | -0.258 (0.225) | 0.157 (0.144) | |||||||
| 学历(参照:小学及以下) | 初中 | -0.189 (0.188) | 0.168 (0.182) | -0.461 (0.285) | 0.352 (0.183) | ||||||
| 高中 | -0.066 (0.204) | 0.267 (0.198) | -0.470 (0.309) | 0.404* (0.199) | |||||||
| 大专 | -0.230 (0.221) | 0.274 (0.214) | -0.928** (0.335) | 0.567** (0.215) | |||||||
| 本科或研究生 | -0.267 (0.233) | 0.223 (0.225) | -0.838* (0.354) | 0.665** (0.226) | |||||||
| 月均收入(元,参照:1000元以下) | 1000~2999 | -0.385* (0.187) | -0.065 (0.179) | -0.232 (0.283) | 0.199 (0.181) | ||||||
| 3000~4999 | -0.311* (0.156) | -0.314* (0.151) | -0.411 (0.236) | 0.015 (0.151) | |||||||
| 5000~6999 | -0.129 (0.167) | -0.270 (0.161) | 0.248 (0.253) | 0.089 (0.162) | |||||||
| 7000~9999 | -0.198 (0.185) | -0.102 (0.177) | -0.078 (0.279) | -0.036 (0.180) | |||||||
| ≥10000 | -0.130 (0.191) | -0.253 (0.183) | 0.132 (0.288) | 0.097 (0.186) | |||||||
| 职业类型(参照:办事人员) | 单位负责人等 | 0.024 (0.274) | -0.055 (0.261) | -0.016 (0.416) | 0.146 (0.273) | ||||||
| 专业技术人员 | -0.005 (0.134) | 0.121 (0.129) | -0.074 (0.202) | -0.124 (0.131) | |||||||
| 商业与服务业人员 | -0.018 (0.131) | 0.115 (0.125) | 0.689*** (0.198) | 0.110 (0.128) | |||||||
| 设备操作人员 | -0.098 (0.137) | -0.329* (0.132) | 0.409* (0.204) | -0.125 (0.133) | |||||||
| 农业生产人员 | -0.062 (0.294) | 0.011 (0.281) | -0.852 (0.437) | -0.468 (0.280) | |||||||
| 其他 | 0.008 (0.161) | -0.253 (0.154) | 0.262 (0.241) | -0.273 (0.157) | |||||||
| 居住区位(参照:内环以内) | 内环-外环 | -0.101 (0.166) | -0.050 (0.159) | -0.055 (0.251) | -0.166 (0.162) | ||||||
| 外环-郊环 | -0.127 (0.152) | -0.096 (0.146) | -0.275 (0.230) | -0.390** (0.148) | |||||||
| 郊环以外 | -0.331* (0.161) | -0.240 (0.154) | -0.633** (0.242) | -0.451** (0.157) | |||||||
| 崇明区 | -0.507* (0.235) | -0.457* (0.224) | -0.972** (0.352) | -0.593** (0.229) | |||||||
| 截距 | 8.221*** (0.295) | 8.371*** (0.285) | 19.372*** (0.447) | 22.507*** (0.287) | |||||||
| R2 | 0.067 | 0.057 | 0.097 | 0.071 | |||||||
| 样本量 | 1433 | 1414 | 1418 | 1428 | |||||||
注:***、**和*分别代表P<0.001、P<0.01和<0.05; 括号内为标准误。 |
真诚感谢匿名评审专家在论文评审中所付出的时间和精力,专家对本文引言、文献综述与文献对话、研究方法、模型变量选择、研究结论组织等方面提出的宝贵修改意见,使本文获益匪浅。
| [1] |
柴彦威, 李峥嵘, 史中华. 生活时间调查研究回顾与展望. 地理科学进展, 1999, 18(1): 68-75.
[
|
| [2] |
焦健, 王德. 城市时间利用研究的历程,议题与展望. 城市规划学刊, 2021, (1): 52-59.
[
|
| [3] |
|
| [4] |
王雅林. 城镇居民时间预算研究. 中国社会科学, 1991, (2): 197-212.
[
|
|
王琪延. 中国人的生活时间分配. 北京: 经济科学出版社 1999.
[
|
| [6] |
柴彦威. 中日城市结构比较研究. 北京: 北京大学出版社, 1999.
[
|
| [7] |
薛东前, 刘溪, 周会粉. 中国居民时间的利用特征及其影响因素分析. 地理研究, 2013, 32(9): 1688-1698.
[
|
| [8] |
杜凤莲, 王文斌, 董晓媛. 时间都去哪儿了? 中国时间利用调查研究报告. 北京: 中国社会科学出版社, 2018.
[
|
| [9] |
金红. 2018年全国时间利用调查公报解读. 中国统计, 2019, 446(2): 9-11.
[
|
| [10] |
|
| [11] |
|
| [12] |
|
| [13] |
|
| [14] |
|
| [15] |
|
| [16] |
|
| [17] |
|
| [18] |
|
| [19] |
孟斌, 于慧丽, 郑丽敏. 北京大型居住区居民通勤行为对比研究: 以望京居住区和天通苑居住区为例. 地理研究, 2012, 31(11): 2069-2079.
[
|
| [20] |
|
| [21] |
|
| [22] |
|
| [23] |
|
| [24] |
|
/
| 〈 |
|
〉 |