孔钦钦 , 葛全胜
, 葛全胜
KONG Qinqin, GE Quansheng
通讯作者:
收稿日期: 2017-01-4
修回日期: 2017-04-4
网络出版日期: 2017-06-30
版权声明: 2017 《地理研究》编辑部 《地理研究》编辑部
基金资助:
作者简介:
作者简介:孔钦钦(1989- ),男,河南济源人,博士研究生,主要从事气候变化及其影响研究。E-mail: kongqq.12b@igsnrr.ac.cn
展开
摘要
利用ERA-Interim再分析资料,分析了1979-2014年中国极端通用热气候指数(Universal Thermal Climate Index,UTCI)时空变化特征。结果表明:① 从全国平均看,暖指数均显著上升,且暖夜日数升幅(1.50 d/10a)大于暖昼日数(1.32 d/10a),夏季最低UTCI升幅(0.63 °C/10a)大于夏季最高UTCI(0.24 °C/10a)。暖昼、暖夜日数自90年代初后迅速增多。冷指数中,冬季最高UTCI显著上升(0.42 °C/10a),其他指数无显著趋势。冷昼、冷夜日数阶段性特征明显,20世纪80年代和2000年代中期之后均值、波动幅度均较大,其间均值、波动幅度均较小。最近10年,中国夏季极端热应力和冬季极端冷应力均较为显著。② 从空间分布上看,暖指数在中国绝大多数区域上升。暖昼、暖夜日数的上升中心均位于新疆东部和内蒙古中部地区,升幅分别为3 d/10a~4.80 d/10a、4 d/10a~5.94 d/10a。冷指数中,冬季最高UTCI在82.04%的区域上升,内蒙古中部和西部及陕西北部地区升幅最大,达1.20 °C/10a~2.18 °C/10a;其他指数的变化趋势在绝大多数区域不显著,且变化幅度较小。③ 极端UTCI指数和极端气温指数均表明,中国多数地区夏季暖昼、暖夜日数上升,冬季冷昼、冷夜日数下降。但极端气温指数揭示的暖昼、暖夜日数升幅更大,且暖夜日数升幅大于暖昼日数的现象更显著,冷昼、冷夜日数下降趋势的范围和降幅也更大。
关键词:
Abstract
Based on ERA-Interim reanalysis data, this study investigated the spatio-temporal changes in extreme UTCI indices in China during 1979-2014. The results show that national average heat indices have significantly increased. Hot nights (1.50 d/10a) and summer minimum UTCI (0.63 °C/10a) have larger increasing rates than hot days (1.32 d/10a) and summer maximum UTCI (0.24 °C/10a). The number of hot days and hot nights has increased rapidly since the early 1990s. In comparison, most of cold indices show no significant trends, except for winter maximum UTCI (0.42 °C/10a). Cold days and cold nights series show distinct characteristics in different periods, with both high mean values and large fluctuation ranges in the 1980s and the period after the mid-2000s, and both low mean value and small fluctuation range in the period between them. Particularly during recent 10 years, China has been facing both severe extreme heat stress in summer and cold stress in winter. From the perspective of regional differentiation, heat indices increase over most of China. The largest increasing magnitudes of hot days and hot nights were observed over eastern Xinjiang and central Inner Mongolia, namely 3-4.80 d/10a and 4-5.94 d/10a, respectively. Winter maximum UTCI increased at 82.04% of China, with the largest increasing rates (1.20-2.18 °C/10a) in central and western Inner Mongolia and northern Shaanxi. Other cold indices show no significant trends in most of China, and their changes are relatively small. In addition, the comparison between extreme UTCI indices and extreme temperature indices shows that, both of them reveal increasing hot days and hot nights and decreasing cold days and cold nights in most parts of the country. Nonetheless, the increases in hot days and hot nights indicated by extreme temperature indices have relatively large magnitudes, and the phenomenon of hot nights increasing faster than hot days is more prominent. Besides, decreasing trends in cold days and cold nights show larger magnitudes and spatial extent for extreme temperature indices.
Keywords:
热应力(heat stress)指人体承受的净热负荷,即为维持人体核心温度的稳定,人体热调节系统需排放的热量;当该值为负时,即为冷应力(cold stress)[1]。极端热、冷应力则可能超出人体调节能力的范畴,危害人体健康。尤其在全球增暖背景下,极端热应力事件频发[2-4],在公众健康、社会经济、生态环境等领域对人类社会造成重大威胁[5,6]。认识极端热、冷应力时空变化,对于相关领域的影响评估、事件应对能力的提升及适应性策略的制定具有重要科学意义。
人体热、冷应力的衡量经历了近百年的发展。早期多使用仪器直接观测结果作为度量指标,如气温和综合了气温、湿度影响的湿球温度等[7]。此后,学者们将人的主观感受或生理反应纳入经验统计模型构建了一系列衡量指标,如有效温度(effective temperature,ET)[8]、温湿指数(temperature-humidity index,THI)[9]、风寒指数(wind chill index,WCI)[10]等;然而这些指标过于简化,无法满足指标值和热生理状态一一对应的基本要求,其经验性质也导致了指标应用的时空局限性[11]。合理的热、冷应力衡量指标须以人体热交换机制为基础,综合考虑环境因素(包括气温、湿度、风速、辐射等)、人体代谢和服装热阻等诸多因素的影响[12]。20世纪60年代后,一批基于两节点人体热交换模型的机理模型指标迅速发展[13],代表性的包括体感温度(perceived temperature,PT)[14]、标准有效温度(standard effective temperature,SET)[15]、生理等效温度(physiological equivalent temperature,PET)[16]等;这些指标有效改善了人体热、冷应力衡量水平,但由于模型结构较简单,其准确性仍有待提升。而近几年发展的通用热气候指数(universal thermal climate index,UTCI)[11,17]综合了多节点人体热调节模型[18]和自适应穿衣模型[19],是当前考虑因素最全面、最具普适性的人体热、冷应力指标[11]。与其他指标相比,UTCI具有适用多种气候类型、对气候要素改变灵敏、能更好描述热环境变化过程等优势[20]。
目前,各国学者已对极端气温的变化进行了大量研究。如Karl等指出美国20世纪期间极端高温日数略有下降[21];Klein等的研究表明欧洲绝大部分区域1976-1999年间夏季平均日最高温显著上升(0.1 °C/10a~0.8 °C/10a)[22];Della-Marta等揭示了1880-2005年间,西欧热浪频率以24%/10a的速率上升,热浪持续时间则增加了一倍[23,24]。国内研究显示,20世纪中期以来,中国暖昼、暖夜频率显著增加,且暖夜增速更大。这种增加趋势主要出现于80年代中期之后,在90年代中期更是出现了暖昼频率的大幅跃升[25-31]。此外,Ding等发现1961-2007年间,中国大部分区域热浪频率显著增加,尤其在中国北部和东南沿海地区,增速达0.4次/10a[32]。Wang等的研究表明1951-1994年间,中国热浪频率平均增加73%,中国东南部增幅最大,达132%[33]。
但由于忽略了其他要素的作用,极端气温研究无法准确衡量极端热、冷应力的变化及其对公众健康等领域的影响。近些年来,国外一些学者利用机理模型指标对不同区域极端热、冷应力的变化进行了研究。例如,Basarin等分析了塞尔维亚北部城市诺维萨德1949-2012年热浪(连续6天以上PET>95%分位数)和寒潮(连续6天以上PET<5%分位数)的变化特征,发现1980年之前热浪频率和持续时间显著下降,1981年之后显著上升,寒潮频率和持续时间则一致下降[34]。Matzarakis等发现1983年之后,雅典热浪(连续3天以上PET>35 °C)频率和持续时间分别以0.26次/a和1.33 d/a的速率上升[35]。
目前国内研究多应用人体热、冷应力指标评价区域气候冷热舒适度的平均状况,且多数基于传统经验性指标[36-38];运用机理模型指标,从生物气象角度衡量极端热、冷应力变化的研究仍处于缺失状态;这会导致对中国极端热、冷应力时空变化特征认识的缺失,不利于对极端热、冷应力变化效应的评价,以及相关领域适应性措施的制定。因此,基于ERA-Interim再分析资料,利用最新的人体热、冷应力指标UTCI,深入研究1979-2014年间中国极端热、冷应力的变化趋势、年际变化及其空间分布特征。
选用欧洲天气预报中心(ECMWF)提供的中期再分析资料ERA-Interim[39]。ERA-Interim是ECMWF发布的一套较新的高分辨率再分析资料,资料起始时间为1979年,且实时更新。该资料被认为是ERA 40的升级,在水分收支和循环、平流层大气环流、针对观测偏差及观测系统变迁的处理等关键方面有显著改善[40-42]。研究使用的气象参数包括2 m气温、2 m露点温度、10 m风速、地表温度和云覆盖总量。每日有4次观测,分别在北京时间02:00、08:00、14:00和20:00;数据水平分辨率为1°×1°;时间段为1979-2015年。
UTCI被定义为在标准参照环境下,使人产生与实际环境中相同生理响应的气温[17],其具体计算过程参考Ge等[43]。依据人体热生理响应的程度,UTCI值被划分为极强冷应力(<-40 °C)、很强冷应力(-40 °C~-27 °C)、强冷应力(-27 °C~-13 °C)、较强冷应力(-13 °C~0 °C)、轻微冷应力(0 °C~9 °C)、无热应力(9 °C~26 °C)、较强热应力(26 °C~32 °C)、强热应力(32 °C~38 °C)、很强热应力(38 °C~46 °C)和极强热应力(>46 °C)等10个等级[17]。
定义夏季为6-8月,冬季为12月至次年2月,在此基础上制订极端UTCI指数如表1所示,并将其分为暖指数和冷指数。值得注意的是,由于UTCI模型对人体热生理响应的模拟基于“标准人体”假设,考虑到不同地区居民生理条件的差异,以及对当地气候的适应等因素的影响,上文绝对划分标准无法保证适用于中国不同地区。故本文采用百分位阈值的方法定义部分极端UTCI指数,包括暖昼日数、暖夜日数、冷昼日数和冷夜日数。以暖昼日数为例,若某年夏季某日最高UTCI值大于以该日为中心的5天窗口期的36年同期序列(样本数为180)的90%分位值,则判定该日出现暖昼;暖夜日数、冷昼日数和冷夜日数的定义同理可得。
表1 极端UTCI指数定义
Tab. 1 Definition of extreme UTCI indices
| 类型 | 指标名称 | 代码 | 单位 | 定义 |
|---|---|---|---|---|
| 暖指数 | 夏季最高UTCI | UXs | °C | 每年夏季日最高UTCI的最大值 |
| 夏季最低UTCI | UNs | °C | 每年夏季日最低UTCI的最小值 | |
| 暖昼日数 | UX90p | d | 每年夏季日最高UTCI大于90%分位值的天数 | |
| 暖夜日数 | UN90p | d | 每年夏季日最低UTCI大于90%分位值的天数 | |
| 冷指数 | 冬季最高UTCI | UXw | °C | 每年冬季日最高UTCI的最大值 |
| 冬季最低UTCI | UNw | °C | 每年冬季日最低UTCI的最小值 | |
| 冷昼日数 | UX10p | d | 每年冬季日最高UTCI小于10%分位值的天数 | |
| 冷夜日数 | UN10p | d | 每年冬季日最低UTCI小于10%分位值的天数 |
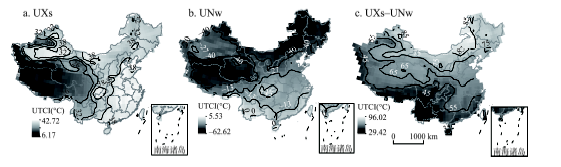
图1给出了1979-2014年中国夏季最高UTCI、冬季最低UTCI及其差值的多年平均值的空间分布。夏季最高UTCI在太行山—巫山—雪峰山一线东南、四川盆地、塔里木盆地东部、哈密地区、准噶尔盆地和阿拉善高原部分地区达到了38 °C~46 °C,即“很强热应力”;在青藏高原及新疆山地地区介于9 °C~26 °C,即“无热应力”;云贵高原为26 °C~32 °C,即“较强热应力”;剩余绝大多数地区为32 °C~38 °C,即“强热应力”(图1a)。冬季最低UTCI具有明显的纬向型分布规律,在华南地区及四川盆地东部多处于-13 °C~0 °C的区间,即“较强冷应力”;在江淮地区为-27 °C~-13 °C,即“强冷应力”;青藏高原北部、东北、内蒙古及新疆北部边境附近地区达到了-40 °C以下,即“极强冷应力”,大兴安岭以西及昆仑山脉附近地区甚至低于-50 °C;剩余地区介于-40 °C~-27 °C,即“很强冷应力”(图1b)。由图1c可以发现,中国夏季最高UTCI和冬季最低UTCI的差值自南向北逐渐递增;其中云南省南部最小,为30 °C~35 °C;东北、内蒙古高原和新疆东北部与蒙古边境地区最大,超过75 °C,内蒙古东部部分地区甚至达到了85 °C~96 °C。
图1 1979-2014年中国极端UTCI指数多年平均值空间分布
Fig. 1 Spatial distribution of long-term mean values of extreme UTCI indices in China during 1979-2014
3.2.1 全国平均 如表2所示,中国平均极端UTCI暖指数均呈上升趋势,且都通过了0.01显著性检验,反映了1979年以来中国夏季极端热应力的加剧态势。此外,暖夜日数的升幅高于暖昼日数,夏季最低UTCI的升幅更是夏季最高UTCI的2.5倍以上;这与之前中国气温变化研究中夜间增暖更明显的结论一致。极端UTCI冷指数中,除冬季最高UTCI外,其余指数均无明显趋势,即整体而言,中国冬季极端冷应力不存在明显的加剧或减缓。
表2 1979-2014年中国平均极端UTCI指数变化趋势
Tab. 2 Trends in national average extreme UTCI indices in China during 1979-2014
| 暖指数 | 线性趋势 | 冷指数 | 线性趋势 |
|---|---|---|---|
| UXs(°C/10a) | 0.24* | UXw(°C/10a) | 0.42* |
| UNs(°C/10a) | 0.63* | UNw(°C/10a) | 0.04 |
| UX90p(d/10a) | 1.32* | UX10p(d/10a) | -0.14 |
| UN90p(d/10a) | 1.50* | UN10p(d/10a) | 0.04 |
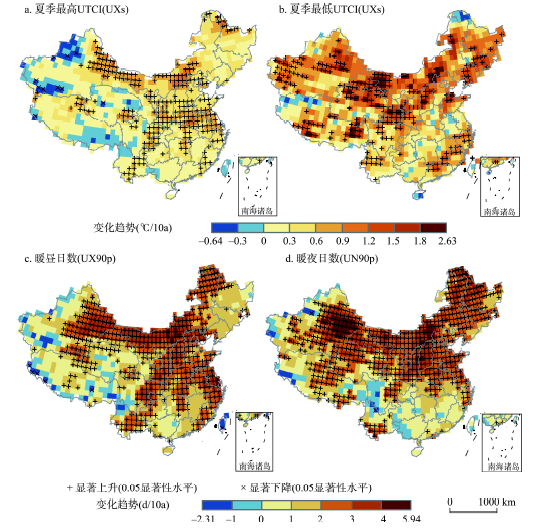
3.2.2 空间分异 图2显示了极端UTCI暖指数变化趋势的空间分布。夏季最高UTCI和夏季最低UTCI在全国绝大多数地区呈上升趋势,但空间分布差异明显。夏季最高UTCI在27.16%的区域显著(若无特殊说明,均为0.05显著性水平。)以西地区,以及四川东部、云南中部、青藏高原北部和东南沿海少数区域;内蒙古中部和河南省东南部部分地区的升幅最大,达0.90 °C/10a~1.16 °C/10a (图2a)。夏季最低UTCI的显著上升趋势主要分布于中国北部和西南部地区以及东南沿海区域,面积占比为27.06%;其升幅在中国绝大多数地区超过了0.30 °C/10a,在中国北部及青藏高原部分地区甚至达到了1.20 °C/10a~2.63 °C/10a (图2b)。值得注意的是,夏季最低UTCI的升幅在74.86%的区域比夏季最高UTCI 大0.10 °C/10a 以上,这一差距在中国北方及青藏高原南部大部分区域则达到了0.50 °C/10a~2.43 °C/10a。
图2 1979-2014年中国极端UTCI暖指数变化趋势空间分布
Fig. 2 Spatial distribution of trends in extreme UTCI heat indices in China during 1979-2014
对暖昼、暖夜日数而言,上升趋势在除西部边缘地区和横断山脉地区以外的中国多数区域占主导地位。暖昼日数在52.91%的区域显著上升,包括除东北和新疆西部的中国北方地区、长江以北、云贵高原和东南沿海;其中新疆东部和内蒙古中西部地区的升幅最大,达3 d/10a~4.80 d/10a(图2c)。暖夜显著上升趋势覆盖了除新疆西部以外的广大北方地区,以及青藏高原东部和云南南部地区,面积占比达60.06%;其升幅在中国北方多数地区超过2 d/10a,在新疆东部和内蒙古中部甚至达到4 d/10a~5.94 d/10a(图2d)。此外,在除长江以南地区之外的绝大多数区域,暖夜日数升幅明显高于暖昼日数。
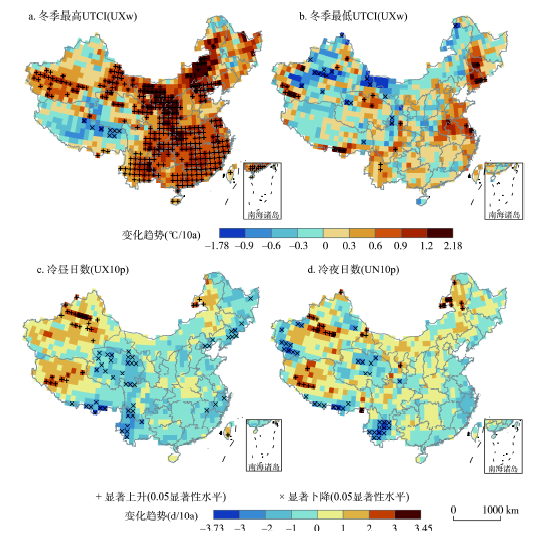
图3给出了极端UTCI冷指数变化趋势的空间分布。冬季最高UTCI在除青藏高原地区以外的区域均呈上升趋势;其中秦岭淮河一线以南,除北疆以外的中国西北地区、华北北部以及内蒙古中部地区达到了0.05显著性水平;内蒙古中部和西部,以及陕西北部地区的升幅最大,达1.20 °C/10a~2.18 °C/10a(图3a)。冬季最低UTCI变化趋势的区域一致性较低,即上升、下降趋势交错,且在95.51%的区域未通过显著性检验(图3b)。
冷昼日数在新疆、青藏高原西部和内蒙古北部增加;其余地区以下降为主,青海、藏东南、滇东、东北东部通过显著性检验,降幅为-1 °C/10a~-3.47 °C/10a(图3c)。冷夜日数在新疆西南部、青海中部、西藏南部边缘和云南部分地区以-2 °C/10a~-3.73 °C/10a的速度显著下降;在新疆天山地区、青藏高原西部和呼伦贝尔高原地区以2 °C/10a~3.36 °C/10a的速度显著上升(图3d)。值得注意的是,冷昼、冷夜日数变化趋势在中国多数地区(91.61%、92.69%)均不显著,且变化幅度在中国人口稠密的中、东部地区均较小,验证了4.1部分中国冬季极端冷应力不存在明显变化趋势的结论。
图3 1979-2014年中国极端UTCI冷指数变化趋势空间分布
Fig. 3 Spatial distribution of trends in extreme UTCI cold indices in China during 1979-2014
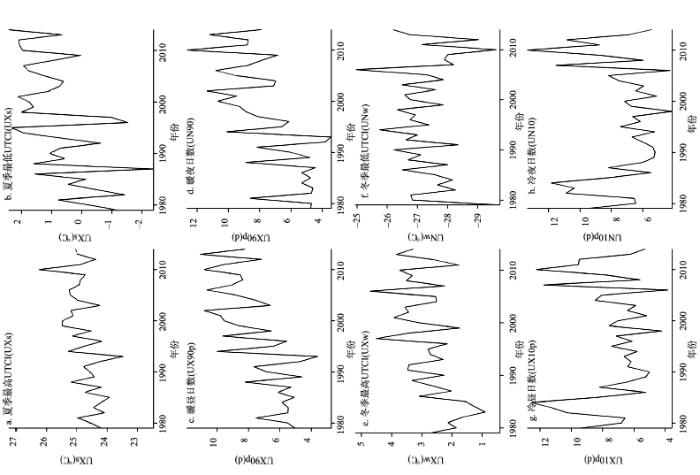
图4为中国加权平均后的极端UTCI指数时间序列。可以看出,不同指数的年际波动特征存在差异。夏季最高UTCI从1979年逐渐波动上升至2010年达到最大值(26.25 °C),之后有所回落(图4a)。夏季最低UTCI呈波动上升趋势;同时以1998年左右为界,后一段相比前一段其年际波动幅度明显减小(图4b)。此外,夏季最低UTCI的年际变幅明显高于夏季最高UTCI。暖昼、暖夜日数年际变化特征基本一致(图4c、图4d),20世纪90年代初之前稳定波动,之后迅速上升,且上升速度逐渐减缓;平均日数分别由80年代(1979-1989年)的5.84 d和5.53 d上升至21世纪后(2000-2014年)的9.11 d和9.24 d。在过去36年中,2002年、2006年、2010年和2013年同时是暖昼、暖夜日数最多的4年,而暖昼、暖夜日数最多的10年中分别有8年和7年发生于21世纪,凸显了进入21世纪后中国夏季极端热应力的加剧。
图4 1979-2014年中国平均极端UTC指数时间序列
Fig. 4 National average series of extreme UTCI indices during 1979-2014
对极端冷指数而言,冬季最高UTCI于1983年降至最小值(0.90 °C)后迅速回升,并于20世纪90年代后维持稳定的波动变化,期间1997年和2006年明显高于其他年份,分别为4.52 °C和4.72 °C(图4e)。与之不同,冬季最低UTCI首先以1.10 °C/10a的速度波动上升至1994年,然后逐渐下降(-0.79 °C/10a)至2005年,之后波动幅度突然增大,并分别于2006年和2010年达到最大值(-24.98 °C)和最小值(-29.70 °C),2010年后有所回升(图4f)。冷昼、冷夜日数年际波动特征相似(图4g、图4h),且具有明显的阶段性特征:80年代(1979-1989年)分别在8.01 d、8.08 d的较高均值附近大幅波动,其中1982-1984年冷昼、冷夜日数异常偏多;1990-2005年,冷昼、冷夜日数皆小幅波动变化,但波动幅度逐渐增大,且该时段均值明显降低,分别为6.47 d、6.25 d;此后(2006-2014年),两者再度恢复大幅波动变化,且均值分别上升至7.99 d和8.43 d,其中2007、2010年冷昼、冷夜日数异常偏高。
比较冷暖指数年际波动特征可以发现,进入21世纪后,特别是最近10年,中国夏季极端热应力和冬季极端冷应力均较为严重。其中2010年尤为典型,暖昼、冷昼日数皆为36 a中的次大值,暖夜、冷夜日数更皆为最大值。
以上基于UTCI指数分析了中国极端热、冷应力的时空变化特征。传统的基于气温的研究忽略了风速、湿度、辐射等因素的影响,对热、冷应力的衡量存在偏差。为定量揭示这一偏差,定义极端气温指数如表3所示,包括暖昼日数、暖夜日数、冷昼日数、冷夜日数,并将其变化趋势与相应的极端UTCI指数进行比较。
表3 极端气温指数定义
Tab. 3 Definition of extreme temperature indices
| 指标名称 | 代码 | 单位 | 定义 |
|---|---|---|---|
| 暖昼日数 | TX90p | d | 每年夏季日最高气温大于90%分位值的天数 |
| 暖夜日数 | TN90p | d | 每年夏季日最低气温大于90%分位值的天数 |
| 冷昼日数 | TX10p | d | 每年冬季日最高气温小于10%分位值的天数 |
| 冷夜日数 | TN10p | d | 每年冬季日最低气温小于10%分位值的天数 |
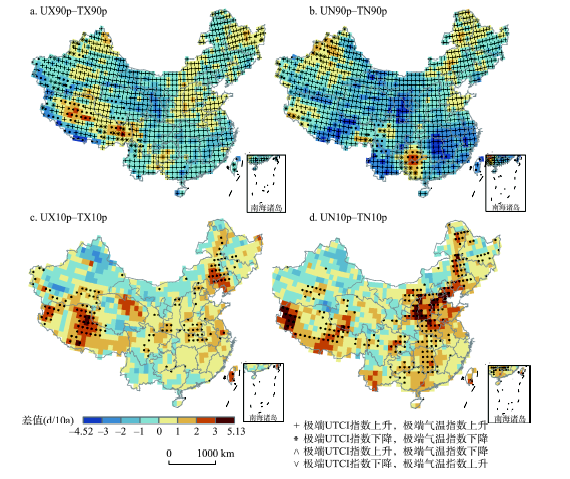
TX90p、TN90p变化趋势的空间分布与UX90p、UN90p相似,全国90%以上的区域表现为一致的上升或下降趋势(表4);同时对极端气温指数而言,暖夜日数升幅高于暖昼日数的结论仍然成立,且两者差距更大,全国普遍超过0.5 d/10a,在青藏高原东部和云南南部甚至达到3.00 d/10a~6.20 d/10a。对暖昼日数而言,UX90p与TX90p在全国86.61%的区域均呈上升趋势,而这些区域中68.29%的区域TX90p的上升幅度更大。值得注意的是,在人口、经济活动密集的东部地区,秦岭淮河一线以南TX90p升幅更大,以北除东北南部和河北北部外,UX90p的上升幅度更大(图5a)。对暖夜日数而言,全国89.4%的区域表现为UN90p与TN90p的一致上升,其中绝大多数区域TN90p的升幅大于UN90p,且这一差值相比暖昼日数明显增加,在中国东部长江以南多数地区达到了2 d/10a~4.52 d/10a(图5b)。综上所述,极端UTCI指数和极端气温指数的分析均表明,1979年以来中国绝大多数区域夏季暖昼、暖夜日数呈上升趋势,但极端气温指数所揭示的上升幅度更大,对暖夜日数尤其如此。
表4 极端UTCI指数和极端气温指数各趋势组合所占面积比例(%)
Tab. 4 Area ratio of different combinations of trends in extreme UTCI and temperature indices (%)
| 指数 | 趋势组合 | 面积比例 | ||
|---|---|---|---|---|
| 暖昼日数 | 同向 | UX90p上升、TX90p上升 | 86.61 | 90.98 |
| UX90p下降、TX90p下降 | 4.37 | |||
| 异向 | UX90p上升、TX90p下降 | 4.38 | 9.02 | |
| UX90p下降、TX90p上升 | 4.64 | |||
| 暖夜日数 | 同向 | UN90p上升、TN90p上升 | 89.40 | 93.92 |
| UN90p下降、TN90p下降 | 4.52 | |||
| 异向 | UN90p上升、TN90p下降 | 2.82 | 6.08 | |
| UN90p下降、TN90p上升 | 3.26 | |||
| 冷昼日数 | 同向 | UX10p上升、TX10p上升 | 20.05 | 77.62 |
| UX10p下降、TX10p下降 | 57.57 | |||
| 异向 | UX10p上升、TX10p下降 | 16.68 | 22.38 | |
| UX10p下降、TX10p上升 | 5.70 | |||
| 冷夜日数 | 同向 | UN10p上升、TN10p上升 | 27.04 | 69.28 |
| UN10p下降、TN10p下降 | 42.24 | |||
| 异向 | UN10p上升、TN10p下降 | 25.14 | 30.72 | |
| UN10p下降、TN10p上升 | 5.58 | |||
TX10p、TN10p与UX10p、UN10p变化趋势的空间分布差异较大。对冷昼日数而言,UX10p和TX10p在77.62%的区域同向变化。其中多数地区表现为两者一致下降特征,且TX10p的降幅普遍更大,尤其在青藏高原南部和东北部以及东部沿海地区,TX10p平均每10a比UX10p多下降1 d/10a~3 d/10a。在中国22.38%的区域,UX10p和TX10p变化趋势相反;具体地,16.68%的区域表现为UX10p上升、TX10p下降,主要包括青藏高原部分地区、新疆南部、内蒙古东部,以及秦岭淮河一线附近地区。对冷夜日数而言,UN10p和TN10p在69.28%的区域呈同向变化,一致下降趋势占42.24%。在人口、经济活动密集的中国东部地区,UN10p和TN10p均呈下降趋势,且TN10p的降幅更大,尤其在华北地区,TN10p平均每10a比UN10p多下降1~3 d。中国30.72%的区域表现为UN10p和TN10p的相反变化趋势,其中多数区域为前者上升、后者下降。即极端UTCI指数和极端气温指数均表明1979-2014年间中国多数地区冬季冷昼、冷夜日数呈下降趋势(多数没有通过0.05显著性检验),但极端气温指数所揭示的下降趋势在覆盖范围、下降幅度方面均明显大于极端UTCI指数。
图5 1979-2014年中国极端UTCI指数变化趋势与极端气温指数变化趋势差值的空间分布
Fig. 5 Spatial distribution of the differences between trends in extreme UTCI indices and extreme temperature indices in China during 1979-2014
(1)从全国平均看,极端UTCI暖指数均显著上升,暖夜日数(1.50 d/10a)、夏季最低UTCI升幅(0.63 °C/10a)分别高于暖昼日数(1.32 d/10a)、夏季最高UTCI升幅(0.24 °C/10a)。除冬季最高UTCI外,极端UTCI冷指数均无显著变化趋势。此外,暖指数变化幅度明显大于冷指数。
(2)从区域差异看,夏季最高UTCI、夏季最低UTCI、暖昼日数、暖夜日数分别在85.74%、95.51%、91.01%、92.34%的区域呈上升趋势,并分别在27.16%%、27.06%、52.91%、60.06%的区域通过了0.05显著性检验。其中对暖昼、暖夜日数而言,新疆东部和内蒙古中部地区均为上升中心,升幅分别达3 d/10a~4.80 d/10a、4 d/10a~5.94 d/10a。冷指数中,冬季最高UTCI在82.04%的区域上升,内蒙古中部和西部以及陕西北部地区升幅最大,达1.20 °C/10a~2.18 °C/10a。冬季最低UTCI、冷昼日数和冷夜日数的变化趋势仅在4.49%、8.39%、7.31%的区域通过了0.05显著性检验,且变化幅度均较小。
(3)从年际波动看,夏季最高、最低UTCI皆逐渐波动上升;暖昼、暖夜日数自20世纪90年代初后迅速增多。冬季最高UTCI于1983年降至最小值后迅速回升,90年代后维持稳定波动;冬季最低UTCI90年代中期之前波动上升,之后波动下降至2000年代中期;冷昼、冷夜日数序列阶段性特征明显,80年代和2000年代中期之后均值、波动幅度均较大,期间90年代至2000年代中期均值、波动幅度均较小。最近10年里,中国夏季极端热应力和冬季极端冷应力同时加剧。
(4)极端UTCI指数和极端气温指数的分析均表明,1979年以来中国多数地区夏季暖昼、暖夜日数上升,冬季冷昼、冷夜日数下降(多数没有通过0.05显著性检验)。不同之处在于,极端气温指数所揭示的暖昼、暖夜日数上升幅度更大,且暖夜日数升幅大于暖昼日数的现象更明显;另外,极端气温指数分析中,冷昼、冷夜日数下降趋势的覆盖范围、下降幅度均更大。
The authors have declared that no competing interests exist.
| [16] |
Thermal comfort of man in different urban environments .https://doi.org/10.1007/BF00866252 URL [本文引用: 1] 摘要
On July 29, 1985, a hot summer day, biometeorological measurements were performed simultaneously in three different urban structures within the city of Munich and in the trunk space of a nearby tall spruce forest. Based on the results of these experiments the following thermophysiologically relevant biometeorological indices were calculated: Predicted mean vote, skin wettedness and physiologically equivalent temperature. These three indices are derived from different models for the human energy balance. They allow the assessment of the thermal components of the microclimates at the selected sites with regard to application in urban planning. The results quantitatively show the great heat stress in the urban structure “street canyon, exposed to south”, whereas in the “trunk space of the tall spruce forest” there is nearly an optimal climate even on hot summer days. Between these extremes the results for “street canyon, exposed to north” show a little higher heat load than for “backyard with trees”.
|
| [17] |
Deriving the operational procedure for the universal thermal climate index (UTCI) .https://doi.org/10.1007/s00484-011-0454-1 URL PMID: 21626294 Magsci [本文引用: 3] 摘要
The Universal Thermal Climate Index (UTCI) aimed for a one-dimensional quantity adequately reflecting the human physiological reaction to the multi-dimensionally defined actual outdoor thermal environment. The human reaction was simulated by the UTCI-Fiala multi-node model of human thermoregulation, which was integrated with an adaptive clothing model. Following the concept of an equivalent temperature, UTCI for a given combination of wind speed, radiation, humidity and air temperature was defined as the air temperature of the reference environment, which according to the model produces an equivalent dynamic physiological response. Operationalising this concept involved (1) the definition of a reference environment with 50% relative humidity (but vapour pressure capped at 20 hPa), with calm air and radiant temperature equalling air temperature and (2) the development of a one-dimensional representation of the multivariate model output at different exposure times. The latter was achieved by principal component analyses showing that the linear combination of 7 parameters of thermophysiological strain (core, mean and facial skin temperatures, sweat production, skin wettedness, skin blood flow, shivering) after 30 and 120 min exposure time accounted for two-thirds of the total variation in the multi-dimensional dynamic physiological response. The operational procedure was completed by a scale categorising UTCI equivalent temperature values in terms of thermal stress, and by providing simplified routines for fast but sufficiently accurate calculation, which included look-up tables of pre-calculated UTCI values for a grid of all relevant combinations of climate parameters and polynomial regression equations predicting UTCI over the same grid. The analyses of the sensitivity of UTCI to humidity, radiation and wind speed showed plausible reactions in the heat as well as in the cold, and indicate that UTCI may in this regard be universally useable in the major areas of research and application in human biometeorology.
|
| [18] |
UTCI-Fiala multi-node model of human heat transfer and temperature regulation .https://doi.org/10.1007/s00484-011-0424-7 URL PMID: 21503622 Magsci [本文引用: 1] 摘要
The UTCI-Fiala mathematical model of human temperature regulation forms the basis of the new Universal Thermal Climate Index (UTC). Following extensive validation tests, adaptations and extensions, such as the inclusion of an adaptive clothing model, the model was used to predict human temperature and regulatory responses for combinations of the prevailing outdoor climate conditions. This paper provides an overview of the underlying algorithms and methods that constitute the multi-node dynamic UTCI-Fiala model of human thermal physiology and comfort. Treated topics include modelling heat and mass transfer within the body, numerical techniques, modelling environmental heat exchanges, thermoregulatory reactions of the central nervous system, and perceptual responses. Other contributions of this special issue describe the validation of the UTCI-Fiala model against measured data and the development of the adaptive clothing model for outdoor climates.
|
| [19] |
The UTCI-clothing model .https://doi.org/10.1007/s00484-011-0451-4 URL PMID: 21607531 Magsci [本文引用: 1] 摘要
The Universal Thermal Climate Index (UTCI) was conceived as a thermal index covering the whole climate range from heat to cold. This would be impossible without considering clothing as the interface between the person (here, the physiological model of thermoregulation) and the environment. It was decided to develop a clothing model for this application in which the following three factors were considered: (1) typical dressing behaviour in different temperatures, as observed in the field, resulting in a model of the distribution of clothing over the different body segments in relation to the ambient temperature, (2) the changes in clothing insulation and vapour resistance caused by wind and body movement, and (3) the change in wind speed in relation to the height above ground. The outcome was a clothing model that defines in detail the effective clothing insulation and vapour resistance for each of the thermo-physiological model's body segments over a wide range of climatic conditions. This paper details this model's conception and documents its definitions.
|
| [20] |
Comparison of UTCI to selected thermal indices .https://doi.org/10.1007/s00484-011-0453-2 URL PMID: 21614619 Magsci [本文引用: 1] 摘要
Over the past century more than 100 indices have been developed and used to assess bioclimatic conditions for human beings. The majority of these indices are used sporadically or for specific purposes. Some are based on generalized results of measurements (wind chill, cooling power, wet bulb temperature) and some on the empirically observed reactions of the human body to thermal stress (physiological strain, effective temperature). Those indices that are based on human heat balance considerations are referred to as "rational indices". Several simple human heat balance models are known and are used in research and practice. This paper presents a comparative analysis of the newly developed Universal Thermal Climate Index (UTCI), and some of the more prevalent thermal indices. The analysis is based on three groups of data: global data-set, synoptic datasets from Europe, and local scale data from special measurement campaigns of COST Action 730. We found the present indices to express bioclimatic conditions reasonably only under specific meteorological situations, while the UTCI represents specific climates, weather, and locations much better. Furthermore, similar to the human body, the UTCI is very sensitive to changes in ambient stimuli: temperature, solar radiation, wind and humidity. UTCI depicts temporal variability of thermal conditions better than other indices. The UTCI scale is able to express even slight differences in the intensity of meteorological stimuli.
|
| [21] |
Indices of climate change for the United States . |
| [22] |
Trends in indices of daily temperature and precipitation extremes in Europe, 1946-99 .https://doi.org/10.1175/1520-0442(2003)0162.0.CO;2 URL [本文引用: 1] 摘要
Abstract Trends in indices of climate extremes are studied on the basis of daily series of temperature and precipitation observations from more than 100 meteorological stations in Europe. The period is 1946-99, a warming episode. Averaged over all stations, the indices of temperature extremes indicate "symmetric'' warming of the cold and warm tails of the distributions of daily minimum and maximum temperature in this period. However, "asymmetry'' is found for the trends if the period is split into two subperiods. For the 1946-75 subperiod, an episode of slight cooling, the annual number of warm extremes decreases, but the annual number of cold extremes does not increase. This implies a reduction in temperature variability. For the 1976-99 subperiod, an episode of pronounced warming, the annual number of warm extremes increases 2 times faster than expected from the corresponding decrease in the number of cold extremes. This implies an increase in temperature variability, which is mainly due to stagnation in the warming of the cold extremes. For precipitation, all Europe-average indices of wet extremes increase in the 1946-99 period, although the spatial coherence of the trends is low. At stations where the annual amount increases, the index that represents the fraction of the annual amount due to very wet days gives a signal of disproportionate large changes in the extremes. At stations with a decreasing annual amount, there is no such amplified response of the extremes. The indices of temperature and precipitation extremes in this study were selected from the list of climate change indices recommended by the World Meteorological Organization-Commission for Climatology (WMO-CCL) and the Research Programme on Climate Variability and Predictability (CLIVAR). The selected indices are expressions of events with return periods of 5-60 days. This means that the annual number of events is sufficiently large to allow for meaningful trend analysis in similar to50 yr time series. Although the selected indices refer to events that may be called "soft'' climate extremes, these indices have clear impact relevance.
|
| [23] |
Doubled length of western European summer heat waves since 1880. Journal of https://doi.org/10.1029/2007JD008510 URL [本文引用: 1] 摘要
We analyzed a new data set of 54 high-quality homogenized daily maximum temperature series from western Europe (Austria, Belgium, Croatia, Czech Republic, Denmark, Finland, France, Germany, Ireland, Netherlands, Portugal, Spain, Sweden, Switzerland, United Kingdom) to define more accurately the change in extreme warm Daily Summer Maximum Temperature (DSMT). Results from the daily temperature homogeneity analysis suggest that many instrumental measurements in the late 19th and early 20th centuries were warm-biased. Correcting for these biases, over the period 1880 to 2005 the length of summer heat waves over western Europe has doubled and the frequency of hot days has almost tripled. The DSMT Probability Density Function (PDF) shows significant changes in the mean (+1.6 0.4 C) and variance (+6 2%). These conclusions help further the evidence that western Europe's climate has become more extreme than previously thought and that the hypothesized increase in variance of future summer temperature has indeed been a reality over the last 126 years.
|
| [24] |
Summer heat waves over western Europe 1880-2003, their relationship to large-scale forcings and predictability .https://doi.org/10.1007/s00382-007-0233-1 URL Magsci [本文引用: 1] 摘要
<a name="Abs1"></a>We investigate the large-scale forcing and teleconnections between atmospheric circulation (sea level pressure, SLP), sea surface temperatures (SSTs), precipitation and heat wave events over western Europe using a new dataset of 54 daily maximum temperature time series. Forty four of these time series have been homogenised at the daily timescale to ensure that the presence of inhomogeneities has been minimised. The daily data have been used to create a seasonal index of the number of heat waves. Using canonical correlation analysis (CCA), heat waves over western Europe are shown to be related to anomalous high pressure over Scandinavia and central western Europe. Other forcing factors such as Atlantic SSTs and European precipitation, the later as a proxy for soil moisture, a known factor in strengthening land–atmosphere feedback processes, are also important. The strength of the relationship between summer SLP anomalies and heat waves is improved (from 35%) to account for around 46% of its variability when summer Atlantic and Mediterranean SSTs and summer European precipitation anomalies are included as predictors. This indicates that these predictors are not completely collinear rather that they each have some contribution to accounting for summer heat wave variability. However, the simplicity and scale of the statistical analysis masks this complex interaction between variables. There is some useful predictive skill of summer heat waves using multiple lagged predictors. A CCA using preceding winter North Atlantic SSTs and preceding January to May Mediterranean total precipitation results in significant hindcast (1972–2003) Spearman rank correlation skill scores up to 0.55 with an average skill score over the domain equal to 0.28 ± 0.28. In agreement with previous studies focused on mean summer temperature, there appears to be some predictability of heat wave events on the decadal scale from the Atlantic Multidecadal Oscillation (AMO), although the long-term global mean temperature is also well related to western European heat waves. Combining these results with the observed positive trends in summer continental European SLP, North Atlantic SSTs and indications of a decline in European summer precipitation then possibly these long-term changes are also related to increased heat wave occurrence and it is important that the physical processes controlling these changes be more fully understood.
|
| [25] |
Changes in extreme daily mean temperatures in summer in eastern China during 1955-2000 .https://doi.org/10.1007/s00704-003-0019-2 URL [本文引用: 1] 摘要
Statistical characteristics of extremely low and high daily mean temperatures in summer (June, July and August) in eastern China have been investigated. The extremely low temperatures are defined as those days with temperatures not exceeding the 10th percentile with respect to the reference period of 1961–90; similarly the extremely high temperatures are defined as those exceeding the 90th percentile. There are well-defined spatial structures in trends of the frequency of extremely low temperatures as well as of high temperature extremes. In the north region (i.e. northern and northeastern China) the linear trends of frequency of low and high temperature extremes are 611.09 and +1.23 days/1065yr, respectively. For the southern portion of the study area, the trends are 611.32 and 612.32 days/1065yr. Taking the study area as a whole, the linear trends are 610.76 days/1065yr and +1.08 days/1065yr, respectively. The changes of frequency of extreme temperatures are mainly related to the shift in the temperature means. There is a dominant anticyclonic pattern in the lower- to middle troposphere over East Asia in association with warmer conditions in the north region. For the south region there is a jump-like change in the summer mean temperature and the extreme temperature events in around 1976. The large-scale northwestern Pacific subtropical high plays an important role in the jump-like changes of the temperature extremes.
|
| [26] |
Climatology and trends of high temperature extremes across China in summer .https://doi.org/10.1080/16742834.2009.11446795 URL |
| [27] |
Recent trends in observed temperature and precipitation extremes in the Yangtze River Basin, China .https://doi.org/10.1007/s00704-005-0139-y URL 摘要
The present study is an analysis of the observed extreme temperature and precipitation trends over Yangtze from 1960 to 2002 on the basis of the daily data from 108 meteorological stations. The intention is to identify whether or not the frequency or intensity of extreme events has increased with climate warming over Yangtze River basin in the last 40 years. Both the Mann-Kendall (MK) trend test and simple linear regression were utilized to detect monotonic trends in annual and seasonal extremes.Trend tests reveal that the annual and seasonal mean maximum and minimum temperature trend is characterized by a positive trend and that the strongest trend is found in the winter mean minimum in the Yangtze. However, the observed significant trend on the upper Yangtze reaches is less than that found on the middle and lower Yangtze reaches and for the mean maximum is much less than that of the mean minimum. From the basin-wide point of view, significant increasing trends are observed in 1-day extreme temperature in summer and winter minimum, but there is no significant trend for 1-day maximum temperature. Moreover, the number of cold days ≤065°C and ≤1065°C shows significant decrease, while the number of hot days (daily value ≥3565°C) shows only a minor decrease. The upward trends found in the winter minimum temperature in both the mean and the extreme value provide evidence of the warming-up of winter and of the weakening of temperature extremes in the Yangtze in last few decades.The monsoon climate implies that precipitation amount peaks in summer as does the occurrence of heavy rainfall events. While the trend test has revealed a significant trend in summer rainfall, no statistically significant change was observed in heavy rain intensity. The 1-day, 3-day and 7-day extremes show only a minor increase from a basin-wide point of view. However, a significant positive trend was found for the number of rainstorm days (daily rainfall ≥5065mm). The increase of rainstorm frequency, rather than intensity, on the middle and lower reaches contributes most to the positive trend in summer precipitation in the Yangtze.
|
| [1] |
Threshold limit values for chemical substances and physical agents and biological exposure indices . |
| [2] |
Recent trends in Tuscany (Italy) summer temperature and indices of extremes .https://doi.org/10.1002/joc.1673 URL [本文引用: 1] 摘要
Abstract In the past few decades, many studies showed a significant worldwide warming, and consequently, changes in frequency and persistence of extreme high-temperature events were observed. In order to analyse summer Tuscany (Italy) patterns of climate change during the period 1955–2004, indices of temperature and of extreme events were investigated for evidence of trend and change in inter-annual variability by using data of 40 weather stations. Least square regression analysis and Theil-Sen nonparametric regression were applied for evidence of trends. The Mann–Kendall test was applied to each time series to look for statistically significant trends. The results showed a general increase in minimum and maximum temperatures and extreme temperature events. Maximum temperature increase (+0.44 °C/decade) was slightly greater than minimum temperature (+0.38 °C/decade) and consequently, an increase in summer daily temperature range (DTR) was noted (+0.06 °C/decade). Inter-annual summer climate variability showed an increasing trend in the whole region, especially in regard to extreme event occurrences while a small decreasing trend concerning diurnal temperature range was observed. Copyright 08 2008 Royal Meteorological Society
|
| [28] |
An abrupt increase in the summer high temperature extreme days across China in the mid-1990s .https://doi.org/10.1007/s00376-010-0080-6 URL Magsci 摘要
Based on the daily maximum surface air temperature records from an updated homogenized temperature dataset for 549 Chinese stations during 1960-2008, we reveal that there is an abrupt increase in the number of days with high temperature extremes (HTEs, an HTE day is defined when the maximum temperature exceeds the 95th percentile of the daily maximum temperature distributions) across China in the mid-1990s. Before this regime shift, the average number of HTE days is about 2.9 d yr(-1) during the period from the 1970s to the early 1990s, while it rocketed to about 7.2 d yr(-1) after the mid-1990s. We show that the significant HTE day increase occurs uniformly across the whole of China after the regime shift. The observational evidence raises the possibility that this change in HTE days is associated with global-scale warming as well as circulation adjustment. Possible causes for the abrupt change in the HTE days are discussed, and the circulation adjustment is suggested to play a crucial role in the increase in HTE days in this region.
|
| [29] |
Changes in daily climate extremes in China and their connection to the large scale atmospheric circulation during 1961-2003 .https://doi.org/10.1007/s00382-009-0735-0 URL Magsci 摘要
Based on daily maximum and minimum surface air temperature and precipitation records at 303 meteorological stations in China, the spatial and temporal distributions of indices of climate extremes are analyzed during 1961-2003. Twelve indices of extreme temperature and six of extreme precipitation are studied. Temperature extremes have high correlations with the annual mean temperature, which shows a significant warming of 0.27A degrees C/decade, indicating that changes in temperature extremes reflect the consistent warming. Stations in northeastern, northern, northwestern China have larger trend magnitudes, which are accordance with the more rapid mean warming in these regions. Countrywide, the mean trends for cold days and cold nights have decreased by -0.47 and -2.06 days/decade respectively, and warm days and warm nights have increased by 0.62 and 1.75 days/decade, respectively. Over the same period, the number of frost days shows a statistically significant decreasing trend of -3.37 days/decade. The length of the growing season and the number of summer days exhibit significant increasing trends at rates of 3.04 and 1.18 days/decade, respectively. The diurnal temperature range has decreased by -0.18A degrees C/decade. Both the annual extreme lowest and highest temperatures exhibit significant warming trends, the former warming faster than the latter. For precipitation indices, regional annual total precipitation shows an increasing trend and most other precipitation indices are strongly correlated with annual total precipitation. Average wet day precipitation, maximum 1-day and 5-day precipitation, and heavy precipitation days show increasing trends, but only the last is statistically significant. A decreasing trend is found for consecutive dry days. For all precipitation indices, stations in the Yangtze River basin, southeastern and northwestern China have the largest positive trend magnitudes, while stations in the Yellow River basin and in northern China have the largest negative magnitudes. This is inconsistent with changes of water vapor flux calculated from NCEP/NCAR reanalysis. Large scale atmospheric circulation changes derived from NCEP/NCAR reanalysis grids show that a strengthening anticyclonic circulation, increasing geopotential height and rapid warming over the Eurasian continent have contributed to the changes in climate extremes in China.
|
| [30] |
Trends in temperature extremes during 1951-1999 in China .https://doi.org/10.1029/2003GL018004 URL 摘要
Based on the daily surface air temperature data from about 200 stations during 1951-1999 in China, changes in the frequency of some extreme temperature events were studied with a focus on trends. For China as a whole, the number of hot days (Tmax over 35 C) displays a slightly decreasing trend, while the number of frost days (Tmin below 0 C) exhibits a significant decreasing trend. Meanwhile, increasing trends were detected in the frequencies of warm days and warm nights. In addition, decreasing trends was found in the frequencies of cool days and even stronger decreasing trend was found in frequencies of cool nights in China.
|
| [31] |
Climate change or variability? The case of Yellow River as indicated by extreme maximum and minimum air temperature during 1960-2004 .https://doi.org/10.1007/s00704-007-0328-y URL [本文引用: 1] 摘要
The spatial and temporal variability of winter extreme low-temperature events and summer extreme high-temperature events was investigated using daily air temperature series (1960-2004) from 66 sites in the Yellow River basin, China, with the help of Mann endall trend test method. In this study an extreme temperature event is defined by exceeding or falling below various threshold values of daily maximum and daily minimum air temperature: 90th percentile, 95th percentile for the high-temperature events; 10th percentile and 5th percentile for the low-temperature events. The analysis results indicate that: 1) significant upward trend of frequency and intensity of the high-temperature events is found in the stations in the west and north part of the Yellow River basin, but trends in most stations in the middle and lower Yellow River basin are not significant at >95% confidence level; 2) almost the whole Yellow River basin is dominated by the significant downward trend of frequency of the cold events. Stations featured by the increasing winter minimum temperature are also more than those featured by changing summer maximum temperature; and 3) annual warming trend in the Yellow River basin mainly results from the increase in winter minimum temperature. Significant warming in the upper reach of the Yellow River will be likely to threaten the availability of the water resource in the whole basin, which should draw certain concerns from local policy-makers and water resource management agency in the region.
|
| [3] |
Characteristics of daily and extreme temperatures over Canada .
|
| [4] |
Trends in twentieth-century temperature extremes across the United States . |
| [32] |
Changes in hot days and heat waves in China during 1961-2007 .https://doi.org/10.1002/joc.1989 URL [本文引用: 1] 摘要
ased on the daily maximum temperature(DMT) records at 512 stations during 1961 -2007,the geographical patterns and temporal variations of hot days(HDs) and heat waves(HWs,including those persisting for 3-5 days and longer) over mainland China were studied.The HD(and hence HW) was defined in two ways,one by an absolute criterion,DMT 35 ,as applied in the nationwide meteorological agencies and another in a relative sense,DMT the 90th percentile threshold of a local daily temperature distribution around the day.Two centers of high frequencies(over 5 days per year) of the absolute HDs during June-September were found in the regions of Xinjiang and the mid-lower reaches of the Yangtze River.The highest frequencies of the absolute HWs were about 1.5 times per year in the Xinjiang region and to the south of the mid-lower reaches of the Yangtze River.The frequencies of the relative HWs were about 1-1.5 times per year in most of China.The HDs and HWs increased significantly during the studied period in most of China,especially over the southeastern coast and northern China(by over 4 days per decade for relative HDs and 0.4 times per decade for relative HWs),but decreased significantly at some stations in the lower reaches of the Yellow River.Over most of China except northwestern China,the frequency of HDs was high during the 1960s-1970s,low in the 1980s,and high afterwards,with strong intcrannual variations.A remarkable increasing trend of HDs occurred after the 1990s in all regions.The changes in HDs and HWs were closely related to those in rain days and atmospheric circulation patterns at the interannual and interdecadal scales.Copyright ? 2009 Royal Meteorological Society
|
| [33] |
Trends in extremes of surface humidity, temperature, and summertime heat stress in China .[本文引用: 1] 摘要
In the past half century, the mean summertime temperature in China has increased, with nights warm ing more than days. Using surface station observations, we show that the frequency of extreme heat-stress events in China, caused by extremely hot and humid days as well as by heatwaves lasting for a few days, has increased over the period from 1951 to 1994. When humidity is high, hot weather can cause heat stress in humans. The increased heat-stress trend may pose a public health problem.
|
| [5] |
Climate extremes: Observations, modeling, and impacts . |
| [6] |
Impacts of extreme weather and climate on terrestrial biota . |
| [34] |
Quantification and assessment of heat and cold waves in Novi Sad, Northern Serbia .https://doi.org/10.1007/s00484-015-1012-z URL PMID: 26062816 [本文引用: 1] 摘要
Abstract Physiologically equivalent temperature (PET) has been applied to the analysis of heat and cold waves and human thermal conditions in Novi Sad, Serbia. A series of daily minimum and maximum air temperature, relative humidity, wind, and cloud cover was used to calculate PET for the investigated period 1949-2012. The heat and cold wave analysis was carried out on days with PET values exceeding defined thresholds. Additionally, the acclimatization approach was introduced to evaluate human adaptation to interannual thermal perception. Trend analysis has revealed the presence of increasing trend in summer PET anomalies, number of days above defined threshold, number of heat waves, and average duration of heat waves per year since 1981. Moreover, winter PET anomaly as well as the number of days below certain threshold and number of cold waves per year until 1980 was decreasing, but the decrease was not statistically significant. The highest number of heat waves during summer was registered in the last two decades, but also in the first decade of the investigated period. On the other hand, the number of cold waves during six decades is quite similar and the differences are very small.
|
| [35] |
Human-biometeorological assessment of heat waves in Athens .https://doi.org/10.1007/s00704-010-0379-3 URL [本文引用: 1] 摘要
The goal of this study is the analysis of heat waves and their impact on humans, using human biometeorological indices, which are based on the energy balance of the human body. The implications for humans are not only described through the intensity of the heat waves, but also through their duration over consecutive days. Both intensity and duration were analyzed for the Greater Athens Area during the period 1955 to 2001. The analysis was carried out using the daily physiologically equivalent temperature and the daily minimum air temperature. Based on these two parameters, the results showed an increase in the average duration of heat waves. Furthermore, the use of the Gaussian filter revealed the intra-annual variation of heat stress conditions and their relevance to humans. The results could be used for the management of the negative consequences of heat waves in cities suffering from environmental pollution and also for climate impact studies.
|
| [7] |
国内外气候舒适度评价研究进展 .https://doi.org/10.11867/j.issn.1001-8166.2013.10.1119 URL [本文引用: 1] 摘要
开展气候舒适度评价对于科学指导旅游出行、客观评价城市人居环境等都具有重要的理论价值和实践意义,近年来随着旅游业的蓬勃发展和生活质量的普遍提高,气候舒适度评价愈发成为当前研究的热点问题。在回顾近百年来该领域研究成果的基础上,划分出气候舒适度评价的3个重要时期,介绍了每个时期具广泛影响的人体舒适度模型,论述了各种模型提出的时代背景、基本思想和适用条件。研究表明:气候舒适度评价由简单的经验模型向复杂的机理模型、由时空局限性模型向客观普适性模型发展,具有精细化、客观化的发展趋势;目前,国内气候舒适度评价研究中仍以经验模型的应用较为普遍,但在模型的选择上要注意其季节及地域适用性;发展具有普适性的气候舒适度评价模型、探索气候舒适度精细化评估技术是今后研究中亟待解决的问题;开展特色宜人气候评价有望拓展舒适气候评价研究的深度和范围,是今后重要的研究方向。
Advances in assessment of bioclimatic comfort conditions at home and abroad .https://doi.org/10.11867/j.issn.1001-8166.2013.10.1119 URL [本文引用: 1] 摘要
开展气候舒适度评价对于科学指导旅游出行、客观评价城市人居环境等都具有重要的理论价值和实践意义,近年来随着旅游业的蓬勃发展和生活质量的普遍提高,气候舒适度评价愈发成为当前研究的热点问题。在回顾近百年来该领域研究成果的基础上,划分出气候舒适度评价的3个重要时期,介绍了每个时期具广泛影响的人体舒适度模型,论述了各种模型提出的时代背景、基本思想和适用条件。研究表明:气候舒适度评价由简单的经验模型向复杂的机理模型、由时空局限性模型向客观普适性模型发展,具有精细化、客观化的发展趋势;目前,国内气候舒适度评价研究中仍以经验模型的应用较为普遍,但在模型的选择上要注意其季节及地域适用性;发展具有普适性的气候舒适度评价模型、探索气候舒适度精细化评估技术是今后研究中亟待解决的问题;开展特色宜人气候评价有望拓展舒适气候评价研究的深度和范围,是今后重要的研究方向。
|
| [36] |
中国大陆1961-2010年间气候舒适期的空间格局及其演变 .https://doi.org/10.11821/dlyj201611005 URL Magsci [本文引用: 1] 摘要
<p>气候舒适期作为气候舒适度/人体舒适度评价的一种时间标尺,对建筑设计、人体健康和旅游发展等意义深远。以“月”界定气候舒适期的传统研究因时间粒度较大,不利于全球变化下区域间横向和区域内纵向的比较和解析。根据中国大陆775个基本(基准)气象站点1961-2010年间的逐日气象数据,利用温湿指数(THI)和风效指数(WEI)的组合模型策略对其“舒适”分级标准进行改进,在“天气舒适日数累加”这一以“天”为粒度的气候舒适期界定下,对中国大陆近50年来气候舒适期的空间格局及其演变开展分析。研究给出了中国大陆的年均气候舒适期数值及其季节分配,揭示了年均气候舒适期的空间格局及其季节性差异,探讨了50年来气候舒适期的空间演变及其季节性特点,为全球变化的区域响应提供一种有关人居环境建设和人类活动适应的基础认识和科学依据。</p>
Spatial patterns and evolving characteristics of climate comfortable period in the mainland of China: 1961-2010 .https://doi.org/10.11821/dlyj201611005 URL Magsci [本文引用: 1] 摘要
<p>气候舒适期作为气候舒适度/人体舒适度评价的一种时间标尺,对建筑设计、人体健康和旅游发展等意义深远。以“月”界定气候舒适期的传统研究因时间粒度较大,不利于全球变化下区域间横向和区域内纵向的比较和解析。根据中国大陆775个基本(基准)气象站点1961-2010年间的逐日气象数据,利用温湿指数(THI)和风效指数(WEI)的组合模型策略对其“舒适”分级标准进行改进,在“天气舒适日数累加”这一以“天”为粒度的气候舒适期界定下,对中国大陆近50年来气候舒适期的空间格局及其演变开展分析。研究给出了中国大陆的年均气候舒适期数值及其季节分配,揭示了年均气候舒适期的空间格局及其季节性差异,探讨了50年来气候舒适期的空间演变及其季节性特点,为全球变化的区域响应提供一种有关人居环境建设和人类活动适应的基础认识和科学依据。</p>
|
| [8] |
Determining lines of equal comfort . |
| [9] |
A new concept of cooling degree days . |
| [37] |
中国东部沿海沿边城市旅游气候舒适度评价 .https://doi.org/10.11820/dlkxjz.2009.05.009 URL Magsci 摘要
<p>在温湿指数、风寒指数和着衣指数测定的基础上,构建了一个新的综合气候舒适度评价模型,该模型具有可比较和可加和等特点。运用新的模型,分析了我国东部沿海26个热点城市气候舒适度,划分出适宜于旅游活动的等级和时段分布,并对气候舒适度的南北变化进行了分析。依据最适期的年内分布将其划分为3种旅游气候类型:夏适型气候以哈尔滨为代表,春秋适宜型气候以北京和南京为代表,冬适型气候以海口为代表。从气候舒适度指数的南北差异来看,夏季气候舒适度指数随纬度升高而增大,北方具有更高的旅游气候舒适性;冬季气候舒适度随纬度降低而升高,南方具有更高的旅游气候舒适性。调查了4个代表城市的入境旅游客流量年内变化,揭示了入境客流量年内变化和南北差异,划分出旅游旺季、旅游平季和旅游淡季,其中哈尔滨客流量年内变化呈“W”形,北京和南京的客流量年内变化呈“M”形,海口的客流量年内变化上“凹”弧形。在客流量月指数与气候舒适度指数比较的基础上,通过对特殊因子的数值化,采用虚拟变量的回归分析方法,建立了入境旅游客流量月指数模拟模型。</p>
Evaluation of tourism climate comfortableness of coastal cities in the eastern China .https://doi.org/10.11820/dlkxjz.2009.05.009 URL Magsci 摘要
<p>在温湿指数、风寒指数和着衣指数测定的基础上,构建了一个新的综合气候舒适度评价模型,该模型具有可比较和可加和等特点。运用新的模型,分析了我国东部沿海26个热点城市气候舒适度,划分出适宜于旅游活动的等级和时段分布,并对气候舒适度的南北变化进行了分析。依据最适期的年内分布将其划分为3种旅游气候类型:夏适型气候以哈尔滨为代表,春秋适宜型气候以北京和南京为代表,冬适型气候以海口为代表。从气候舒适度指数的南北差异来看,夏季气候舒适度指数随纬度升高而增大,北方具有更高的旅游气候舒适性;冬季气候舒适度随纬度降低而升高,南方具有更高的旅游气候舒适性。调查了4个代表城市的入境旅游客流量年内变化,揭示了入境客流量年内变化和南北差异,划分出旅游旺季、旅游平季和旅游淡季,其中哈尔滨客流量年内变化呈“W”形,北京和南京的客流量年内变化呈“M”形,海口的客流量年内变化上“凹”弧形。在客流量月指数与气候舒适度指数比较的基础上,通过对特殊因子的数值化,采用虚拟变量的回归分析方法,建立了入境旅游客流量月指数模拟模型。</p>
|
| [10] |
Measurements of dry atmospheric cooling in subfreezing temperatures .https://doi.org/10.1580/1080-6032(1999)010[0176:FODACI]2.3.CO;2 URL PMID: 10560314 [本文引用: 1] 摘要
Please refer to the American Philosophical Society , Vol 89, 1, April, 1945 for a copy of this article.
|
| [11] |
UTCI-Why another thermal index? .https://doi.org/10.1007/s00484-011-0513-7 Magsci [本文引用: 3] 摘要
Existing procedures for the assessment of the thermal environment in the fields of public weather services, public health systems, precautionary planning, urban design, tourism and recreation and climate impact research exhibit significant shortcomings. This is most evident for simple (mostly two-parameter) indices, when comparing them to complete heat budget models developed since the 1960s. ISB Commission 6 took up the idea of developing a Universal Thermal Climate Index (UTCI) based on the most advanced multi-node model of thermoregulation representing progress in science within the last three to four decades, both in thermo-physiological and heat exchange theory. Creating the essential research synergies for the development of UTCI required pooling the resources of multidisciplinary experts in the fields of thermal physiology, mathematical modelling, occupational medicine, meteorological data handling (in particular radiation modelling) and application development in a network. It was possible to extend the expertise of ISB Commission 6 substantially by COST (a European programme promoting Cooperation in Science and Technology) Action 730 so that finally over 45 scientists from 23 countries (Australia, Canada, Israel, several Europe countries, New Zealand, and the United States) worked together. The work was performed under the umbrella of the WMO Commission on Climatology (CCl). After extensive evaluations, Fiala's multi-node human physiology and thermal comfort model (FPC) was adopted for this study. The model was validated extensively, applying as yet unused data from other research groups, and extended for the purposes of the project. This model was coupled with a state-of-the-art clothing model taking into consideration behavioural adaptation of clothing insulation by the general urban population in response to actual environmental temperature. UTCI was then derived conceptually as an equivalent temperature (ET). Thus, for any combination of air temperature, wind, radiation, and humidity (stress), UTCI is defined as the isothermal air temperature of the reference condition that would elicit the same dynamic response (strain) of the physiological model. As UTCI is based on contemporary science its use will standardise applications in the major fields of human biometeorology, thus making research results comparable and physiologically relevant.
|
| [38] |
中国重点旅游城市气候舒适度及其变化趋势 .https://doi.org/10.11821/dlyj201512003 URL [本文引用: 1] 摘要
基于地面气象观测资料和通用热气候指数,研究中国12个重点旅游城市的气候舒适度及其1960-2013年间的变化趋势。结果显示:1依据气候舒适度年内分布特征,所有城市可分为5种类型,即春、秋适型,春、秋、冬适型,春、夏、秋适型,冬适型和全年不适型。2 1960-2013年,年均通用热气候指数基本均显著增加;哈尔滨、大连增幅最大,分别达1.73oC/10a、1.44oC/10a。月均通用热气候指数也一致增加,且增幅冬季大、夏季小。3从年尺度看,各城市"冷不舒适"频率降低,"热不舒适"频率增加。哈尔滨、乌鲁木齐、北京、拉萨、西安、上海、三亚年"舒适"频率增加,尤其拉萨增幅高达8.9 d/10a;呼和浩特、大连、昆明、重庆、广州年"舒适"频率降低。4从月尺度看,6-9月的"舒适"频率整体降低;11-2月的"舒适"频率整体增加;3-5月及10月表现为纬度或海拔较高城市的"舒适"频率增加,其余城市降低。
Thermal comfort and its trend in key tourism cities of China .https://doi.org/10.11821/dlyj201512003 URL [本文引用: 1] 摘要
基于地面气象观测资料和通用热气候指数,研究中国12个重点旅游城市的气候舒适度及其1960-2013年间的变化趋势。结果显示:1依据气候舒适度年内分布特征,所有城市可分为5种类型,即春、秋适型,春、秋、冬适型,春、夏、秋适型,冬适型和全年不适型。2 1960-2013年,年均通用热气候指数基本均显著增加;哈尔滨、大连增幅最大,分别达1.73oC/10a、1.44oC/10a。月均通用热气候指数也一致增加,且增幅冬季大、夏季小。3从年尺度看,各城市"冷不舒适"频率降低,"热不舒适"频率增加。哈尔滨、乌鲁木齐、北京、拉萨、西安、上海、三亚年"舒适"频率增加,尤其拉萨增幅高达8.9 d/10a;呼和浩特、大连、昆明、重庆、广州年"舒适"频率降低。4从月尺度看,6-9月的"舒适"频率整体降低;11-2月的"舒适"频率整体增加;3-5月及10月表现为纬度或海拔较高城市的"舒适"频率增加,其余城市降低。
|
| [12] |
Human Thermal Environments: The Effects of Hot, Moderate, and Cold Environments on Human Health, Comfort and Performance . |
| [13] |
A standard predictive index of human response to the thermal environment .
Temperature and sensory indicates of human response to the thermal environment are often expressed in terms of the known response in a controlled laboratory environment, as a standard. The three rational indices of this type to be considered are ASHRAE's Standard Effective Temperature (SET*) Index, defined as the equivalent dry bulb temperature of an isothermal environment at 50% RH in which a subject, while wearing clothing standardized for activity concerned, would have the same heat stress (skin temperature T/sub sk/) and thermo-regulatory strain (skin wettedness, w) as in the actual test environment; Fanger's Predicted Mean Vote (PMV) Index, defined in terms of the heat load that would be required to restore a state of ''Comfort'' and evaluated by his Comfort Equation; and Winslow's Skin Wettedness Index of ''Thermal Discomfort'' (DISC) defined in terms of the fraction of the body surface, wet with perspiration, required to regulate body temperature by evaporative cooling.
|
| [39] |
ERA-interim: New ECMWF reanalysis products from 1989 onwards . |
| [40] |
Towards a climate data assimilation system: Status up data of ERA-Interim . |
| [14] |
The perceived temperature: A versatile index for the assessment of the human thermal environment. Part A: Scientific basics .https://doi.org/10.1007/s00484-011-0409-6 URL PMID: 21336880 Magsci [本文引用: 1] 摘要
The Perceived Temperature (PT) is an equivalent temperature based on a complete heat budget model of the human body. It has proved its suitability for numerous applications across a wide variety of scales from micro to global and is successfully used both in daily forecasts and climatological studies. PT is designed for staying outdoors and is defined as the air temperature of a reference environment in which the thermal perception would be the same as in the actual environment. The calculation is performed for a reference subject with an internal heat production of 135 W m(-2) (who is walking at 4 km h(-1) on flat ground). In the reference environment, the mean radiant temperature equals the air temperature and wind velocity is reduced to a slight draught. The water vapour pressure remains unchanged. Under warm/humid conditions, however, it is implicitly related to a relative humidity of 50%. Clothing is adapted in order to achieve thermal comfort. If this is impossible, cold or heat stress will occur, respectively. The assessment of thermal perception by means of PT is based on Fanger's Predicted Mean Vote (PMV) together with additional model extensions taking account of stronger deviations from thermal neutrality. This is performed using a parameterisation based on a two-node model. In the cold, it allows the mean skin temperature to drop below the comfort value. In the heat, it assesses additionally the enthalpy of sweat-moistened skin and of wet clothes. PT has the advantages of being self-explanatory due to its deviation from air temperature and being-via PMV-directly linked to a thermo-physiologically-based scale of thermal perception that is widely used and has stood the test of time. This paper explains in detail the basic equations of the human heat budget and the coefficients of the parameterisations.
|
| [15] |
Experimental evaluation of standard effective temperature: A new biometeorological index of man's thermal discomfort .https://doi.org/10.1007/BF01450660 URL PMID: 4845140 [本文引用: 1] 摘要
A rationally derived temperature index (SET * ) which can be used as a biometeorological index of man's thermal discomfort has been developed by simple physical theory and has a valid physiological basis. The SET * index, when referred to a standard environment, has been tested experimentally as a measure of warm and cold discomfort for sedentary subjects under varying conditions of radiant heat and dry and wet bulb temperatures. The reference environment is common to one normally experienced in man's daily living while wearing 0.6 clo with an air movement of 0.25–0.3 m/s.
|
| [41] |
Variational bias correction in ERA-Interim . |
| [42] |
The ERA-Interim reanalysis: Configuration and performance of the data assimilation system .https://doi.org/10.1002/qj.828 URL [本文引用: 1] 摘要
ERA-Interim is the latest global atmospheric reanalysis produced by the European Centre for Medium-Range Weather Forecasts (ECMWF). The ERA-Interim project was conducted in part to prepare for a new atmospheric reanalysis to replace ERA-40, which will extend back to the early part of the twentieth century. This article describes the forecast model, data assimilation method, and input datasets used to produce ERA-Interim, and discusses the performance of the system. Special emphasis is placed on various difficulties encountered in the production of ERA-40, including the representation of the hydrological cycle, the quality of the stratospheric circulation, and the consistency in time of the reanalysed fields. We provide evidence for substantial improvements in each of these aspects. We also identify areas where further work is needed and describe opportunities and objectives for future reanalysis projects at ECMWF. Copyright 2011 Royal Meteorological Society
|
| [43] |
Application of UTCI in China from tourism perspective .https://doi.org/10.1007/s00704-016-1731-z URL [本文引用: 1] 摘要
This study uses ERA-Interim reanalysis data and the Universal Thermal Climate Index (UTCI) to investigate the spatial pattern of thermal bioclimatic conditions in China. Our results show that the annual UTCI increases with decreasing latitude throughout most of China. Areas that experience "no thermal stress" are located southeast of the line formed by the Yanshan Mountains, Taihang Mountains, the southern edge of the Loess Plateau, and the eastern edge of the Qinghai-Tibet Plateau, with an area of 312.83ekm. During spring and autumn, the UTCI distribution is similar to the annual distribution. During summer, areas with "no thermal stress" cover the largest area (563.55ekm), including northern and southwestern China; in contrast, during winter, areas with "no thermal stress" only occur south of the Nanling Mountains. The annual number of days with "no thermal stress" increases from north to south in central and eastern China, exceeding 200 days in the Sichuan Basin, the southeastern coastal regions and the Yungui Plateau. The minimum and maximum values occur on the Qinghai-Tibet Plateau ( 10 days) and the southern Yungui Plateau (>280 days). Seasonal analysis indicates that there are over 70 days with "no thermal stress" in the Sichuan Basin, the Yungui Plateau and the middle and lower reaches of the Yangtze River during spring and autumn, while there are more than 80 days in northern and southwestern China during summer and over 80 days in areas south of the Nanling Mountains during winter. The results of this study can be helpful for optimization of the tourism industry and tourism destinations development in China.
|

/
| 〈 |
|
〉 |