王婧 , 张百平, 张文杰
WANG Jing, ZHANG Baiping, ZHANG Wenjie
通讯作者:
收稿日期: 2017-03-2
修回日期: 2017-06-1
网络出版日期: 2017-08-10
版权声明: 2017 《地理研究》编辑部 《地理研究》编辑部
基金资助:
作者简介:
作者简介:王婧(1987- ),女,山西忻州人,博士研究生,主要研究方向为山地地理与GIS应用。E-mail: wangj.13b@igsnrr.ac.cn
展开
摘要
落基山脉作为北美最大的内陆山地,其山体效应对林线分布具有很大影响,导致林线海拔远高于周围内陆山体及其他海岸山地。然而,以往落基山脉山体效应研究多集中于定性研究,但是山体效应如何量化,如何根据落基山脉的地形气候条件构建区域山体效应的定量化模型,目前鲜有研究。通过分析台站处山体增温及量化落基山脉山体效应的影响因子,并计算最热月均温10 ℃等温线的海拔高度,来定量化地估算科罗拉多落基山脉山体效应值大小及其对林线分布的影响。结果表明:① 用山体增温值表示山体效应大小是合理且比较理想的指标。科罗拉多落基山脉增温显著,所有台站的增温均值为2.07 ℃,增温幅度为0.78~4.29 ℃。② 科罗拉多落基山脉山体效应的主要影响因素为山体基面高度和降水大陆度,二者与山体增温构建的线性拟合模型具有较高的解释能力,判定系数高达71.2%。③ 科罗拉多落基山脉不同纬度带山体内外最热月10 ℃等温线分布高度对比表明,山体内部理想林线高度均高于山体外部的理想林线分布,内外分布差异为400~700 m。定量分析科罗拉多落基山脉的山体效应模型,优化了区域尺度的山体效应模型精度,有助于深入认识山体效应及其对垂直带分布的影响。
关键词:
Abstract
Rocky Mountains is the Northern America's largest inland mountains. Its mass elevation effect (MEE) imposes substantial forcing on treeline altitude. As a result, its treeline elevation is much higher than other inland mountains and coastal mountains of the continent. However, most existing literatures on MEE are from a qualitative perspective. This study applied meteorological station records, NCAR/NCEP free air temperature and DEM data to calculate MEE-related temperature increases from inner to out of the Colorado Rocky Mountains (ΔT) and to quantify values of MEE factors, including latitude, mountain bass elevation (MBE), hydric continentality and surface openness. Thereby the magnitude of MEE was computed with ΔT and MEE factors. MEE's impacts on treeline distribution were estimated through isothermal line altitude of the warmest month 10℃ from inner to out of mountains of different ranges. Elevation of isothermal line was interpolated by MODIS land surface temperature data coupled with elevation and deduced temperature lapse rate. Results show that: (1) ΔT is an ideal indicator for MEE. ΔT at adopted stations ranges from 0.78 °C to 4.29°C, whereas mean value is 2.07 ℃. ΔT showed a descending trend from outer ranges toward inner ranges. The greatest ΔT occurred at the center ranges between 38°-39°N. (2) The resulted MEE model for the Colorado Rocky Mountains taking MBE and hydric continentality as independent variables has a high explanatory power of R2 of 71.2%. MBE had the most significant contribution to the model with 55.21%, whereas latitude and surface openness were eliminated. (3) The 10 ℃ isothermal line of the hottest month in the Colorado Rockies was higher in inner ranges than in outer ranges at all the three latitudes, with a difference of 400 m to 700 m. At 38°N and 39°N, differences of 10℃ isothermal line elevation between inner and outer ranges showed strong variation, whereas less at 40°N. This difference corresponds well to air temperature difference between the inner and outer mountain ranges. The findings suggest that MEE was crucial for driving treeline up to higher elevation in the Rocky Mountains. This study developed a quantitative model for the MEE of the Colorado Rocky Mountains and improved our understanding of MEE and its significance for treeline distribution.
Keywords:
落基山脉位于北美西部,是北半球除青藏高原外海拔最高的山地。其林线分布高度显著高于北半球同纬度的其他山脉。如在40°N,林线海拔的最高点位于落基山脉的前山区域(105.8°W、39.6°N),林线分布高度为3550 m;而在同纬度的辽宁白石砬子山,林线分布高度为1170 m,落基山脉林线高出同纬度白石砬子山2380 m。在43°N,林线海拔的最高点位于落基山脉的风河山脉(109.7°W、43.2°N),林线分布高度为3200 m;而在同纬度的日本YUUBARIDAKE山脉,林线分布高度仅为1250 m;在中国伊宁乌孙山,林线分布海拔只有2500 m。其中落基山脉作为北美最大的内陆山地,其林线分布从杰士伯国家公园的2100 m上升到克里斯托山的3800 m[1]。
造成林线高度分布出现这一地理差异的机理解释在全球范围内还没有统一的定论,但是在大部分地区林线分布与区域的热量状况有很强的相关性[2-4]。研究表明,北美林线分布的地理差异主要是由与大陆山体效应密切相关的水热状况决定的[5]。山体效应(mass elevation effect)是由隆起山体造成的垂直带界限如林线、雪线等在内陆的巨型山体或者山系中央比外围地区分布要高的现象。产生这种现象的原因是由于山体的热力效应所产生的山体内部比外部温度高的温度空间格局[6]。也就是说,落基山脉林线高度高于其他山脉是由于其庞大山体产生较为强烈的山体效应而导致山体内部温度高于其他山脉。相关的研究证实了这一分析,Humboldt发现落基山脉高原地区的温度高于同纬度孤立山峰和低地相同高度的温度[7]。
这种由于山体效应导致的温度升高进而造成林线高度抬升的现象在全球其他山脉也有发生,世界上很多高原、山体也存在较为强烈的山体效应,如青藏高原[8]、安第斯山 脉[9]。山体效应对于林线分布的结构和机理具有重要的解释能力,对山地垂直带格局有重要的控制作用。迄今为止关于山体效应的作用大多局限在“山体越大、山体效应越大”的定性描述之中。Shreve认为山体效应与山体基面高度有很大的关系,山体基面高度越高,则植被带分布的高度就越大[10]。韩芳等用山体基面高度作为山体效应的代用因子,建立了纳入山体效应的垂直带分布模型[11,12]。结果表明,山体效应在半球和大陆尺度上对林线高度分布具有巨大的影响,甚至超过纬度和大陆度成为第一影响因子。但遗憾的是,先前的定量化研究旨在分析山体效应对垂直带高度界限的具体贡献,所研究的范畴属于山体效应的间接定量化研究。而山体效应的直接定量化应该是从山体效应机理入手来定量化研究山体效应的作用及其影响因素,将山体效应因子与它们的总体效果联系起来进行山体效应的研究。而这方面的研究到目前为止鲜有涉及。
山体效应的实质是山体内部基面海拔比周围低地高而引起的热力效应,使山体内部气温比外围高,从而导致垂直带界线内部较外围高。因而,山体内外温差应该是表征山体效应大小比较理想的指标[13]。但是,影响山体内外温差的因素很多,涉及各种尺度的大气和地理要素,如纬度、山体基面高度、降水等。山体基面高度作为山体效应的重要影响因子在前面已有描述,在落基山脉的研究中也发现,山体基面高度对于植被分布及温度分布具有重要的影响[14,15],因此本文将山体基面高度作为落基山脉山体效应的首要考虑因子;同时,山体效应的影响需要结合落基山脉的地理气候条件,因其分布于北美西部内陆地区,气候为典型的大陆性气候,降水对于植被分布、山体内外温差也具有重要的影响[16,17]。此外,纬度、地形开阔度通过影响太阳辐射对山体内外温差也产生一定的作用。如何确定影响山体内外温差的因子,计算各因子对山体效应的贡献是山体效应定量化研究的重点。
基于此,以科罗拉多落基山脉作为研究区域,分析科罗拉多落基山脉山体内外温差及山体效应的影响因子,构建科罗拉多落基山脉的山体效应定量化模型。在此基础上,进一步分析山体效应对于林线分布的影响。进而提高区域尺度上山体效应模型的精度,优化山体效应定量化模型,为山体效应定量化研究做出贡献。同时,山体效应的定量化也对落基山脉植被及垂直带分布的解释提供了新的途径。
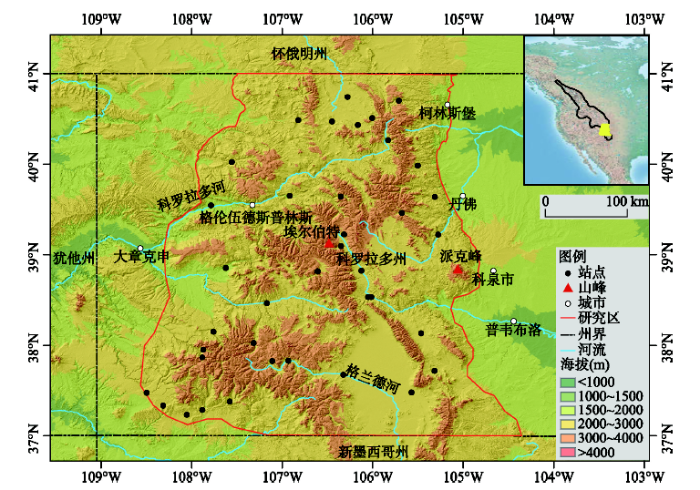
科罗拉多落基山脉位于美国西部,落基山脉的东侧,研究区范围为37°N~41°N、104°30′W~108°40′W,平均海拔2712 m;落基山脉最大高度的中段贯穿其中,许多山峰海拔超过4000 m,其中埃尔伯特峰高达4399 m,是落基山脉的最高峰(图1)。地貌结构复杂,气候类型为北美热带北缘气候。
所用的气温及降水数据为科罗拉多落基山脉1981-2010年38个气象台站(表1)的数据,来自美国国家海洋和大气管理局(NOAA)国家环境信息中心(NCEI)发布的Annual Climatological Summaries数据(http://gis.ncdc.noaa.gov/map/viewer/#app=clim&cfg=cdo&theme=annual&layers=1&node=gis&extent=-139.2:12.7:-50.4:57.8)。
表1 台站信息列表
Tab. 1 Attributes of the meteorological stations
| 台站点 | 纬度(°N) | 经度(°E) | 高度(m) | 7月均温(℃) | 年降水(mm) |
|---|---|---|---|---|---|
| VALLECITO DAM | 37.38 | -107.58 | 2330 | 17.50 | 706.58 |
| RIDGWAY | 38.15 | -107.76 | 2144 | 17.79 | 424.11 |
| STEAMBOAT SPRINGS | 40.49 | -106.82 | 2093 | 17.42 | 639.00 |
| AMES | 37.87 | -107.88 | 2652 | 14.83 | 765.17 |
| RED WING 1 WSW | 37.72 | -105.32 | 2408 | 16.42 | 326.96 |
| EAGLE CO AIRPORT | 39.65 | -106.92 | 1980 | 18.90 | 298.10 |
| NEDERLAND 2 NNE | 39.98 | -105.50 | 2512 | 15.40 | 493.47 |
| EVERGREEN | 39.64 | -105.32 | 2129 | 18.08 | 477.18 |
| VAIL | 39.64 | -106.35 | 2531 | 15.25 | 579.70 |
| RIFLE | 39.54 | -107.79 | 1657 | 22.31 | 335.07 |
| CHEESMAN | 39.22 | -105.28 | 2097 | 18.57 | 431.88 |
| DURANGO | 37.28 | -107.88 | 2012 | 20.49 | 532.35 |
| MARVINE | 40.02 | -107.56 | 2195 | 16.75 | 593.09 |
| GOULD 4 SE S F S P | 40.51 | -106.01 | 2743 | 13.38 | 582.61 |
| PAONIA 1 SW | 38.85 | -107.62 | 1700 | 23.40 | 383.33 |
| SPICER | 40.47 | -106.45 | 2556 | 14.59 | 371.39 |
| TELLURIDE 4 WNW | 37.95 | -107.87 | 2643 | 15.49 | 598.55 |
| RAND | 40.43 | -106.17 | 2630 | 13.36 | 393.63 |
| WESTCLIFFE | 38.13 | -105.47 | 2396 | 17.05 | 372.87 |
| FORT LEWIS | 37.23 | -108.05 | 2329 | 18.69 | 468.84 |
| MANCOS 1 SW | 37.34 | -108.32 | 2102 | 20.14 | 417.75 |
| DEL NORTE 2 E | 37.67 | -106.32 | 2397 | 17.36 | 271.34 |
| WALDEN | 40.74 | -106.28 | 2456 | 15.33 | 311.52 |
| GRAND LAKE 1 NW | 40.27 | -105.83 | 2658 | 14.76 | 511.26 |
| DOLORES | 37.48 | -108.50 | 2118 | 20.17 | 496.02 |
| GRANT | 39.46 | -105.68 | 2644 | 15.37 | 396.68 |
| BLANCA 4 NW | 37.48 | -105.57 | 2350 | 18.47 | 241.76 |
| SANTA MARIA RESERVOIR | 37.82 | -107.11 | 2953 | 13.35 | 385.91 |
| TWIN LAKES RESERVOIR | 39.09 | -106.35 | 2806 | 14.72 | 264.68 |
| RUSTIC 9 WSW | 40.70 | -105.71 | 2347 | 17.49 | 316.73 |
| BLUE MESA LAKE | 38.47 | -107.17 | 2307 | 18.41 | 242.97 |
| LAKE CITY | 38.02 | -107.31 | 2642 | 16.34 | 378.47 |
| SALIDA | 38.53 | -106.02 | 2182 | 19.29 | 225.57 |
| CREEDE WATER TREATMENT | 37.83 | -106.93 | 2629 | 15.63 | 277.70 |
| LEADVILLE LAKE CO AIRPORT | 39.22 | -106.32 | 3029 | 12.92 | 313.60 |
| TAYLOR PARK | 38.82 | -106.61 | 2798 | 13.37 | 462.38 |
| BUENA VISTA 2 S | 38.82 | -106.13 | 2422 | 18.39 | 265.72 |
| SALIDA 3 W | 38.53 | -106.05 | 2282 | 19.67 | 153.92 |
MODIS地表温度数据采用Modis Terra全球月平均地表温度/辐射率数据(https://lpdaac.usgs.gov/lpdaac/products/modis_products_table),数据产品为Terra Monthly Land Surface Temperature & Emissivity (MOD11C3)。将MODIS地表温度数据与台站数据建立相关性方程,进而分析研究区不同纬度带的大气温度分布变化。
大气温度数据采用NCAR/NCEP提供的再分析数据集(http://www.esrl.noaa.gov/psd/data/gridded/data.ncep.reanalysis.pressure.html)。该数据提供垂直方向上17个气压层的月均温数据,但是由于气压在250 hPa时已经达到对流层层顶,而平流层温度垂直递减率与对流层不同,因此本研究仅选择对流层的九个气压面进行提取,得到气压面分别为1000 hPa、925 hPa、850 hPa、700 hPa、600 hPa、500 hPa、400 hPa、300 hPa、250 hPa的30年(1981-2010年)大气月均温数据。
山体基面高度选用空间分辨率为90 m的SRTM DEM的数据集(http://srtm.csi.cgiar.org/SELECTION/inputCoord.asp),并用山体基面高度数字识别的方法进行提取和估算[18,19]。该方法将山体基面高度分区识别,以大型山脉的走势为分区边界,以分区内相对起伏度较小、坡度较平缓的部分为基面,以基面的平均海拔为山体基面高度值。
降水大陆度数据采用Gams提出的降水大陆度指标来计算,在相对降水量的基础之上,加入了“海拔”信息,利用“海拔与区域年降水量的比值”构建综合的降水大陆度指数[20]。研究表明,这一指标与山区森林分布格局尤其是林线处森林物种分布有很大关系[21]。计算公式为:
式中:A为海拔;P为降水。当区域的海拔高度(m)与年降水总量(mm)相等时,Hygric continentality=45°;当
地形开阔度采用孙娴等关于山区地形开阔度分布模型的研究方法,全面考虑坡地自身遮蔽和周围地形相互遮蔽的影响[22,23]。对于起伏地形中任一坡元,在2π的方位内进行数值积分,结合空间分辨率为90 m的SRTM DEM的数据进行计算得到。
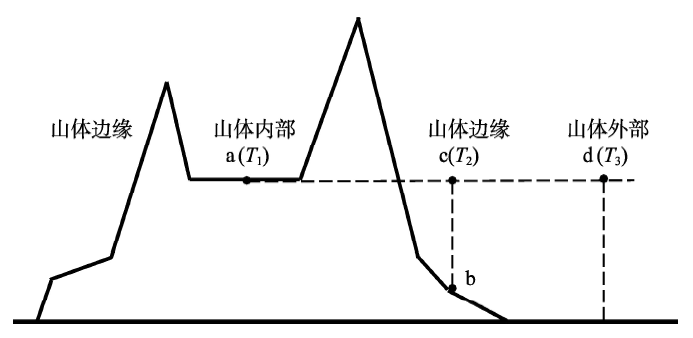
山体效应实质上是山体内部的加热作用,通过山体内部近地面大气温度与山体边缘同高度大气温度之差来表示。由于山区地形复杂,气候变化强烈,边缘地区选点存在诸多不确定性,而且边缘地区跟外部自由大气交流密切,而山区外部自由大气的温度水平变化较小,因此,在实际计算中可以选择外部的大气温度来代替山区边缘的温度。为了保证计算的准确性,大气温度应选择在与边缘地区距离较近、地表未隆起的地区,选择与内部同高度处的大气温度作为山区外部的温度。则山体效应可以表示为山地内部台站温度与外部同纬度同高度处的自由大气温度差[10]。依据张百平等提出的山体效应概念模型(图2)[13],a点位于山体内部,其近地面大气温度为T1,b点位于山体边缘,c点是b点上空与a点处于同一高度的点,c点处的温度即b点上空的自由大气温度,记为T2,d点为山体外部与a点同高度处的点,其所在位置没有山地隆起,处于自由大气中,温度为T3。根据上述对山体效应的分析,山体效应表示为:
山体内部近地面温度即为山区台站的实测温度数据。自由大气的温度计算采用Pepin计算全球自由大气温度时采用的方法[24]。在详细分析自由大气温度各种计算方法的基础上,提出一种比较精确的自由大气的计算方法,即通过NCEP再分析数据提取点所处的位置。由于选点并不一定恰好落在2.5°的格网点上,因此再分析数据在垂直插值之后需进行水平方向的插值,根据每个气压层月均温温度以及各个气压层的高度分别进行垂直和水平方向插值得到自由大气温度。在计算中,先进行垂直方向插值。选择距站点最近的四个格网点,采用站点海拔高度最邻近的两个气压层,分别对每个格网点进行线性插值得到这四个点在站点海拔高度的温度。然后,在水平方向上通过站点位置以这四个点的值进行双线性插值,得到最终的插值温度。
山体效应定量化的目标是建立山体效应大小与其影响因子之间的定量化关系模型。以纬度、山体基面高度、降水大陆度、地形开阔度为自变量,以7月均温温差为因变量,选用逐步回归方法进行构建落基山脉的山体效应定量化模型。
在山体效应的定量化研究中,加入山体效应的林线高度分布模型具有较高的拟合精度,比传统的经纬度模型对林线分布高度具有更强的解释能力[10]。可见山体效应对山地垂直带分布具有重要影响。已有青藏高原的相关研究表明,由于山体增温作用的影响,高原内部气温和生长季长度高于周围地区,因此其内部林线比外围地区高500~1000 m[25]。本文以林线的度量指标最热月10 ℃等温线为基础[2,25,26],研究科罗拉多落基山脉不同纬度(38°N、39°N、40°N)山体效应对林线分布的影响。
最热月10 ℃等温线分布高度的剖面数据根据MODIS地表温度数据进行反演。首先,基于MODIS地表温度数据提取科罗拉多落基山脉近地表温度,建立地表温度与台站气温数据的回归方程对提取数据进行修正,获得校正后的温度数据。第二,在ArcGIS的支持下,根据校正后的科罗拉多落基山脉温度数据并结合DEM获得38°N、39°N和40°N剖面科罗拉多落基山脉山体内外最热月10 ℃等温线(即理想林线)的分布高度。计算公式为:
式中:H为不同纬度剖面最热月10 ℃等温线的分布高度;H0为地形高度;T0为校正后的剖面点最热月温度;∂为气温垂直递减率,本文采用平均气温垂直递减率0.6 ℃/100 m[8]。
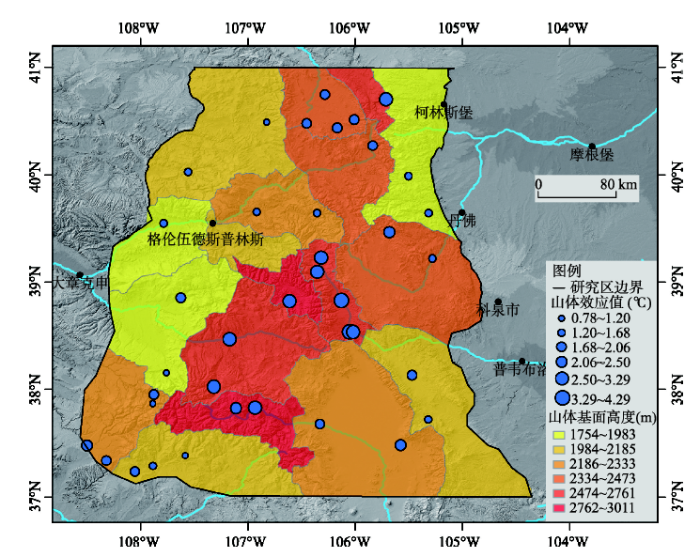
通过计算,得到科罗拉多落基山脉7月份不同台站处山体效应的增温幅度(图3)。由图可知,38个站点处山体近地面温度均大于山体外部同纬度同高度处的自由大气温度,增温幅度范围为0.78 °C~4.29 °C,表明科罗拉多落基山脉存在着强烈的山体效应。由山体增温的空间分布特征可以看出,温差由山体内部向山体外围呈现逐步降低的趋势,其中,在38°N~39°N的科罗拉多落基山脉山体中心区域,山体增温最为强烈,增温最大值为4.29 °C。
相关分析结果表明(表2),科罗拉多落基山脉山体基面高度和降水大陆度与山体内外温差之间存在着显著的线性相关关系。山体基面高度越高,山体内外温差越大,相关系数高达0.775。山体内外温差与降水大陆度也呈现较为强烈的正相关关系,相关系数达到0.737。纬度及地形开阔度与山体内外温差之间没有显著的线性关系。同时,相关性分析结果表明,山体基面高度和降水大陆度之间存在着一定的相关关系,但二者是属性互不相关的独立变量,二者出现一定的统计相关性可能与科罗拉多落基山脉独特的地势条件有关。科罗拉多落基山脉中心包围着大型的山脉,海拔和基面高度都很高,同时山脉中心降水量较少,导致了降水大陆度相对较大[6]。
表2 科罗拉多落基山脉山体效应定量化模型自变量和因变量相关性分析
Tab. 2 Correlation analysis of variables of MEE model of Colorado Rocky Mountains
| 相关系数类型及尾部检验分布 | 纬度(°) | 基面高度(m) | 降水大陆度(°) | 地形开阔度 | 山体内外温差(℃) | |
|---|---|---|---|---|---|---|
| 纬度 | Pearson Correlation | 1 | 0.025 | -0.005 | -0.189 | -0.064 |
| 显著性检验双尾概率P值 | 0.881 | 0.976 | 0.257 | 0.701 | ||
| 基面高度 | Pearson Correlation | 1 | 0.609** | -0.227 | 0.775** | |
| 显著性检验双尾概率P值 | 0.000 | 0.170 | 0.000 | |||
| 降水大陆度 | Pearson Correlation | 1 | -0.041 | 0.737** | ||
| 显著性检验双尾概率P值 | 0.805 | 0.000 | ||||
| 地形开阔度 | Pearson Correlation | 1 | -0.234 | |||
| 显著性检验双尾概率P值 | 0.157 | |||||
| 山体内外温差 | Pearson Correlation | 1 | ||||
| 显著性检验双尾概率P值 |
最优回归模型分析结果如表3所示,该模型具有良好的拟合效果,判定系数高达0.712。模型的F统计量观察值为43.275,概率P值小于0.001,在显著性水平为0.005的情形下,可以认为山体效应与山体基面高度、降水大陆度之间有显著的关系。
表3 科罗拉多落基山山体效应定量化模型
Tab. 3 Model selection for MEE model of Rocky Mountains
| R2 | F | 非标准化系数(B) | 标准化系数(Beta) | 贡献率 | t | Sig. | |
|---|---|---|---|---|---|---|---|
| 常量 | 0.712 | 43.275 (P=0.000) | -8.273 | -4.918 | 0.000 | ||
| 纬度 | 剔除 | 剔除 | 剔除 | -1.067 | 0.294 | ||
| 基面高度 | 0.001 | 0.519 | 55.21 | 4.536 | 0.000 | ||
| 降水大陆度 | 0.92 | 0.421 | 44.79 | 3.680 | 0.001 | ||
| 地形开阔度 | 剔除 | 剔除 | 剔除 | -1.316 | 0.197 |
在最优回归模型的构建中,山体基面高度与山体内外温差的t检验概率P值小于0.001,降水大陆度与山体内外温差的t检验概率P值为0.001,在0.005的显著性水平上,可以认为二者与山体效应关系显著。若假设山体基面高度、降水大陆度对山体效应影响之和为100%,根据它们的标准回归系数,对山体效应的贡献率分别为55.21%、44.79%。山体基面高度对山体效应的贡献率最大,降水大陆度次之,纬度和地形开阔度没有通过逐步回归的双向检验,被剔除。
将各自变量的回归系数和常数项带入公式得到科罗拉多落基山脉山体效应的拟合模型为:
式中:
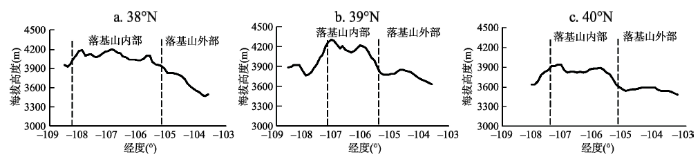
为对比科罗拉多落基山脉山体内外温差对林线的影响,以林线的生态指示因子,即最热月10 ℃等温线,代表林线的分布趋势,分析不同纬度带(38°N、39°N和40°N)山体增温对山体内外林线分布的影响。图4表明,在三个纬度剖面,最热月10 ℃等温线的分布高度在山体内部均高于山体外围。在38°N,最热月10 ℃等温线在山体内部分布高度为4000~4200 m,在山体外部最低仅为3500 m,山体内外的最大高度差异达700 m;在39°N,山体外部最热月10 ℃等温线分布高度从3600 m抬升到山体内部的4000~4300 m,抬升幅度达700 m;在40°N,内部的分布高度在3700~4000 m,山体外部的分布高度主要集中在3600 m附近,抬升幅度最高达400 m。
图4 科罗拉多落基山脉不同纬度带山体内外10 ℃等温线分布高度图
Fig. 4 10 ℃ isotherm distribution in Colorado Rocky Mountains at different latitudes
由上述分析结果可以看出,在三个纬度剖面科罗拉多落基山脉山体内部的最热月10 ℃等温线分布高度均高于外围。其中在38°N和39°N,山体内外最热月10 ℃等温线的分布高度差异较大,而在40°N内外差异较小,山体内外最热月10 ℃等温线高度差异的这一变化趋势与结论中山体内外温度的分布差异变化趋势相吻合,即山体内外温度变化趋势为山体内部普遍高于山体外部,且山体增温在38°N~39°N较为强烈,而在40°N增温较小。已有的研究表明,温度是影响林线分布的主要因素之一[27-29]。落基山脉不同纬度剖面最热月10 ℃等温线的分布表明在不同纬度上,由于山体效应使得科罗拉多落基山脉内部较外部而言具有更高的温度条件,导致理想林线在山体内部能够抬升至更高的海拔高度,使得理想林线在落基山脉内部出现了抬升,进而导致科罗拉多落基山脉理想林线分布高于外部甚至是同纬度其他山脉的林线高度分布。
(1)科罗拉多落基山脉增温显著,所有台站的增温均值为2.07 ℃,增温幅度范围为0.78~4.29 ℃,最大温差为4.29 ℃。增温最大值位于38~39°N的山体中心区域。
(2)由山体基面高度、降水大陆度构建的科罗拉多落基山脉山体效应定量化模型对山体增温具有较高的解释能力,判定系数高达71.2%,其中山体基面高度对山体效应的贡献率最大,为55.21%,表明山体基面高度是山体效应的第一因子。
(3)科罗拉多落基山脉不同纬度带山体内外理想林线的分布高度对比表明,山体内部的理想林线高度均高于外部理想林线的分布高度,内外高差达400~700 m。山体内外的理想林线分布趋势与山体增温分布趋势一致,这说明在不同纬度上,由于山体效应使得落基山脉林线在山体内部能够爬升至更高的海拔高度,导致林线在落基山脉内部出现了抬升。
(1)科罗拉多落基山脉山体增温显著,山体内部温度普遍高于山体外部同纬度同高度处的自由大气温度,表明大的山体作为热源对山体本身产生了增温的作用。本文的这一结果与已有的山体效应的研究相吻合,在青藏高原和安第斯山脉的山体效应的研究均表明,山体内部温度高于山体外围的温度[8,9]。此外,科罗拉多落基山脉山体增温受山体基面高度影响较为显著,表现为在山体内部,即山体基面高度比较大的区域,山体增温较为明显。山体增温在科罗拉多落基山脉从中央向外围呈现逐步减小的趋势。
(2)科罗拉多落基山脉山体效应定量化模型表明,山体效应的主要影响因素为山体基面高度和降水大陆度,二者与山体内外温差构建的线性模型拟合度较高。分析可知,科罗拉多落基山脉分布着大型的山脉,许多山体海拔高度超过4200 m。山脉海拔高且分布错落有致,产生了巨大的沟壑,因此存在较为强烈的山体效应。此外,科罗拉多落基山脉气候干旱,降水较少,大陆性气候显著,并对温度产生了巨大的影响。地形特点和大陆性特征相对降低了纬度的影响,而且科罗拉多落基山脉南北仅跨越4个纬度带,南北差异较小,因此纬度对山体效应的影响较小,导致在建模中被剔除。而对于地形开阔度的影响,由于研究区域地形整体较为开阔,区域的地形开阔度均在70%以上,差别不是很大,因此地形开阔度的作用也被忽略。在科罗拉多落基山脉地区,起主导作用的是山体基面高度和降水。
这一结果与以往研究中整个区域的落基山脉山体效应定量化模型相比[14],都表明了山体基面高度对于山体效应的重要性。但是已有的模型中纬度贡献率较高,而降水大陆度贡献很小。分析可能的原因,是整个落基山脉纬度的分布规律与山体基面高度的分布基本一致,纬度作用受到基面高度的影响,同时基面高度的作用削弱了降水的影响。而对于科罗拉多落基山脉,由于大陆性气候显著,降水作用较为显著。已有安第斯山脉山体效应的研究表明[10],纬度对山体效应几乎没有影响,这与本文的结论较为一致。可见,纬度对山体效应的作用与地形有很大的关系,并不是形成山体效应的必要因素。
(3)本文对比了科罗拉多落基山脉不同纬度带山体内外温度的差异,表明山体效应使得山体内部的温度上升,进而抬升了山体内部的等温线。从全球年尺度来看,在不同纬度带,由于科罗拉多落基山脉增温作用,使得该区的林线分布高度高于全球同纬度其他山脉的林线分布高度。如在38°N附近,科罗拉多落基山脉的林线的分布高度达到3800 m[30],而同纬度饭丰山,林线分布高度仅为1750 m[31]。由于山体效应使得科罗拉多落基山脉林线在山体内部能够爬升至更高的海拔高度,导致科罗拉多落基山脉林线分布高于同纬度其他山脉的林线高度分布。
在本文中,最热月10 ℃理想林线的分布高度是通过统一气温垂直递减率推导而出,该结果可以反映一般的变化规律,但是也具有一定的误差,容易受到台站处局部地形的影响,使结果出现一定的浮动。另外递减率本文采用了统一的数值,在接下来的研究中,可以考虑根据不同位置不同的递减率精细化研究结果。
The authors have declared that no competing interests exist.
| [1] |
|
| [2] |
A re-assessment of high elevation treeline positions and their explanation .https://doi.org/10.1007/s004420050540 URL PMID: 28308263 [本文引用: 2] 摘要
In this review I first compile data for the worldwide position of climate-driven alpine treelines. Causes for treeline formation are then discussed with a global perspective. Available evidence suggests a combination of a general thermal boundary for tree growth, with regionally variable “modulatory” forces, including the presence of certain taxa. Much of the explanatory evidence found in the literature relates to these modulatory aspects at regional scales, whereas no good explanations emerged for the more fundamental global pattern related to temperature per se , on which this review is focused. I hypothesize that the life form “tree” is limited at treeline altitudes by the potential investment, rather than production, of assimilates (growth as such, rather than photosynthesis or the carbon balance, being limited). In shoots coupled to a cold atmosphere, meristem activity is suggested to be limited for much of the time, especially at night. By reducing soil heat flux during the growing season the forest canopy negatively affects root zone temperature. The lower threshold temperature for tissue growth and development appears to be higher than 3°C and lower than 10°C, possibly in the 5.5–7.5°C range, most commonly associated with seasonal means of air temperature at treeline positions. The physiological and developmental mechanisms responsible have yet to be analyzed. Root zone temperature, though largely unknown, is likely to be most critical.
|
| [3] |
Global controls of forest line elevation in the northern and southern hemispheres .https://doi.org/10.1046/j.1365-2699.2000.00162.x URL 摘要
Abstract
|
| [4] |
Evidence of threshold temperatures for xylogenesis in conifers at high altitudes .https://doi.org/10.1007/s00442-006-0625-7 Magsci [本文引用: 1] 摘要
<a name="Abs1"></a>Temperature is the most important factor affecting growth at high altitudes. As trees use much of the allocated carbon gained from photosynthesis to produce branches and stems, information on the timing and dynamics of secondary wood growth is crucial to assessing temperature thresholds for xylogenesis. We have carried out histological analyses to determine cambial activity and xylem cell differentiation in conifers growing at the treeline on the eastern Alps in two sites during 2002–2004 with the aim of linking the growth process with temperature and, consequently, of defining thresholds for xylogenesis. Cambial activity occurred from May to July–August and cell differentiation from May–June to September–October. The earliest start of radial enlargement was observed in stone pine in mid-May, while Norway spruce was the last species to begin tracheid differentiation. The duration of wood formation varied from 90 to 137 days, depending on year and site, with no difference between species. Longer durations were observed in trees on the south-facing site because of the earlier onset and later ending of cell production and differentiation. The threshold temperatures at which xylogenesis had a 0.5 probability of being active were calculated by logistic regressions. Xylogenesis was active when the mean daily air temperature was 5.6–8.5°C and mean stem temperature was 7.2–9°C. The similar thresholds among all trees suggested the existence of thermal limits in wood formation that correspond with temperatures of 6–8°C that are supposed to limit growth at the treeline. Different soil temperature thresholds between sites indicated that soil temperature may not be the main factor limiting xylogenesis. This study represents the first attempt to define a threshold through comparative assessment of xylem growth and tissue temperatures in stem meristems at high altitudes.
|
| [5] |
North American and European treelines: External forces and internal processes controlling position .https://doi.org/10.1579/0044-7447-29.7.388 URL [本文引用: 1] 摘要
The factors and plant processes that have been proposed to control treeline location are evaluated for European and North American treelines. While often presented as alternative determinants of treeline, the ideas of the increased environmental hazard coefficient and the idea of tree material limitation are considered to be complementary. This is because plant damage, rather than outright death, coupled with difficult conditions for material acquisition and small available material pools, eventually makes accretion of biomass untenable. The location where this balance is achieved varies with climate, but catastrophic events and human activities make correlation with climate tenuous and future predictions difficult. Field manipulation of conditions for many tree species in many geographic locations at and below the treeline are needed to develop generalizations that are both explanatory and predictive.
|
| [6] |
Mountain Timberlines Ecology, Patchiness, and Dynamics .https://doi.org/10.1657/1523-0430(2004)036[0635:BR]2.0.CO;2 URL [本文引用: 2] 摘要
This book aims to explain mountain timberlines as space- and time-related phenomena. After an introduction into the complexities of the subject, the history and present state of timberline research are outlined. Chapters on the tree species at timberline and on the relationship of timberline elevation to macroclimate, climate character and the mass-elevation effect follow. The main chapter deal...
|
| [7] |
Vegetational zonation in the Rocky Mountains . |
| [8] |
青藏高原气温空间分布规律及其生态意义 .https://doi.org/10.11821/dlyj201511007 URL Magsci [本文引用: 3] 摘要
<p>作为世界第三极的青藏高原,其巨大的块体产生了显著的夏季增温作用,对亚洲乃至全球气候都具有重大影响。但由于高原自然条件严酷,山区气象观测台站很少,气象资料极度匮乏;如果依靠台站数据进行空间插值获得高原气温的空间分布数据,会由于插值点过少而产生较大误差并可能掩盖一些空间信息,因而难以全面反映高原气温的空间分布规律。利用基于MODIS地表温度数据估算的青藏高原气温数据,详细分析各月气温及重要等温线的空间分布格局,并结合林线和雪线数据,初步探讨了高原气温空间分布格局对高原地理生态格局的重要影响。研究表明:① 等温线的海拔高度自高原东北部、东部边缘向内部逐渐升高,等温线在高原内部比东部边缘高500~2000 m,表明相同海拔高度上气温自边缘向高原内部逐渐升高。② 高原西北部的羌塘高原、可可西里为高原的寒冷区,全年有7个月的气温低于0 ℃,3~4个月的气温低于-10 ℃;青藏高原南部(喜马拉雅山北坡—冈底斯山南坡)和中部(冈底斯山北坡—唐古拉山南坡)是高原的温暖区,全年有5个月的气温能达到5~10 ℃,有3个月的气温能超过10 ℃,尤其是拉萨—林芝—左贡一带在3500~4000 m以下的地区最冷月均温也能高于0 ℃。③ 北半球最高雪线和林线分别分布于高原的西南部和东南部,表明高原气温空间分布特征对本地的地理生态格局具有重要影响。</p>
The spatial pattern of monthly air temperature of the Tibetan Plateau and its implications for the geo-ecology pattern of the Plateau .https://doi.org/10.11821/dlyj201511007 URL Magsci [本文引用: 3] 摘要
<p>作为世界第三极的青藏高原,其巨大的块体产生了显著的夏季增温作用,对亚洲乃至全球气候都具有重大影响。但由于高原自然条件严酷,山区气象观测台站很少,气象资料极度匮乏;如果依靠台站数据进行空间插值获得高原气温的空间分布数据,会由于插值点过少而产生较大误差并可能掩盖一些空间信息,因而难以全面反映高原气温的空间分布规律。利用基于MODIS地表温度数据估算的青藏高原气温数据,详细分析各月气温及重要等温线的空间分布格局,并结合林线和雪线数据,初步探讨了高原气温空间分布格局对高原地理生态格局的重要影响。研究表明:① 等温线的海拔高度自高原东北部、东部边缘向内部逐渐升高,等温线在高原内部比东部边缘高500~2000 m,表明相同海拔高度上气温自边缘向高原内部逐渐升高。② 高原西北部的羌塘高原、可可西里为高原的寒冷区,全年有7个月的气温低于0 ℃,3~4个月的气温低于-10 ℃;青藏高原南部(喜马拉雅山北坡—冈底斯山南坡)和中部(冈底斯山北坡—唐古拉山南坡)是高原的温暖区,全年有5个月的气温能达到5~10 ℃,有3个月的气温能超过10 ℃,尤其是拉萨—林芝—左贡一带在3500~4000 m以下的地区最冷月均温也能高于0 ℃。③ 北半球最高雪线和林线分别分布于高原的西南部和东南部,表明高原气温空间分布特征对本地的地理生态格局具有重要影响。</p>
|
| [9] |
The mass elevation effect of the Central Andes and its implications for the Southern Hemisphere's highest treeline .https://doi.org/10.1659/MRD-JOURNAL-D-15-00027 URL [本文引用: 2] 摘要
One of the highest treelines in the world is at 4810 m above sea level on the Sajama Volcano in the central Andes. The climatological cause of that exceptionally high treeline position is still unclear. Although it has been suggested that the mass elevation effect (MEE) explains the upward shift of treelines in the Altiplano region, the magnitude of MEE has not yet been quantified for that region. This paper defines MEE as the air temperature difference in summer at the same elevation between the inner mountains/plateaus (Altiplano) and the free atmosphere above the adjacent lowlands of the Andean Cordillera. The Altiplano air temperature was obtained from the Global Historical Climatology Network-Monthly temperature database, and the air temperature above the adjacent lowlands was interpolated based on the National Center for Environmental Prediction/National Center for Atmospheric Research Reanalysis 1 data set. We analyzed the mean air temperature differences for January, July, and the warm months from October to April. The air temperature was mostly higher on the Altiplano than over the neighboring lowlands at the same altitude. The air temperature difference increased from the outer Andean east-facing slope to the interior of the Altiplano in summer, and it increased from high latitudes to low latitudes in winter. The mean air temperature in the Altiplano in summer is approximately 5 K higher than it is above the adjacent lowlands at the same mean elevation, averaging about 3700 m above sea level. This upward shift of isotherms in the inner part of the Cordillera enables the treeline to climb to 4810 m, with shrub-size trees reaching even higher. Therefore, the MEE explains the occurrence of one of the world's highest treelines in the central Andes.
|
| [10] |
Conditions indirectly affecting vertical distribution on desert mountains .https://doi.org/10.2307/1929428 URL [本文引用: 4] 摘要
See full-text article at JSTOR
|
| [11] |
山体基面高度对欧亚大陆东南部林线分布的影响: 山体效应定量化研究 .https://doi.org/10.1109/SOCPAR.2010.5686099 URL [本文引用: 1] 摘要
根据收集到173个林线数据,采用纬度、经度和基面高度的三元一次方程拟合欧亚大陆东南部林线分布,计算各自的标准回归系数和贡献率,以此来确定山体基面高度(山体效应的简明表达形式)对林线分布高度的影响。结果表明,纬度、经度和山体基面高度对林线分布高度的贡献率分别为30.60%、26.53%、42.87%。以北纬32o为界线,对其以北、以南区域也分别进行了分析,基面高度的贡献率达到24.10%和39.11%。分析不同尺度和区域山体基面高度作用于林线的贡献率不难发现:在欧亚大陆东南部以基面高度代表的山体效应对于林线高度的影响显著,明显地超过了纬度和经度。基面高度的作用受气候条件和海陆位置影响较小,不论大陆内部或沿海,基面高度分异对山地垂直带分异的影响都相对独立和稳定。该结果定量地表明了山体效应对林线分布高度的重要作用。
The effect of mountain base elevation on the altitude of timberline in the Southeastern Eurasia: A study on the quantification of mass elevation effect .https://doi.org/10.1109/SOCPAR.2010.5686099 URL [本文引用: 1] 摘要
根据收集到173个林线数据,采用纬度、经度和基面高度的三元一次方程拟合欧亚大陆东南部林线分布,计算各自的标准回归系数和贡献率,以此来确定山体基面高度(山体效应的简明表达形式)对林线分布高度的影响。结果表明,纬度、经度和山体基面高度对林线分布高度的贡献率分别为30.60%、26.53%、42.87%。以北纬32o为界线,对其以北、以南区域也分别进行了分析,基面高度的贡献率达到24.10%和39.11%。分析不同尺度和区域山体基面高度作用于林线的贡献率不难发现:在欧亚大陆东南部以基面高度代表的山体效应对于林线高度的影响显著,明显地超过了纬度和经度。基面高度的作用受气候条件和海陆位置影响较小,不论大陆内部或沿海,基面高度分异对山地垂直带分异的影响都相对独立和稳定。该结果定量地表明了山体效应对林线分布高度的重要作用。
|
| [12] |
山体效应对北半球林线分布的影响分析 .Mass elevation effect and its contribution to the altitude of timberline in the Northern Hemisphere . |
| [13] |
|
| [14] |
Atlas of American Agriculture . |
| [15] |
Forest types in the Southwest as determined by climateand soil . |
| [16] |
Changes in sub-alpine tree distribution in western North America: A review of climatic and other causal factors . |
| [17] |
Diversity, complexity and interactions: An overview of Rocky Mountain forest ecosystems .https://doi.org/10.1093/treephys/23.16.1091 URL PMID: 14522715 [本文引用: 1] 摘要
This overview of Rocky Mountain forest ecosystems characterizes some of the major types, processes and management issues in the region. There are large ranges in edaphic conditions and striking environmental gradients, all interacting to influence the distribution of species, the nature of communities and disturbance regimes. The discussion focuses on the central role of disturbance and how understanding disturbance regimes influences the search for effective approaches to stewardship.
|
| [18] |
山体基面高度的提取方法: 以台湾岛为例 .https://doi.org/10.3724/SP.J.1047.2012.00562 URL Magsci [本文引用: 1] 摘要
山体基面高度的差异影响山体自身对其水热条件的再分配,进而影响山地垂直带谱的结构和分布,是决定垂直带分布高度的重要因子之一。目前,山体基面高度还没有一个准确科学的定义,也缺乏一个有效的数字化、定量化提取方法。本文以台湾岛为例,使用30m分辨率的ASTER GDEM数据,提出了一种提取山体基面高度的方法。首先,以地形特征与水文特征提取方法获得主山脊线与主山谷线,然后,以地形地貌单元自动提取方法获得山体轮廓界线,再依据提取出的主山脊线、山体轮廓界线及主山谷线,划分山体基面高度分区,依据山体基面分布特征确定各分区的基面高度值,将台湾山地划分出6个不同的山体基面高度(0m、150m、 200m、 600m、630m和650m)。该方法为大范围山体基面高度的快速、准确提取,以及山体效应定量化研究提供了重要的技术支撑。
Mountain basal elevation extraction in the Taiwan Island .https://doi.org/10.3724/SP.J.1047.2012.00562 URL Magsci [本文引用: 1] 摘要
山体基面高度的差异影响山体自身对其水热条件的再分配,进而影响山地垂直带谱的结构和分布,是决定垂直带分布高度的重要因子之一。目前,山体基面高度还没有一个准确科学的定义,也缺乏一个有效的数字化、定量化提取方法。本文以台湾岛为例,使用30m分辨率的ASTER GDEM数据,提出了一种提取山体基面高度的方法。首先,以地形特征与水文特征提取方法获得主山脊线与主山谷线,然后,以地形地貌单元自动提取方法获得山体轮廓界线,再依据提取出的主山脊线、山体轮廓界线及主山谷线,划分山体基面高度分区,依据山体基面分布特征确定各分区的基面高度值,将台湾山地划分出6个不同的山体基面高度(0m、150m、 200m、 600m、630m和650m)。该方法为大范围山体基面高度的快速、准确提取,以及山体效应定量化研究提供了重要的技术支撑。
|
| [19] |
山体效应对台湾常绿阔叶林分布上限的影响 .https://doi.org/10.3969/j.issn.1008-2786.2013.05.004 URL [本文引用: 1] 摘要
山体效应使山体内部的垂直植被带相对升高,影响山地的立体生态格局.台湾岛中央山脉在 3500m以上,山地植被的分布高度不仅受到纬度和季风的影响,也必然受到山体效应的影响.采用台湾生物多样性信息中心发布的数据,利用多元线性回归模型 分析纬度、山体效应(以山体基面高度为简单量化指标)以及季风(以冬雨量占全年降水量百分比为简明代表)对台湾常绿阔叶林分布上限的影响.结果表明,纬 度、山体效应和季风为自变量的线性回归模型R2为0.562,回归方程显著,具有统计学意义,三个变量的贡献率分别为26.32%、64.12%与 9.56%.这表明山体效应对台湾山地垂直带的影响非常显著,远远超过了纬度与季风的作用.同时还发现,冬雨量与垂直带分布高度的相关性以24.13°N 为界,南北完全相反.该纬度以南,冬雨量与垂直带分布高度呈现较强的正相关性;而在以北,正相关性显著下降甚至出现了一定的负相关.后者应该与冬雨量过多 有密切关系.
The effects of mass elevation effect on the distribution of evergreen broad-leaved forests of Taiwan .https://doi.org/10.3969/j.issn.1008-2786.2013.05.004 URL [本文引用: 1] 摘要
山体效应使山体内部的垂直植被带相对升高,影响山地的立体生态格局.台湾岛中央山脉在 3500m以上,山地植被的分布高度不仅受到纬度和季风的影响,也必然受到山体效应的影响.采用台湾生物多样性信息中心发布的数据,利用多元线性回归模型 分析纬度、山体效应(以山体基面高度为简单量化指标)以及季风(以冬雨量占全年降水量百分比为简明代表)对台湾常绿阔叶林分布上限的影响.结果表明,纬 度、山体效应和季风为自变量的线性回归模型R2为0.562,回归方程显著,具有统计学意义,三个变量的贡献率分别为26.32%、64.12%与 9.56%.这表明山体效应对台湾山地垂直带的影响非常显著,远远超过了纬度与季风的作用.同时还发现,冬雨量与垂直带分布高度的相关性以24.13°N 为界,南北完全相反.该纬度以南,冬雨量与垂直带分布高度呈现较强的正相关性;而在以北,正相关性显著下降甚至出现了一定的负相关.后者应该与冬雨量过多 有密切关系.
|
| [20] |
Die Klimatische begrenzung von pflanzenarealen und die verteilung der hygrischen kontinentalität in Den Alpen . |
| [21] |
Climate continentality and treeline species distribution in the Alps .https://doi.org/10.1080/11263500701872416 URL [本文引用: 1] 摘要
The distribution of tree species and the elevation of the alpine treeline are strongly affected by climate continentality. In the present work we performed a detailed survey of the upper limits of tree vegetation in two areas with contrasting climate located in the central Italian Alps, in order to evaluate the structure of the treeline under different degrees of continentality. Tree and krummholz (stunted) individual position, their dimension and life form were recorded from the upper limit of the closed forest to the species limit. The results were compared with an estimation of tree species distribution at the treeline in the whole Lombardy Alps, performed by a survey of tree species occurrence in areas of known climatic traits. The structure of the treeline (upper limits, life form altitudinal arrangement) and its ongoing dynamics were different in the two areas: climate continentality assessed by hygric and thermal continentality indices influenced the distribution of some treeline species. Although the influence of human and geomorphologic disturbance could not be excluded, the importance of the degree of continentality must be stressed when evaluating the response of the treeline to past and present climatic change.
|
| [22] |
山区地形开阔度的分布式模型 .
<P><FONT face=Verdana>地形开阔度是影响山地辐射平衡及其分量的重要地形因子,是山区散射辐射、地形反射辐射等计算的重要参数。在复杂的地形条件下,地形开阔度的计算很难用数学公式描述。 利用数字高程模型(DEM),全面考虑了坡地自身遮蔽和周围地形相互遮蔽的影响,提出了山区地形开阔度的分布式模型和算法。以1 km×1 km分辨率的DEM数据作为地形的综合反映,计算了起伏地形下中国地形开阔度的空间分布。同时,利用100 m和1 km两个分辨率的DEM数据,从不同DEM分辨率和不同地貌类型两个方面探讨了地形开阔度的空间尺度效应,阐明了区域地形开阔度随地形地貌和空间分辨率的变化规律。所提供的山地开阔度的数据可作为基础地理数据供相关研究应用。 <BR></FONT></P>
Distributed modeling of terrain opening extent over mountainous terrains .
<P><FONT face=Verdana>地形开阔度是影响山地辐射平衡及其分量的重要地形因子,是山区散射辐射、地形反射辐射等计算的重要参数。在复杂的地形条件下,地形开阔度的计算很难用数学公式描述。 利用数字高程模型(DEM),全面考虑了坡地自身遮蔽和周围地形相互遮蔽的影响,提出了山区地形开阔度的分布式模型和算法。以1 km×1 km分辨率的DEM数据作为地形的综合反映,计算了起伏地形下中国地形开阔度的空间分布。同时,利用100 m和1 km两个分辨率的DEM数据,从不同DEM分辨率和不同地貌类型两个方面探讨了地形开阔度的空间尺度效应,阐明了区域地形开阔度随地形地貌和空间分辨率的变化规律。所提供的山地开阔度的数据可作为基础地理数据供相关研究应用。 <BR></FONT></P>
|
| [23] |
起伏地形下黄河流域太阳散射辐射分布式模拟研究 .
<FONT face=Verdana>针对天文、大气、宏观地理与局地地形等因子对起伏地形下太阳散射辐射的复杂作用,将影响起伏地形下太阳散射辐射的天空因素与地面因素分开处理.通过基于数字高程模型(DEM)数据的起伏地形下天文辐射模型和地形开阔度模型,综合考虑地面因素对散射辐射的影响;基于常规地面气象站观测资料建立的水平面散射辐射模型考虑天空因素对散射辐射的影响;依据各向异性散射机理,建立了起伏地形下太阳散射辐射分布式计算模型,探索出一条利用DEM数据和常规气象观测资料实现山区太阳散射辐射定量模拟的技术路线.以1 km×1 km分辨率的DEM数据作为地形的综合反映,实现了起伏地形下黄河流域1 km×1 km分辨率的太阳散射辐射分布式模拟.</FONT>
Distributed modeling of diffuse solar radiation over rugged terrain of the Yellow River Basin .
<FONT face=Verdana>针对天文、大气、宏观地理与局地地形等因子对起伏地形下太阳散射辐射的复杂作用,将影响起伏地形下太阳散射辐射的天空因素与地面因素分开处理.通过基于数字高程模型(DEM)数据的起伏地形下天文辐射模型和地形开阔度模型,综合考虑地面因素对散射辐射的影响;基于常规地面气象站观测资料建立的水平面散射辐射模型考虑天空因素对散射辐射的影响;依据各向异性散射机理,建立了起伏地形下太阳散射辐射分布式计算模型,探索出一条利用DEM数据和常规气象观测资料实现山区太阳散射辐射定量模拟的技术路线.以1 km×1 km分辨率的DEM数据作为地形的综合反映,实现了起伏地形下黄河流域1 km×1 km分辨率的太阳散射辐射分布式模拟.</FONT>
|
| [24] |
A global comparison of surface and free-air temperatures at high elevations .https://doi.org/10.1029/2004JD005047 URL [本文引用: 1] 摘要
Surface and free-air temperature observations from the period 1948-2002 are compared for 1084 surface locations at high elevations (>500 m) on all continents. Mean monthly surface temperatures are obtained from two homogeneity adjusted data sets: Global Historical Climate Network (GHCN) and Climatic Research Unit (CRU). Free-air temperatures are interpolated both vertically and horizontally from the National Centers for Environmental Prediction/National Center for Atmospheric Research Reanalysis R1 2.5° grids at given pressure levels. The compatibility of surface and free-air observations is assessed by examination of the interannual variability of both surface and free-air temperature anomalies and the surface/free-air temperature difference (ΔT). Correlations between monthly surface and free-air anomalies are high. The correlation is influenced by topography, valley bottom sites showing lower values, because of the influence of temporally sporadic boundary layer effects. The annual cycle of the derived surface/free-air temperature difference (ΔT) demonstrates physically realistic variability. Cluster analysis shows coherent ΔT regimes, which are spatially organized. Temporal trends in surface and free-air temperatures and ΔT are examined at each location for 1948-1998. Surface temperatures show stronger, more statistically robust and widespread warming than free-air temperatures. Thus ΔT is increasing significantly at the majority of sites (>70%). A sensitivity analysis of trend magnitudes shows some reliance on the time period used. ΔT trend variability is dominated by surface trend variability because free-air trends are weak, but it is possible that reanalysis trends are unrealistically small. Results are sensitive to topography, with mountaintop sites showing weaker ΔT increases than other sites (although still positive). There is no strong relationship between any trend magnitudes and elevation. Since ΔT change is dependent on location, it is clear that temperatures at mountain sites are changing in ways contrasting to free air.
|
| [25] |
青藏高原增温效应对垂直带谱的影响 .Implication of the heating effect of the Tibetan Plateau for mountain altitudinal belts . |
| [26] |
Physiological Ecology of the Alpine Timberline Berlin .https://doi.org/10.1007/978-3-642-67107-4 URL [本文引用: 1] 摘要
Tree Existence at High Altitudes with Special Reference to the European Alps
|
| [27] |
Climate, Limiting Factors and Environmental Change in High-altitude Forests of Western North America .https://doi.org/10.1007/BFb0009773 URL [本文引用: 1] 摘要
The relationships between forest dynamics and climate are predictable for high-altitude forest ecosystems in western North America and other mountainous regions. The duration of snowpack interacts wit
|
| [28] |
Growth and carbon relations of tree line forming conifers at constant vs. variable low temperatures .https://doi.org/10.1111/j.1365-2745.2008.01447.x URL 摘要
Summary 1 Natural climatic driven tree line positions follow a mean growing season temperature of around 6°C in seasonal as well as non-seasonal climates. The influence of constant vs. variable temperature regimes on growth was explored by experimentally exposing 2-year-old seedlings of two montane conifer species ( Larix decidua and Pinus mugo ) to either constant temperatures of 6°C or 12°C, or seasonally and diurnally changing temperatures that varied around the same means (covering a 13-K amplitude across the season). 2 In both species, exposure to 6°C during a 20-week growing season reduced growth dramatically in constant as well as variable temperature treatments. Nevertheless, new biomass production was still measurable at 6°C, indicating that a complete cessation of growth occurs at a lower temperature. 3 The biomass increment by the end of the season was hardly influenced by the presence or absence of temperature variation for both, the 6°C and 12°C mean treatments. While seasonal and diurnal variable temperatures had a slightly positive effect on growth compared to a full season at constant temperatures in the deciduous Larix , biomass increments of the evergreen Pinus were the same at constant and variable temperature treatments. 4 End of season sugar and starch concentrations in different tissues revealed higher concentrations in cold treated seedlings at constant and varying temperatures. In line with previous field data, low temperatures did not lead to carbon depletion (carbon limitation). We thus assume a stronger impact of cool temperatures on meristematic processes (sink activity) than on photosynthesis (source activity). 5 Synthesis. The similar growth rates of trees in experimentally constant vs. variable growing season temperatures match field observations. Although metabolic responses to temperature are nonlinear, this implies an overall ‘quasi-linear’ response of growth to temperature in trees at their lower temperature limit, which awaits further explanation. The higher concentrations of non-structural carbohydrates in cold treated seedlings support the sink-limitation hypothesis of plant growth in cold climates.
|
| [29] |
Treeline form a potential key to understanding treeline dynamics .https://doi.org/10.1111/j.1466-8238.2010.00622.x URL Magsci [本文引用: 1] 摘要
Aim;Treelines occur globally within a narrow range of mean growing season temperatures, suggesting that low-temperature growth limitation determines the position of the treeline. However, treelines also exhibit features that indicate that other mechanisms, such as biomass loss not resulting in mortality (dieback) and mortality, determine treeline position and dynamics. Debate regarding the mechanisms controlling treeline position and dynamics may be resolved by identifying the mechanisms controlling prominent treeline spatial patterns (or 'form') such as the spatial structure of the transition from closed forest to the tree limit. Recent treeline studies world-wide have confirmed a close link between form and dynamics.<br/>Location;The concepts presented refer to alpine treelines globally.<br/>Methods;In this review, we describe how varying dominance of three general 'first-level' mechanisms (tree performance: growth limitation, seedling mortality and dieback) result in different treeline forms, what 'second-level' mechanisms (stresses, e.g. freezing damage, photoinhibition) may underlie these general mechanisms, and how they are modulated by interactions with neighbours ('third-level' mechanisms). This hierarchy of mechanisms should facilitate discussions about treeline formation and dynamics.<br/>Results;We distinguish four primary treeline forms: diffuse, abrupt, island and krummholz. Growth limitation is dominant only at the diffuse treeline, which is the form that has most frequently responded as expected to growing-season warming, whereas the other forms are controlled by dieback and seedling mortality and are relatively unresponsive.<br/>Main conclusions;Treeline form provides a means for explaining the current variability in treeline position and dynamics and for exploring the general mechanisms controlling the responses of treelines to climatic change. Form indicates the relative dependence of tree performance on various aspects of the external climate (especially summer warmth versus winter stressors) and on internal feedbacks, thus allowing inferences on the type as well as strength of climate-change responses.
|
| [30] |
Latitudinal variation in Southern Rocky Mountain forests .https://doi.org/10.2307/3038041 URL [本文引用: 1] 摘要
A latitudinal sequence of vegetation diagrams is presented, each relating the forest vegetation of a region of the southern Rocky Mountain Physiographic Province to elevation and moisture gradients. Geographical trends in forest composition and their elevational zonation are described and the importance of possible competitive interaction of dominant tree species is discussed. While description of distinctive vegetation zones which change in elevation with changing latitude is useful, this incorporates neither variation in zonal composition or interaction of elevation with other environmental factors. For example, low-elevation vegetation types of the southern portion of the transect, xeric Pinus edulis, Juniperus monosperma woodlands or mesic ravine forests, change in composition, become attenuated and are eventually lost northward. Neither are species composition or forest structure constant within a zone. Abies lasiocarpa is absent from the timberline forests at the southern end ot the transect, whereas it is the dominant timberline species at the northern end. A number of possible cases of competitive displacement are suggested by the vegetation diagrams. The competitive relationship between the two major successional species of the Rocky Mountains, Pinus contorta and Populus tremuloides, has long been unclear. The vegetation diagrams suggest that when Pinus contorta is present in the area, it tends to preempt a central portion of the habitat space of Populus tremuloides. When in competition with Pinus contorta, Populus is confined to peripheral portions of its potential range, whereas in the absence of Pinus contorta, Populus is often the dominant successional species over a broad range of sites. White pines (Pinus subgenus haploxylon) provide several examples of apparent competitive release. Where Pinus flexilis is the only white pine present, it occupies xeric sites from the montane forests to tree line, but where either Pinus aristata or P. albicaulis is present, the species is largely restricted to the low-elevation portion of its potential habitat, and to situations with very rocky substrate. Pinus flexilis also appears to substitute for Pinus contorta or Pinus ponderosa where either species is absent. Many aspects of vegetation composition can best understood if viewed in geographic perspective; a gradient analytic approach frequently facilitates interpretation of vegetation-environment interactions. The combination of these two approaches provides a useful method for examining aspects of species distribution and community structure.
|
| [31] |
Controlling factors of forest limit altitude in Japanese mountains .https://doi.org/10.5026/jgeography.100.5_673 URL [本文引用: 1] 摘要
ABSTRACT A forest limit marks a distinct change in landscape, but it includes a variety of elements. In this study, the forest limit altitudes all over Japan were compiled, the relationship between the specific features of their distribution and thermal conditions were discussed.The forest limit altitudes on 211 mountains ranged from below 1, 000 meters in Hokkaido to 2, 800 meters in Central Honshu, and difference in these altitudes extended about 2, 000 meters between 35° and 45° North Latitude. Horizontally, these altitudes are distributed concentrically, focusing on the Taisetsu Mountains and the Hidaka Mountains in Hokkaido and the Akaishi Mountains in Central Honshu. The zone ranging from the southern part of Northern Honshu to the northern part of Central Honshu is crowded with isopleths, forming a division between the sides of the Japan Sea and Pacific Ocean. Calculation the Warmth Indices (WI) of forest limit altitudes, we find that their frequency distribution ranges from 16.1°C·M to 50.4°CEM, and their modes are 25 to 35, 34 to 40, and 25 to 30°C·M in Hokkaido, Northern Honshu, and Central Honshu, respectively. Reviewing these data individually, we see that forest limits are seldom equivalent to WI 15°C·M, which has been set as a boundary between the alpine and subalpine zones. In reality, it becomes increasingly difficult for the forest limit to converge on a particular WI value due to a variety of causes. It is worth noting, however, that at least there are some mountains on which the forest limit altitude is extremely close to WI 15. In such a situation, the WI 15 is of great importance, because it indicates that forests are capable of growing at least to that extent in terms of thermal conditions. This is the reason why WI 15°C·M is worth notice, and therefore the relationship between its altitude distribution and the forest limit altitude was determined. Additionally, the relationship between mountaintop altitude and forest limit altitude was also investigated. The correlation coefficient of the latter is more closely related than the former. But we must emphasize that the latter is only a seeming relation. Why? It is true that the higher the mountain, the higher the limit altitude, but the fact is that the limit altitude will not rise endlessly in step with the height of a mountain.Then, another relationship was examined, concerning differences not only between WI 15 altitudes and forest limit altitudes but also between mountaintop altitudes and forest limit altitudes, using the variation coefficient to verify the dispersion in these differences. As a result, we found out that dispersions are smaller in the former (WI 15 and forest limit) th an in the latter and that forest limit altitudes are more closely related to thermal conditions. On the other hand, the differences between WI 15 altitudes and the forest limit altitudes are defined by mountaintop altitudes. Additionally, the depth of snow cover strongly affects the difference in forest limit altitudes, if mountaintop altitudes are the same.The role of thermal condition, mountaintop altitude and snow depth condition for determining the forest limit altitude should be easy to determine as Fig. 10. Namely, altitudes of forest limit are primarily decided by thermal conditions depended on their geographical situation. They are secondarily modified by altitude of mountain. When the mountain altitudes are equivalent, snow depth conditions affect the forest limit.
|

/
| 〈 |
|
〉 |