刘德新 , 马建华, 谷蕾
LIU Dexin, MA Jianhua, GU Lei
通讯作者:
收稿日期: 2017-10-9
修回日期: 2018-01-29
网络出版日期: 2018-04-20
版权声明: 2018 《地理研究》编辑部 《地理研究》编辑部
基金资助:
作者简介:
作者简介:刘德新(1989- ),男,河南柘城人,博士研究生,主要从事土壤与沉积物环境变化研究。E-mail: liudexin269@163.com
展开
摘要
开封古城相对完整的黄泛沉积序列为探索历史时期碳密度及储量提供了难得的研究载体。以开封城区(师专、医专和明伦)和郊区(金明)4个25 m岩芯为研究对象,通过对861个岩芯样品的容重、有机碳和黑碳分析测试,开展地层有机碳和黑碳密度及储量分析。结果表明:地层有机碳和黑碳含量垂直分布特征基本一致,高值主要集中在地
关键词:
Abstract
Concerns over global change have fueled interest in the carbon cycle, which has impelled the research on the distribution of various forms of carbon in terrestrial ecosystems, and the estimation of carbon storage amounts in various reservoirs. Black carbon (BC) is an important component of organic carbon (OC), and also an important component of the inert carbon pool involved in the global slow carbon cycle. Palaces of several dynasties were buried in the underground of Kaifeng city by flood sediments of the Yellow River. This has formed the unique spectacle of overlapping cities, which provide excellent and rare samples to study carbon density and storage in the historical period. Four sedimentary cores with a length of 25 m were drilled in April, 2012. Three of them were located in the urban area of Kaifeng city (ZKsz, ZKyz and ZKml), and another one was located at the western suburb of the city (ZKjm). Each core was split into 10 cm intervals mostly, for a total number of 861 sediment samples. Then the density and storage of OC and BC were analyzed based on their respective content determination and bulk density. The results show that OC and BC contents can demonstrate the consistent vertical distribution characteristics, and their high values are mainly concentrated within a range of 0-1 m in depth, followed by the historical cultural layers. The OC and BC contents are both significantly higher in urban strata (ZKsz, ZKyz and ZKml) than those in the suburb (ZKjm) of Kaifeng city. The BC density and storage in the 0-25 m layer are 24.67 kg/m2 and 11.30 Tg, accounting for 24.26% and 21.75% of the total organic carbon (TOC) density and storage, respectively. This indicates that the BC storage of the strata occupies a large proportion of the whole carbon pool, so that it should be taken into account when we calculate carbon density and storage in soils and sediments. Comparison of the storage ratio of BC/TOC respectively in the old urban area and new area of Kaifeng city in 0-25 m layer, show that the former is over 10% higher than that of the latter, mainly due to its stronger influence of human activities and more extensive use of coal. This study can provide a reference for finding "missing carbon" and further studying the cycle and balance of carbon.
Keywords:
随着全球变化的加剧,碳循环已成为气候变化和区域可持续发展研究的核心问题之一。陆地生态系统碳循环因受人类活动的强烈影响,被认为是全球碳循环中最复杂的部分,其碳平衡、碳储量以及碳分布引起了国内外学者的广泛关注[1,2,3,4,5,6,7]。黑碳(black carbon,BC)是生物质、化石燃料不完全燃烧[8]或岩石风化的产物[9],普遍存在于土壤、沉积物、水和大气中。据前人研究,土壤中的BC占有机碳(organic carbon,OC)的比例可以达到45%以上[10],有些土壤中甚至高达70%以上[11]。土壤和沉积物是BC的重要碳汇,BC被认为是全球碳循环中“遗失的碳汇(missing sink)”[12],其储量对生物地球化学循环及碳循环研究具有重要意义[4]。
近年来,关于土壤碳密度及储量的研究越来越多[1,4,5,6,7],但基本都是针对OC的计算,并未包括BC在内,致使土壤或沉积物中碳密度和储量被低估。另外,现有的部分研究时间跨度仅在数十年至数百年之间,且研究对象以黄土、湿地、湖泊及海洋沉积物为主[4,13,14,15,16],而对于历史时期连续或阶段性冲积物及文化层中的OC和BC没有给予充分的关注,更加剧了碳密度和碳储量被低估的现象。
开封市地处黄河下游,距今已有4000多年的建城史[17]。战国以来多次黄河泛滥将不同朝代的开封古城淤埋于地下不同深度,形成了相对完整的沉积序列,为探索全新世中晚期以来碳密度和碳储量研究提供了难得的载体[17]。自2012年以来,笔者先后在开封市城区和郊区布设4个钻孔,分别钻取25 m连续岩芯,获得861个样品,开展了黄泛地层沉积旋回划分、洪水沉积记录、黄河水患与开封城市衰落关系等一系列研究[17,18,19,20]。本文在上述样品的基础上,进一步开展OC和BC含量测定,计算全新世中晚期以来黄泛沉积物OC和BC密度与储量,旨在揭示研究区OC和BC密度与储量及其与人类活动的关系,为“遗失的碳库”研究提供案例,并为精确计算全球碳循环和平衡提供参考。
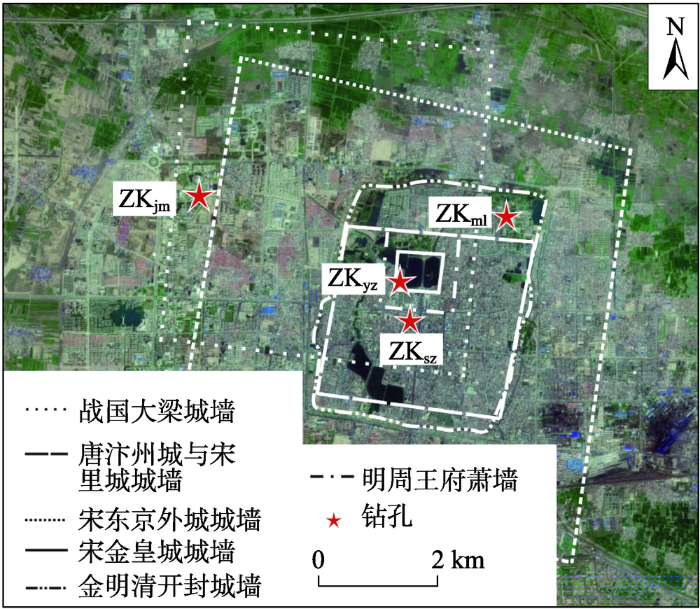
本研究钻孔布设依据有以下两个方面:第一,在城墙的阻挡作用下,入城洪水相对较少,导致城墙内外沉积地层存在差异,故而在开封城墙内外沿洪水流路(自西北向东南)布设钻孔。第二,不同区域人类活动种类和强度的差异对OC和BC密度与储量影响不同,根据各个朝代开封城的具体位置和范围,在受人类活动影响程度不同的区域布设钻孔。鉴于此,在开封市布设4个钻孔(图1),分别位于河南大学师专校区(ZKsz)、医专校区(ZKyz)、明伦校区(ZKml)和金明校区(ZKjm)。ZKsz和ZKyz均位于开封市老城区,岩芯自下而上囊括战国以来各朝代的文化层,人类活动强烈。ZKml在唐代之前一直位于人类活动扰动较小的城外,宋代时被圈进外城之内,到了金代才被圈进内城,人类活动逐渐增强。ZKjm西距战国大梁城西城墙约0.5 km,东侧紧邻北宋东京外城西墙,自公元前225年鸿沟水患淹没大梁城后直到2002年,长期位于历朝城市的郊区,人类活动影响轻微。
2012年4月,利用DPP-100型岩芯钻机采集钻孔25 m连续岩芯,岩芯直径9 cm,采样率达90%以上。大部分岩芯样品按10 cm间隔取样,少数粗砂岩芯取样间距稍大,但均不超过30 cm。ZKsz、ZKyz、ZKml和ZKjm分别获得岩芯样品213个、223个、204个和221个,共计861个样品。根据AMS14C测定,ZKsz、ZKyz、ZKjm和ZKml的战国魏都大梁城(前364年-前225年)的古地面分别出现在地下10 m、11.5 m、15 m和21 m左右[20]。另外,根据开封市规划局《开封全新世地质研究报告》,全新统厚度变化在40~60 m之间。据此估计,岩芯25 m处的年龄在距今5000年左右,即全新世中晚期。
将样品在阴凉处自然风干,去除大的侵入体(石灰颗粒、木屑、砖瓦块等),粉碎后全部通过2 mm尼龙筛。从2 mm土样中随机多点取样,放入土壤球磨机研磨,使其全部通过0.149 mm尼龙筛,混匀,备用。沉积物容重采用环刀法取样,105 °C烘干称重。有机碳含量采用重铬酸钾容量法-外加热分析法测定。黑碳含量采用重铬酸钾氧化法[21,22]去除碳酸钙和有机碳等之后,用Liqui II TOC分析仪(德国Elementar)测定。
样品碳密度和碳储量的计算根据Wu等[1]和Zhan等[4]进行适当改进,公式如下:
式中:OCDj和BCDj分别表示岩芯j的有机碳和黑碳密度(kg/m2);TCDj表示岩芯j的总有机碳密度(kg/m2);Ti表示第i层沉积物厚度(cm);ρi表示第i层沉积物容重(g/cm3);OCi和BCi分别表示第i层沉积物有机碳和黑碳含量(g/kg);n表示j岩芯沉积物层数;TCS表示总有机碳储量(kg);k表示岩芯数目;Sj表示j岩芯控制区面积(m2)。
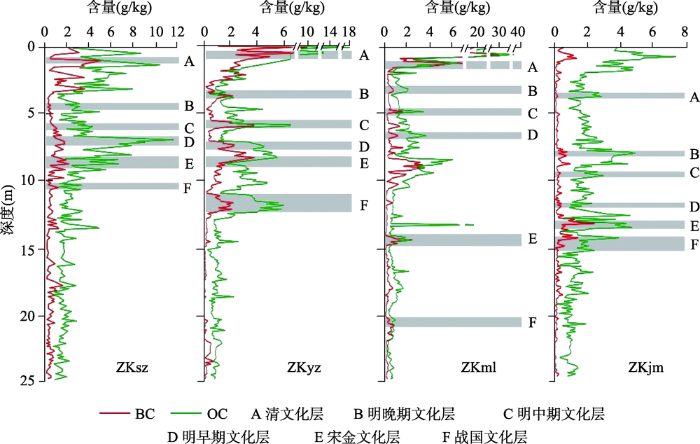
各岩芯OC和BC含量统计见表1,垂直分布见图2。可以看出,开封地层OC和BC含量总体呈现出以下特点:第一,地层OC和BC含量随深度变化波动明显。四个钻孔OC和BC含量曲线峰值出现的深度大多位于被黄河泛滥淤埋的古代地面(文化层)附近[20],变异系数均在60%以上,其中明伦钻孔分别高达193.78%和257.39%,可见开封古城黄泛地层受人类活动影响强烈。第二,地层OC和BC含量具有相似的垂直分布特征。四个岩芯(ZKsz、ZKyz、ZKml和ZKjm)的OC和BC含量均呈极显著正相关(P<0.001),相关系数r依次为0.68、0.91、0.92和0.52,这与已有研究结果一致[4,23]。第三,城区岩芯(ZKsz、ZKyz和ZKml)OC和BC含量显著高于(P<0.01)郊区钻孔(ZKjm),而城区钻孔之间的差异并不显著(P>0.05)。郊区金明钻孔OC和BC含量范围分别在0.21~7.17 g/kg和0.10~2.45 g/kg之间,平均值分别为1.89 g/kg和0.34 g/kg;城区OC和BC含量分别以师专钻孔(2.88 g/kg)和明伦钻孔(1.15 g/kg)为最高。这种差异性说明OC和BC的地域分布与人为活动密切相关,文化层反映的是各朝代不同功能区的状况:师专和医专钻孔自战国以来基本上一直处于各朝代城市的政治、经济和文化中心,主要受城市居民活动的影响;明伦钻孔在宋代之前一直位于城外,到了金代被圈进内城,受人类的影响逐渐加大;而金明钻孔除了战国时期位于大梁城内之外,其他朝代一直远离城墙,受人类扰动最弱[20]。可见,城市环境及人类活动更有利于OC和BC的积累,这与已有研究结果相一致[4,23]。第四,开封地层OC和BC含量的高值主要集中在钻孔0~1 m,其次是各朝代文化层附近[20](图2)。这主要是由于地表及文化层附近生态系统中凋落物的积累及生物质、化石燃料燃烧造成的。开封地层OC和BC含量的最大值(分别为36.17 g/kg和26.36 g/kg)均位于明伦钻孔的0.65 m处,可能与该层段含有大量煤渣等黑色物质有关。在对德国斯图加特[11]和中国南京[23]城市土壤的研究中也发现,剖面中个别层段由于富含木炭和煤渣等燃烧余烬物质而导致其OC和BC含量较高。
表1 开封黄泛地层OC和BC含量统计
Tab. 1 Statistics of OC and BC contents in sedimentary samples in Kaifeng city
| 统计量 | OC(g/kg) | BC(g/kg) | |||||||
|---|---|---|---|---|---|---|---|---|---|
| ZKsz | ZKyz | ZKml | ZKjm | ZKsz | ZKyz | ZKml | ZKjm | ||
| 最小值 | 0.67 | 0.32 | 0.12 | 0.21 | 0.11 | 0.05 | 0.16 | 0.10 | |
| 最大值 | 12.50 | 17.73 | 36.17 | 7.17 | 5.13 | 9.83 | 26.36 | 2.45 | |
| 均值 | 2.88 | 2.30 | 2.25 | 1.89 | 0.72 | 0.88 | 1.15 | 0.34 | |
| SD | 2.16 | 2.26 | 4.36 | 1.17 | 0.80 | 1.29 | 2.96 | 0.27 | |
| 各岩芯平均 | 2.33 | 0.77 | |||||||
图2 开封钻孔有机碳和黑碳含量随深度的变化
Fig. 2 OC and BC contents in four drilling cores of Kaifeng city
与同样作为中国“八大古都”之一的南京城市地层[23]相比,取用同样的剖面深度(6 m),开封OC和BC平均含量(分别为3.82 g/kg和1.59 g/kg)远低于南京城市土壤剖面(分别为10.65 g/kg和4.35 g/kg)。已有研究发现,黏质土通常比砂质土含有更多的OC和BC[4],而受黄河泛滥的影响,开封城市地层黄泛沉积期的沉积物粒径较粗,以粉壤和砂壤土为主[20],其OC和BC含量均较低,大部分层段分别在2.00 g/kg和0.50 g/kg以下。这可能是开封城市地层OC和BC含量低于南京城市地层剖面的重要自然原因。
各钻孔地层OCD和BCD统计见表2。可以看出,4个25 m岩芯OCD和BCD均值分别为77.04 kg/m2和24.67 kg/m2,城区钻孔OCD和BCD均不同程度的高于郊区钻孔,这与钻孔历朝所在位置受人类活动影响的强弱密切相关。OCD大小依次为ZKsz>ZKyz>ZKml>ZKjm,BCD大小依次为ZKml>ZKyz>ZKsz>ZKjm。四个25 m岩芯BCD含量对TCD的贡献均在15%以上。可见,传统的碳储量算法因忽略了BC的存在,而导致碳密度被低估。
表2 开封钻孔OCD和BCD统计
Tab.2 Statistics of OCD and BCD in drilling cores of Kaifeng city
| 碳密度类型 (kg/m2) | 0~1 m岩芯 | 0~25 m岩芯 | |||||||
|---|---|---|---|---|---|---|---|---|---|
| ZKsz | ZKyz | ZKml | ZKjm | ZKsz | ZKyz | ZKml | ZKjm | ||
| OCD | 8.19 | 10.84 | 20.61 | 6.89 | 92.66 | 80.36 | 69.64 | 65.50 | |
| BCD | 2.92 | 5.46 | 13.56 | 1.06 | 22.79 | 29.58 | 34.71 | 11.58 | |
| TCD | 11.11 | 16.30 | 34.17 | 7.95 | 115.45 | 109.94 | 104.35 | 77.08 | |
开封地层0~1 m岩芯OCD和BCD均值分别为11.63 kg/m2和5.75 kg/m2,大小顺序为ZKml>ZKyz>ZKsz>ZKjm。与全国土壤和潮土OCD(分别为9.60 kg/m2和6.54 kg/m2)[24]相比,开封地层分别高出了21.15%和77.83%。与河南省主要土壤类型(如潮土、褐土、黄褐土、水稻土、棕壤等)平均含量和潮土OCD(分别为7.46 kg/m2和7.77 kg/m2)[25]相比,开封地层分别高出了55.90%和49.68%。这可能是由于人类活动对城市土壤OC和BC输入贡献较大的缘故。与国内外城市土壤1 m剖面OCD相比(表3),开封地层与新加坡路旁土壤(11.00 kg/m2)[26]、上海城市土壤(10.55 kg/m2)[27]和重庆城市土壤(11.85 kg/m2)[28]相差不大,但明显低于南京城市土壤(18.36 kg/m2)[23]和纽约居民区土壤(15.50 kg/m2)[29]。开封城市规模与人类活动强度虽不如上述城市,但由于其市区部分1 m地层中文化层的存在,也致使其OCD含量处于较高水平。
表3 开封地层OCD和BCD(0~1 m)与国内外其他城市的比较
Tab. 3 Comparison of OCD and BCD in soils and sediments among Kaifeng and other cities
| 研究区 | OCD(kg/m2) | BCD(kg/m2) | 资料来源 |
|---|---|---|---|
| 新加坡 | 11.00 | - | Ghosh等[26] |
| 上海市 | 10.55 | - | 史利江等[27] |
| 重庆市 | 11.85 | - | 黄雪夏等[28] |
| 纽约 | 15.50 | - | Pouyat等[29] |
| 南京市 | 18.36 | 8.62 | He等[23] |
| 开封市 | 11.63 | 5.75 | 本研究 |
开封0~1 m地层BCD明显高于俄罗斯草原剖面(2.00 kg/m2)[30]、瑞士泥炭地剖面(3.63 kg/m2)[31]、西伯利亚冻土剖面(0.595 kg/m2)[32]及中国的黄土高原(0.60 kg/m2)[4],但低于南京城市土壤(8.62 kg/m2)[23]。研究发现[31,32,33],与其他有机质相比,BC更易被侵蚀、搬运,在土壤水分流动和生物扰动等作用下发生坡面或垂直迁移。开封市地势平坦,城市建筑密集,不透水面和绿地占比较大,降水及地表径流很难造成城市土壤中BC的流失。另一方面,开封城市绿地植被覆盖度较大,加之人类对城市绿地的管理和维护水平较高,可更好地维持植物生长,有利于BC的积累。开封城市地层BCD低于南京主要是由于人类活动强度弱于后者。南京市0~1 m地层自下而上包含了明朝文化层、清朝文化层和近现代人类扰动层[23]。作为明代、太平天国、中华民国的都城及当今的省会城市,南京近600余年来受人类生活和生产活动影响极为强烈。而开封历史文化层普遍在地下1 m以下,0~1 m地层主要是近现代黄河泛滥沉积层[20],BC富集时间均远小于南京。
为尽可能减小因剖面位置的偶然性带来的影响,本研究增加开封市区4个土壤剖面(0~1 m)的数据1( 王岩松. 开封市农地土壤有机碳时空变化及多环芳烃污染研究. 开封: 河南大学博士学位论文, 2015(尚未发表)。)计算地层OC和BC储量。其中3个剖面位于开封市西部新区,OCD和BCD分别为9.36 kg/m2和5.08 kg/m2、4.15 kg/m2和2.13 kg/m2、1.10 kg/m2和1.46 kg/m2;一个剖面位于老城区(城墙之内),OCD和BCD分别为14.41 kg/m2和4.64 kg/m2。按照开封市每个辖区剖面OCD和BCD的平均值,乘以对应辖区面积来计算碳储量(表4)。开封市全区0~1 m地层总有机碳储量为9.28 Tg,约占河南省土壤有机碳库[25]的5.05%,占中国陆地土壤有机碳库[1]的0.54%。但是以开封市区面积仅占河南省陆地面积的0.40%和全国陆地面积的0.006%来看,其总有机碳库的大小还是不容忽视的。
表4 开封地层碳储量估值(Tg)
Tab. 4 The estimation values of carbon storage in sedimentary samples in Kaifeng city (Tg)
| 岩芯 | 老城区 | 新区 | 开封市全区 | ||||||||
|---|---|---|---|---|---|---|---|---|---|---|---|
| OCS | BCS | TCS | OCS | BCS | TCS | OCS | BCS | TCS | |||
| 0~1 m岩芯 | 5.20 | 2.11 | 7.31 | 1.61 | 0.36 | 1.97 | 6.81 | 2.47 | 9.28 | ||
| 0~25 m岩芯 | 24.08 | 8.37 | 32.45 | 16.57 | 2.93 | 19.50 | 40.65 | 11.30 | 51.95 | ||
开封市全区0~1 m地层BC储量为2.47 Tg,占总有机碳储量的26.62%。其中,老城区和新区0~1 m地层BC储量分别为2.11 Tg和0.36 Tg,分别占其总有机碳储量的28.86%和18.27%。开封市全区25 m地层OC和BC储量分别为40.65 Tg和11.30 Tg,其上部1 m地层OC和BC储量约占25 m地层的16.75%和21.86%。可见,开封市OC和BC主要富集在0~1 m地层,但其深层沉积物的储量更不容小觑。老城区和新区25 m地层BC储量分别为8.37 Tg和2.93 Tg,分别占其总有机碳储量的25.79%和15.03%。
与新城区相比,老城区1 m和25 m地层BC储量占比均高出10%以上,其原因可能有以下两个方面:第一,老城区文化层受人类影响更为强烈。开封老城区是历朝政治、经济和文化中心,地层中蕴含有各朝代人类的作物收割、垃圾堆放、燃料燃烧、祭祀、冶金和火药制造等生活和生产活动信息。其中,作物和垃圾中含有大量的有机物质;日常生活、祭祀、炼丹、冶金等需要大量生物质和化石燃料,这些燃料的不完全燃烧产生大量BC,最终富集在文化层附近。第二,煤炭的广泛使用。据记载[34],宋神宗熙宁年间(1068-1077年),开封已将煤炭广泛应用于生产和生活活动中。现今开封市区北部和东南部是传统的老工业区,主要大型工业企业有锅炉厂、炼锌厂、通用机械厂、塑料厂等,这些企业建于20世纪五十、六十年代,在生产过程中多以煤炭作燃料。开封市老城区历史悠久,人口密集,居民生活长期以燃煤为主[35]。煤炭燃烧释放大量BC物质(木炭、烟炱、石墨态BC等)进入周围土壤,这也是导致开封老城区地层BC储量较高的重要原因。
Melnikov等将全球碳收支平衡关系表示为:化石燃料燃烧和水泥生产排放CO2量+土地利用变化引起的CO2净排放量=海洋吸收CO2量+大气增加CO2量+遗失的碳汇[36]。表5是近30余年来全球碳收支状况[37],可以看出,自1980年以来全球平均每年约有2.33 Pg遗失的碳汇。截至目前,这些遗失碳汇的储存位置、形成机制和转化形式等仍不明确,并存在很大争议[38,39,40]。而BC作为遗失碳汇的一部分已得到国内外学者的广泛认可[4,8,9,10,11,12,30,31,32,33],因此,开展BC储量研究也成了寻找失汇之谜的有效途径。
表5 不同时期全球碳预算和碳失汇总量[
Tab. 5 Global carbon budget and total missing carbon sinks in different periods (Pg C/a)
| 碳通量 | 1980s | 1990s | 2000s | 2002-2011 |
|---|---|---|---|---|
| 化石燃料燃烧和水泥生产 | 5.5 | 6.4 | 7.8 | 8.3 |
| 土地利用变化 | 1.4 | 1.6 | 1.1 | 0.9 |
| 大气增加 | 3.4 | 3.1 | 4.0 | 4.3 |
| 海洋吸收 | 2.0 | 2.2 | 2.3 | 2.4 |
| 遗失的碳 | 1.5 | 2.7 | 2.6 | 2.5 |
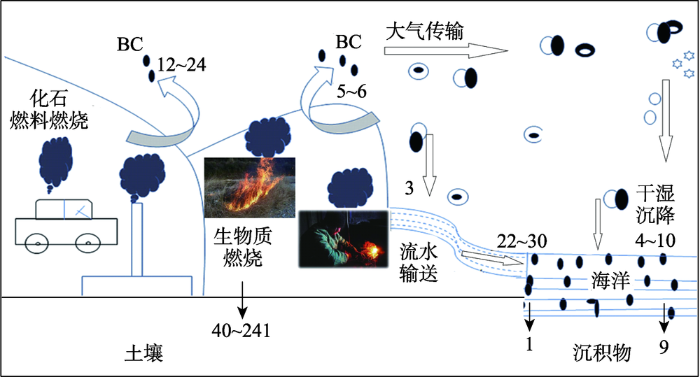
据估计,全球每年产生50~270 Tg BC[12],其在土壤和沉积物与其他环境介质之间的循环通量见图3。从图3可以看出,BC在大气、海洋、土壤及沉积物中的储量还存在不确定性。尽管土壤是BC最重要的“归宿”,但目前还远不清楚BC在各种类型及不同区域土壤中的含量。但可以肯定的是,BC碳库在土壤碳库中占有较大比例,且BC在土壤稳定碳库中占有非常重要的地位。研究表明[31,32,33],土壤表层的BC在生物扰动或水分淋滤作用下发生垂直迁移,这部分BC由于埋藏较深,可以成为更稳定的碳库。这些深层地层中被忽略的BC很难再释放温室气体进入全球碳循环中,在一定程度上对抑制全球变暖具有重要意义。黑碳的形成使大气中CO2的净含量减少约2%~18%[12],土壤或沉积物中的BC能从地—气碳氮循环中捕获并固定碳氮,减少大气温室气体(CO2、CH4、N2O等)的含量[41,42]。据此,有人提出在无氧或缺氧条件下将木本或草本植物进行低温热解处理,通过人为制造BC的途径来实现碳捕获与储存,炭化后得到的BC又重新回到土壤中,达到固定碳氮的目的,进而解决因温室气体排放所引起的全球气候变暖问题[43,44]。
开封由于其独特的“城摞城”地层特征,地下BC储量十分丰富(25 m地层的储量是0~1 m的近5倍),且在总有机碳储量中占比很大。仅从本研究结果来看,4个25m岩芯的BCD约占总有机碳密度的四分之一(24.25%),0~1 m范围内BCD约占总有机碳密度的三分之一(33.08%)。另外,像开封这样的“城摞城”景观并非一处,在黄河下游冲积平原上,由黄河泛滥形成的多期沉积地层垂直叠压是普遍存在的[45,46]。可见,在计算土壤或沉积物碳密度和储量时,BC是绝对不能被忽视的因素。建议今后在计算碳储量时,将BC也考虑在内。
(1)开封地层OC和BC含量随深度变化波动明显,垂直分布特征较为一致,高值主要集中在岩芯0~1 m,其次是各朝代的文化层附近。城区钻孔(ZKsz、ZKyz和ZKml)OC和BC含量显著高于郊区钻孔(ZKjm),而城区钻孔之间的差异并不显著。
(2)开封地层0~1 m和0~25 m的BCD均值分别为5.75 kg/m2和24.67 kg/m2,BC储量分别为2.47 Tg和11.30 Tg,分别占其总有机碳储量的26.62%和17.86%。传统的碳储量计算方法因忽略了BC的存在而导致碳储量被低估,建议今后应将BC考虑在内。
(3)开封老城区1 m和25 m地层BC储量在总有机碳储量中的占比均高出新区10%以上,主要与老城区受历朝人类活动影响更为强烈及煤炭的广泛使用有关。
本文研究成果对5000 a BP以来的全球碳循环研究具有一定参考价值,但从不同时间尺度全球碳循环研究来看,究竟将沉积物的目标深度定在何处,有待进一步研究。
The authors have declared that no competing interests exist.
| [1] |
Distribution and storage of soil organic carbon in China .https://doi.org/10.1029/2001GB001844 URL [本文引用: 4] 摘要
[1] Surface soils hold the largest terrestrial organic carbon pool, although estimates of the world's soil organic carbon storage remain controversial, largely due to spatial data gaps or insufficient data density. In this study, spatial distribution and storage of soil organic carbon in China are estimated using the published data from 34,411 soil profiles investigated during China's second national soil survey. Results show that organic carbon density in soils varies from 0.73 to 70.79 kg C/m2 with the majority ranging between 4.00 and 11.00 kg C/m2. Carbon density decreases from east to west. A general southward increase is obvious for western China, while carbon density decreases from north to south in eastern China. Highest values are observed in forest soils in northeast China and in subalpine soils in the southeastern part of the Tibetan Plateau. The average density of 0908048.01 kg C/m2 in China is lower than the world's mean organic carbon density in soil (09080410.60 kg C/m2), mainly due to the extended arid and semi-arid regions. Total organic carbon storage in soils in China is estimated to be 09080470.31 Pg C, representing 0908044.7% of the world storage. Carbon storage in the surface organic horizons which is most sensitive to interactions with the atmosphere and environmental change is 09080432.54 Pg C.
|
| [2] |
霍山县县域范围内不同空间尺度下农田土壤有机碳变异分析 .https://doi.org/10.11821/yj2012090003 URL [本文引用: 1] 摘要
基于安徽省霍山县第二次土壤普查数据,提取2005~2008年耕地监测数据资料建成土壤有机碳含量数据库,对耕地监测的有机碳数据按县域内不同空间尺度进行了统计分析。结果表明:20年来该县农田表土有机碳含量明显提高,显示农田土壤的有机碳库积累。县域范围内耕地土壤有机碳含量的不同尺度的变异系数介于4.53%~14.91%。村民组(自然村)单元内变异性最高,有机碳含量乡镇间变异性低于行政村间变异性。因此,从县级尺度的农田土壤碳计量来说,以乡镇尺度采样研究比村级尺度可靠性要高。影响县域内农田土壤有机碳含量与变异的动力因子主要是农业利用和农田基本建设,茶、桑和水稻利用下农田土壤有机碳含量明显较高。
Variabilities of soil organic carbon in farmlands at different spatial scales in Huoshan county, Anhui province .https://doi.org/10.11821/yj2012090003 URL [本文引用: 1] 摘要
基于安徽省霍山县第二次土壤普查数据,提取2005~2008年耕地监测数据资料建成土壤有机碳含量数据库,对耕地监测的有机碳数据按县域内不同空间尺度进行了统计分析。结果表明:20年来该县农田表土有机碳含量明显提高,显示农田土壤的有机碳库积累。县域范围内耕地土壤有机碳含量的不同尺度的变异系数介于4.53%~14.91%。村民组(自然村)单元内变异性最高,有机碳含量乡镇间变异性低于行政村间变异性。因此,从县级尺度的农田土壤碳计量来说,以乡镇尺度采样研究比村级尺度可靠性要高。影响县域内农田土壤有机碳含量与变异的动力因子主要是农业利用和农田基本建设,茶、桑和水稻利用下农田土壤有机碳含量明显较高。
|
| [3] |
近30年土地利用变化对新疆森林生态系统碳库的影响 .https://doi.org/10.11821/dlyj201311002 URL [本文引用: 1] 摘要
土地利用及其变化是导致森林生态系统碳库变化最重要的因素.以植 树造林面积、森林产品收获产量及林地转移面积为基础数据,采用《LULUCF指南》中数据分层的碳源汇计量方法,分析了1975-2005年期间三种土地 利用方式对新疆森林碳库的影响.1975年新疆森林总碳库估算值为720.02 Tg,其中土壤碳库为528.82 Tg.近30年土地利用变化对其碳库的影响总体表现为碳汇,固碳量为48.15 Tg,与1975年碳库相比,森林碳储量增长了6.69%.植树造林表现出强烈的碳汇功能,总固碳量为54.24 Tg.森林采伐是最主要的碳释放来源,共释放碳5.42 Tg.林地转移呈现微弱的碳释放特征,共排放为0.66 Tg.研究结果表明,土地利用变化对该区域森林碳库具有明显的增汇效应.本研究将有利于进一步深化人类活动对区域碳平衡影响的认识.
Sources and sinks of carbon from forest land use change in Xinjiang, China during 1975-2005 .https://doi.org/10.11821/dlyj201311002 URL [本文引用: 1] 摘要
土地利用及其变化是导致森林生态系统碳库变化最重要的因素.以植 树造林面积、森林产品收获产量及林地转移面积为基础数据,采用《LULUCF指南》中数据分层的碳源汇计量方法,分析了1975-2005年期间三种土地 利用方式对新疆森林碳库的影响.1975年新疆森林总碳库估算值为720.02 Tg,其中土壤碳库为528.82 Tg.近30年土地利用变化对其碳库的影响总体表现为碳汇,固碳量为48.15 Tg,与1975年碳库相比,森林碳储量增长了6.69%.植树造林表现出强烈的碳汇功能,总固碳量为54.24 Tg.森林采伐是最主要的碳释放来源,共释放碳5.42 Tg.林地转移呈现微弱的碳释放特征,共排放为0.66 Tg.研究结果表明,土地利用变化对该区域森林碳库具有明显的增汇效应.本研究将有利于进一步深化人类活动对区域碳平衡影响的认识.
|
| [4] |
Spatial distributions and sequestrations of organic carbon and black carbon in soils from the Chinese Loess Plateau .https://doi.org/10.1016/j.scitotenv.2012.10.113 URL PMID: 23219202 [本文引用: 10] 摘要
Concentrations of soil organic carbon (SOC), black carbon (BC), char, and soot in topsoils (0–2002cm) and vertical soil profiles (0–10002cm) from the Chinese Loess Plateau (CLP) were investigated. Objectives of the study were to establish the spatial distributions and estimate the sequestrations of these substances. The SOC, BC, char and soot concentrations were higher in the eastern and southeastern parts of the plateau and lower in the north, which is consistent with the patterns of economic development and energy consumption. The highest average SOC concentration was found in the clayey loess zone, followed by the loess and sandy loess zones. Similar trends were observed for BC, char and soot, suggesting interactions with clay and silt are potentially important influences on OC and BC. The SOC contents in topsoils varied from 0.31 to 51.8102g02kg 61021 , with a mean value of 6.5402g02kg 61021 , while BC and char concentrations were 0.02 to 5.502g02kg 61021 and 0.003 to 4.1902g02kg 61021 , respectively, and soot ranged from 0.01 to 1.3202g02kg 61021 . Unlike SOC, both BC and char decreased with soil depth, whereas soot showed little variation with depth. BC and char were correlated in the topsoils, and both correlated moderately well with SOC (R 2 02=020.60) and soot (R 2 02=020.53). The SOC pools sequestered in the 0 to 2002cm and 0 to 10002cm depths were estimated to be 0.741 and 3.6302Pg, respectively, and the BC pools sequestered in the 0 to 2002cm and 0 to 10002cm depths were 0.073 and 0.45602Pg, respectively. Therefore the quantity of carbon stored in the sediments of the CLP evidently exceeds 10 9 tons. The char contained in the upper 2002cm layer was 0.05302Pg, which amounted to 72.5% of the BC in that layer.
|
| [5] |
Decadal soil carbon accumulation across Tibetan permafrost regions .
Climate change is expected to release carbon stored in permafrost soils. Sampling of sites across the Tibetan Plateau in the early 2000s and early 2010s reveals increased carbon stocks in shallow soils, which may offset losses from deeper soils.
|
| [6] |
土壤碳库研究中土壤数据从矢量到栅格的等精度转换 .Study on the transformation from vector to raster for soil data with identical data precision in the estimation of soil organic carbon stocks . |
| [7] |
Climate controls on carbon accumulation in peatlands of Northeast China .https://doi.org/10.1016/j.quascirev.2015.03.005 URL [本文引用: 2] 摘要
61Northeast China shows a high C accumulation rate during the Holocene.61The current peatland area is 82,90002km2 and contains 654.3402Gt02C in northeast China.61C accumulation over the last 2000 years is linearly related to the PAR0.
|
| [8] |
|
| [9] |
Reburial of fossil organic carbon in marine sediments .https://doi.org/10.1038/nature02299 URL PMID: 14737163 [本文引用: 2] 摘要
Marine sediments act as the ultimate sink for organic carbon, sequestering otherwise rapidly cycling carbon for geologic timescales. Sedimentary organic carbon burial appears to be controlled by oxygen exposure time in situ, and much research has focused on understanding the mechanisms of preservation of organic carbon. In this context, combustion-derived black carbon has received attention as a form of refractory organic carbon that may be preferentially preserved in soils and sediments. However, little is understood about the environmental roles, transport and distribution of black carbon. Here we apply isotopic analyses to graphitic black carbon samples isolated from pre-industrial marine and terrestrial sediments. We find that this material is terrestrially derived and almost entirely depleted of radiocarbon, suggesting that it is graphite weathered from rocks, rather than a combustion product. The widespread presence of fossil graphitic black carbon in sediments has therefore probably led to significant overestimates of burial of combustion-derived black carbon in marine sediments. It could be responsible for biasing radiocarbon dating of sedimentary organic carbon, and also reveals a closed loop in the carbon cycle. Depending on its susceptibility to oxidation, this recycled carbon may be locked away from the biologically mediated carbon cycle for many geologic cycles.
|
| [10] |
Charred organic carbon in German chernozemic soils .https://doi.org/10.1046/j.1365-2389.1999.00236.x URL [本文引用: 2] 摘要
Summary Burning vegetation produces partly charred plant material which subsequently could contribute to the highly refractory proportion of soil organic matter. The presence of charred organic carbon (COC) was investigated in 17 horizons originating from nine soils from Germany and the Netherlands using a suite of complementary methods (high-energy ultraviolet photo-oxidation, scanning electron microscopy, solid-state 13 C nuclear magnetic resonance, lignin analysis by CuO oxidation). Charred organic carbon could not be detected in the A horizons of an Alisol and a Gleysol, but it contributed up to 45% of the organic carbon and up to about 8 g kg 1 of the soil in a range of grey to black soils (Cambisol, Luvisol, Phaeozem, Chernozem and Greyzem). All these soils have chernozemic soil properties (dark colour, A profile, high base saturation, bioturbation). A 10-km colour sequence of four chernozemic soils, which were very similar in chemical and physical properties, showed a strong relation between colour and the content of COC. This suggests that the COC affects mainly soil colour in the sequence studied. Finely divided COC seems to be a major constituent of many chernozemic soils in Germany. These results suggest that besides climate, vegetation and bioturbation, fire has played an important role in the pedogenesis of chernozemic soils.
|
| [11] |
Biochemical characterization of urban soil profiles from Stuttgart, Germany .https://doi.org/10.1016/j.soilbio.2004.12.009 URL [本文引用: 3] 摘要
The knowledge of biochemical properties of urban soils can help to understand nutrient cycling in urban areas and provide a database for urban soil management. Soil samples were taken from 10 soil profiles in the city of Stuttgart, Germany, differing in land use—from an essentially undisturbed garden area to highly disturbed high-density and railway areas. A variety of soil biotic (microbial biomass, enzyme activities) and abiotic properties (total organic C, elemental C, total N) were measured up to 1.902m depth. Soil organic matter was frequently enriched in the subsoil. Microbial biomass in the top horizons ranged from 0.17 to 1.6402g C02kg 611 , and from 0.01 to 0.3002g N02kg 611 , respectively. The deepest soil horizon at 170–19002cm, however, contained 0.1202g C02kg 611 and 0.0502kg N02kg 611 in the microbial biomass. In general, arylsulphatase and urease activity decreased with depth but in three profiles potentially mineralizable N in the deepest horizons was higher than in soil layers directly overlying. In deeply modified urban soils, subsoil beside topsoil properties have to be included in the evaluation of soil quality. This knowledge is essential because consumption of natural soils for housing and traffic has to be reduced by promoting inner city densification.
|
| [12] |
Black Carbon and the carbon cycle .https://doi.org/10.1126/science.280.5371.1903 URL [本文引用: 4] |
| [13] |
A 400-year record of black carbon flux in the Xisha archipelago, South China Sea and its implication .https://doi.org/10.1016/j.marpolbul.2011.06.027 URL PMID: 21840551 [本文引用: 1] 摘要
We reconstructed the first long-term ( 400 years) records of black carbon (BC) deposition flux from three ornithogenic sediment profiles, which were collected from three remote, isolated islets of the Xisha archipelago, South China Sea. The significant correlations between black carbon, organic matter and excess (210)Pb suggested that black carbon was mainly derived from atmospheric deposition, and further enriched by plant-derived organic matter in sediments. During the past 400 years, the BC flux remained relatively low before the onset of 20th century; it started to increase from approximately 1900 AD, and peaked around the 1970s. In the recent 30 years, the BC flux seemed to display decreasing trend, very likely due to the change of energy structure and development of pollution control techniques. In comparison with marginal sea regions that are greatly impacted by anthropogenic activities, these pristine Xisha islands were not significantly influenced by black carbon of anthropogenic origin.
|
| [14] |
Historical trends of atmospheric black carbon on Tibetan Plateau as reconstructed from a 150-year lake sediment record .https://doi.org/10.1021/es3048202 URL PMID: 23402524 [本文引用: 1] 摘要
Black carbon (BC) is one of the key components causing global warming. Especially on the Tibetan Plateau (TP), reconstructing BC's historical trend is essential for better understanding its anthropogenic impact. Here, we present results from high altitude lake sediments from the central TP. The results provide a unique history of BC over the past 150 years, from the preindustrial to the modern period. Although BC concentration levels in the Nam Co Lake sediments were lower than those from other high mountain lakes, the temporal trend of BC fluxes clearly showed a recent rise, reflecting increased emissions from anthropogenic activities. The BC records were relatively constant until 1900, then began to gradually increase, with a sharp rise beginning around 1960. Recent decades show about 2.5-fold increase of BC compared to the background level. The emission inventory in conjunction with air mass trajectories further demonstrates that BC in the Nam Co Lake region was most likely transported from South Asia. Rapid economic development in South Asia is expected to continue in the next decades; therefore, the influence of BC over the TP merits further investigations.
|
| [15] |
Black carbon deposition and storage in peat soils of the Changbai Mountain, China .https://doi.org/10.1016/j.geoderma.2016.03.021 URL [本文引用: 1] 摘要
Black carbon (BC) is produced by incomplete combustion of fossil fuels and biomass and emissions are influenced by human activities. Due to its refractory nature and long half-life times, BC contributes to carbon sequestration in soils. Here, we investigated BC concentrations and storage in peatlands of the Changbai Mountains (Northeast China) and reconstructed historical trends of deposition fluxes from four peat cores. Results showed that there were no significant differences of BC deposition fluxes in different cores sampled at similar altitudes, but BC deposition fluxes at low altitudes were stronger influenced by human activities than those at high altitudes. During the last 15002years, more BC was emitted by increasing anthropogenic sources, and therefore the BC deposition fluxes accordingly increased. Total BC storage in peat soils of the Changbai Mountains was estimated to 1.6102Tg (5.1302Gg02C02km 61022 ) and a deposition flux of 3.3002Gg02yr 61021 of BC was calculated. The high BC deposition fluxes the fact that about 5% of carbon storage in peatland could be regarded as BC support that BC represents an important fraction of carbon storage in peatland ecosystems.
|
| [16] |
Spatial and temporal patterns in black carbon deposition to dated fennoscandian arctic lake sediments from 1830 to 2010 .https://doi.org/10.1021/acs.est.5b01779 URL [本文引用: 1] 摘要
Black carbon (BC) is fine particulate matter produced by the incomplete combustion of biomass and fossil fuels. It has a strong climate warming effect that is amplified in the Arctic. Long-term trends of BC play an important role in assessing the climatic effects of BC and in model validation. However, few historical BC records exist from high latitudes. We present five lake-sediment soot-BC (SBC) records from the Fennoscandian Arctic and compare them with records of spheroidal carbonaceous fly-ash particles (SCPs), another BC component, for ca. the last 120 years. The records show spatial and temporal variation in SBC fluxes. Two northernmost lakes indicate declining values from 1960 to the present, which is consistent with modeled BC deposition and atmospheric measurements in the area. However, two lakes located closer to the Kola Peninsula (Russia) have recorded increasing SBC fluxes from 1970 to the present, which is likely caused by regional industrial emissions. The increasing trend is in agreement with a Svalbard ice-core-BC record. The results suggest that BC deposition in parts of the European Arctic may have increased over the last few decades, and further studies are needed to clarify the spatial extent of the increasing BC values and to ascertain the climatic implications.
|
| [17] |
黑碳在开封古城黄泛地层沉积旋回划分中的指示意义 .https://doi.org/10.11821/dlxb201505005 URL [本文引用: 3] 摘要
多次黄河泛滥使现今开封城市地面以下叠置数座古城,出现"城摞城"奇观。泛滥之后的城市重建等人类活动常常扰动正常的沉积层序,给粒度旋回划分带来巨大困难,因此需要寻找其他代用指标。分别在"城摞城"中心区(ZKsz)和郊区(ZKjm)获取25 m连续岩芯,以10 cm间隔分样;用激光粒度法结合筛分开展沉积物粒度分析,用Lim法(1996)测定黑碳含量,用小波分析划分沉积旋回。结果表明:ZKjm岩芯的粒度旋回界线大多与黑碳旋回一致,表明黑碳含量可以作为划分沉积旋回的代用指标。ZKsz钻芯深度8.8~23.5 m之间的地层,粒度旋回和黑碳旋回的数量及其界限基本相同;北宋以后地层(深度0.3~8.8 m)的粒度旋回只有2个,而黑碳旋回有7个,表明黑碳含量适用于城市扰动地层的沉积旋回划分。
Black carbon as an indicator for dividing sedimentary cycle from the Yellow River flood sediments in Kaifeng .https://doi.org/10.11821/dlxb201505005 URL [本文引用: 3] 摘要
多次黄河泛滥使现今开封城市地面以下叠置数座古城,出现"城摞城"奇观。泛滥之后的城市重建等人类活动常常扰动正常的沉积层序,给粒度旋回划分带来巨大困难,因此需要寻找其他代用指标。分别在"城摞城"中心区(ZKsz)和郊区(ZKjm)获取25 m连续岩芯,以10 cm间隔分样;用激光粒度法结合筛分开展沉积物粒度分析,用Lim法(1996)测定黑碳含量,用小波分析划分沉积旋回。结果表明:ZKjm岩芯的粒度旋回界线大多与黑碳旋回一致,表明黑碳含量可以作为划分沉积旋回的代用指标。ZKsz钻芯深度8.8~23.5 m之间的地层,粒度旋回和黑碳旋回的数量及其界限基本相同;北宋以后地层(深度0.3~8.8 m)的粒度旋回只有2个,而黑碳旋回有7个,表明黑碳含量适用于城市扰动地层的沉积旋回划分。
|
| [18] |
开封市西郊地层“崇祯大旱”事件的孢粉记录 .A study of the Chong Zhen Drought event from pollen records in the western suburbs of Kaifeng city, China . |
| [19] |
全新世中后期开封西郊黄泛沉积序列的孢粉记录 .The middle and late Holocene pollen record from the Yellow River flooding sedimentary sequence in the western suburbs of Kaifeng city, China . |
| [20] |
|
| [21] |
Determination of black carbon by chemical oxidation and thermal treatment in recent marine and lake sediments and Cretaceous-Tertiary clays .https://doi.org/10.1016/0009-2541(96)00031-9 URL [本文引用: 1] 摘要
Several sample treatments and analytical methods for the measurement of black carbon in a wide variety of sediments were considered in which the removal of organic carbon is a critical step in the procedure. A comparison between chemical oxidation and thermal treatment was conducted and the latter was shown to be inappropriate due to the polymerisation of organic matter. Using acid dichromate oxidation, reactive kerogen was separated from black carbon in a variety of lake and marine, and recent and ancient sediments with relatively small and quantifiable losses (1--6%) of black carbon under carefully controlled reaction conditions.
|
| [22] |
Black carbon and kerogen in soils and sediments. 1. Quantification and characterization .https://doi.org/10.1021/es025502m URL PMID: 12269749 [本文引用: 1] 摘要
A comprehensive wet chemical procedure was developed by combining acid demineralization, base extraction, and dichromate oxidation for fractionation and quantitative isolation of soil/sediment organic matter (SOM) into four fractions: (1) humic acids + kerogen + BC (HKB); (2) kerogen + BC (KB); (3) humic acid (HA); and (4) BC. The soil/sediment samples tested were collected from the suburban areas of Guangzhou, a rapidly developing city of China. The results show that BC and kerogen constitute 57.8-80.6% of the total organic carbon (TOC) and that the relative content of BC ranges from 18.3% to 41.0% of the TOC, indicating that both BC and kerogen are major organic components in soils and sediments from this industrialized region. Systematic characterization of the isolated SOMs shows that both BC and kerogen have sizes ranging from a few microns to above 100 microm, relatively low O/C and H/C atomic ratios, and low contents of oxygen-containing functional groups. The isolated BC has unique fusinite and semifusinite macerals, highly porous nature, and structures indicative of its possible origins. The study indicates that SOM is highly heterogeneous and that humin, the nonextractable humus fraction, consists mainly of kerogen and BC materials in the tested soil/sediment samples. The presence of these materials in soils and sediments may have significant impacts on pollutant mass transfer and transformation processes such as desorption and bioavailability of less polar organic chemicals in surface aquatic and groundwater environments.
|
| [23] |
Historical record of black carbon in urban soils and its environmental implications .https://doi.org/10.1016/j.envpol.2009.05.019 URL PMID: 19482400 [本文引用: 9] 摘要
Energy use in urbanization has fundamentally changed the pattern and fluxes of carbon cycling, which has global and local environmental impacts. Here we have investigated organic carbon (OC) and black carbon (BC) in six soil profiles from two contrast zones in an ancient city (Nanjing) in China. BC in soils was widely variable, from 0.22 to 32.1902g02kg 611. Its average concentration in an ancient residential area02(Zone 1) was, 0.9102g02kg 611, whereas in Zone 2, an industrial and commercial area, the figure was 8.6202g02kg 611. The ratio of BC/OC ranged from 0.06 to 1.29 in soil profiles, with an average of 0.29. The vertical distribution of BC in soil is suggested to reflect the history of BC formation from burning of biomass and/or fossil fuel. BC in the surface layer of soils was mainly from traffic emission (especially from diesel vehicles). In contrast, in cultural layers BC was formed from historical coal use. The contents of BC and the ratio of BC/OC may reflect different human activities and pollution sources in the contrasting urban zones. In addition, the significant correlation of heavy metals (Cu, Pb, and Zn) with BC contents in some culture layers suggests the sorption of the metals by BC or their coexistence resulted from the coal-involved smelting.
|
| [24] |
基于1:100万土壤数据库的中国土壤有机碳密度及储量研究 .
基于中国1:100万土壤数据库,利用土壤有机碳储量和碳密度的空间化表达和计算方法研究中国土壤有机碳密度及储量.土壤空间数据库包含926个土壤类型单元,690个土属类型,94 000多个图斑;土壤属性数据库收录了7 292个全国各类型土壤的剖面数据,包括81个土壤属性字段.研究采用"土壤类型GIS连接法"实现土壤剖面有机碳密度与图形图斑连接,通过制图单元碳储量求和得出全国或者区域碳储量,并利用面积平均法计算全国及各类型土壤的有机碳平均密度.结果表明,中国的土壤面积共有928.10×10<sup>4</sup> km<sup>2</sup>,有机碳储量为89.14 Pg (1 Pg=101 g),土壤平均碳密度9.60 kg·m<sup>-2</sup>,是目前与真值最为接近的研究结果.
Estimation of China soil organic carbon storage and density based on 1:1000000 soil database .
基于中国1:100万土壤数据库,利用土壤有机碳储量和碳密度的空间化表达和计算方法研究中国土壤有机碳密度及储量.土壤空间数据库包含926个土壤类型单元,690个土属类型,94 000多个图斑;土壤属性数据库收录了7 292个全国各类型土壤的剖面数据,包括81个土壤属性字段.研究采用"土壤类型GIS连接法"实现土壤剖面有机碳密度与图形图斑连接,通过制图单元碳储量求和得出全国或者区域碳储量,并利用面积平均法计算全国及各类型土壤的有机碳平均密度.结果表明,中国的土壤面积共有928.10×10<sup>4</sup> km<sup>2</sup>,有机碳储量为89.14 Pg (1 Pg=101 g),土壤平均碳密度9.60 kg·m<sup>-2</sup>,是目前与真值最为接近的研究结果.
|
| [25] |
河南省土壤有机碳储量及空间分布 .
<FONT face=Verdana>利用河南省1∶20万土壤数据库估算了河南省土壤有机碳储量,并分析了其空间分布规律.结果表明:河南省陆地土壤有机碳含量约为10.27×10<SUP>8</SUP> t,占全国储量的1.15%;土壤平均碳密度为7.46 kg·m<SUP>-2</SUP>,低于全国平均水平9.60 kg·m<SUP>-2</SUP>;有机碳储量在前4位的土壤类型为潮土、褐土、粗骨土和黄褐土,碳储量都大于1.0×10<SUP>8</SUP> t,四者之和占全省总储量的69.65%;沼泽土的有机碳密度最大,为24.54 kg·m<SUP>-2</SUP>,其次为山地草甸土和棕壤,分别为17.69和14.64 kg·m<SUP>-2</SUP>,三者主要分布在西部山区,其碳储量之和仅占全省的6.34%;石质土和风沙土的碳密度含量最低,分别为1.32和1.38 kg·m<SUP>-2</SUP> ;全省的土壤有机碳密度主要在5~10 kg·m<SUP>-2</SUP>范围内变动.</FONT>
Soil organic carbon storage and its spatial distribution in Henan province .
<FONT face=Verdana>利用河南省1∶20万土壤数据库估算了河南省土壤有机碳储量,并分析了其空间分布规律.结果表明:河南省陆地土壤有机碳含量约为10.27×10<SUP>8</SUP> t,占全国储量的1.15%;土壤平均碳密度为7.46 kg·m<SUP>-2</SUP>,低于全国平均水平9.60 kg·m<SUP>-2</SUP>;有机碳储量在前4位的土壤类型为潮土、褐土、粗骨土和黄褐土,碳储量都大于1.0×10<SUP>8</SUP> t,四者之和占全省总储量的69.65%;沼泽土的有机碳密度最大,为24.54 kg·m<SUP>-2</SUP>,其次为山地草甸土和棕壤,分别为17.69和14.64 kg·m<SUP>-2</SUP>,三者主要分布在西部山区,其碳储量之和仅占全省的6.34%;石质土和风沙土的碳密度含量最低,分别为1.32和1.38 kg·m<SUP>-2</SUP> ;全省的土壤有机碳密度主要在5~10 kg·m<SUP>-2</SUP>范围内变动.</FONT>
|
| [26] |
Soil organic carbon distribution in roadside soils of Singapore .https://doi.org/10.1016/j.chemosphere.2016.09.028 URL PMID: 27643661 [本文引用: 2] 摘要
Soil is the largest pool of organic carbon in terrestrial systems and plays a key role in carbon cycle. Global population living in urban areas are increasing substantially; however, the effects of urbanization on soil carbon storage and distribution are largely unknown. Here, we characterized the soil organic carbon (SOC) in roadside soils across the city-state of Singapore. We tested three hypotheses that SOC contents (concentration and density) in Singapore would be positively related to aboveground tree biomass, soil microbial biomass and land-use patterns. Overall mean SOC concentrations and densities (0–100cm) of Singapore's roadside soils were 29gkg 611 (4–106gkg 611 ) and 11kgm 612 (1.1–42.5kgm 612 ) with median values of 26gkg 611 and 10kgm 612 , respectively. There was significantly higher concentration of organic carbon (10.3gkg 611 ) in the top 0–30cm soil depth compared to the deeper (30–50cm, and 50–100cm) soil depths. Singapore's roadside soils represent 4% of Singapore's land, but store 2.9 million Mg C (estimated range of 0.3–11 million Mg C). This amount of SOC is equivalent to 25% of annual anthropogenic C emissions in Singapore. Soil organic C contents in Singapore's soils were not related to aboveground vegetation or soil microbial biomass, whereas land-use patterns to best explain variance in SOC in Singapore's roadside soils. We found SOC in Singapore's roadside soils to be inversely related to urbanization. We conclude that high SOC in Singapore roadside soils are probably due to management, such as specifications of high quality top-soil, high use of irrigation and fertilization and also due to an optimal climate promoting rapid growth and biological activity.
|
| [27] |
上海土壤有机碳储量及其空间分布特征 .
<p>区域土壤碳库的估算不仅是陆地土壤碳循环研究的重要内容,同时也可为国家尺度的土壤碳库的估算提供更多的数据支持。利用上海第二次土壤普查资料,结合GIS技术对上海土壤有机碳储量、碳密度及其空间分布格局展开研究,结果表明,上海地区0~100 cm深度的土壤有机碳总储量为576×107 t,占全国的0.062 6%,0~100 cm的平均土壤有机碳密度为1055 kg/m2,高于全国平均值,反映出上海土壤具有较高的碳蓄积能力。各类土壤中,水稻土的土壤碳储量最大,其次是灰潮土和滨海盐土,而黄棕壤由于面积狭小,所以土壤碳储量最小。各类土壤0~100 cm土壤有机碳密度的大小顺序依次为水稻土>灰潮土>黄棕壤>滨海盐土。从空间分布格局来看,上海土壤碳密度呈现为西高东低,在局部范围内还表现出高低相间,错综复杂的局面,这种分布规律在一定程度上体现了地形、微地貌、母质、土地利用方式等因素的影响。而快速的城市化引起的土地利用变化造成了土壤碳库的净碳损失量为39244万t,相当于2000年化石燃料产生的碳排放的9.86%,这表明在经济和城市快速发展地区,土地利用变化已经成为影响土壤碳库的重要驱动力。</p>
Reserves and spatial distribution characteristics of soil organic carbon in Shanghai city .
<p>区域土壤碳库的估算不仅是陆地土壤碳循环研究的重要内容,同时也可为国家尺度的土壤碳库的估算提供更多的数据支持。利用上海第二次土壤普查资料,结合GIS技术对上海土壤有机碳储量、碳密度及其空间分布格局展开研究,结果表明,上海地区0~100 cm深度的土壤有机碳总储量为576×107 t,占全国的0.062 6%,0~100 cm的平均土壤有机碳密度为1055 kg/m2,高于全国平均值,反映出上海土壤具有较高的碳蓄积能力。各类土壤中,水稻土的土壤碳储量最大,其次是灰潮土和滨海盐土,而黄棕壤由于面积狭小,所以土壤碳储量最小。各类土壤0~100 cm土壤有机碳密度的大小顺序依次为水稻土>灰潮土>黄棕壤>滨海盐土。从空间分布格局来看,上海土壤碳密度呈现为西高东低,在局部范围内还表现出高低相间,错综复杂的局面,这种分布规律在一定程度上体现了地形、微地貌、母质、土地利用方式等因素的影响。而快速的城市化引起的土地利用变化造成了土壤碳库的净碳损失量为39244万t,相当于2000年化石燃料产生的碳排放的9.86%,这表明在经济和城市快速发展地区,土地利用变化已经成为影响土壤碳库的重要驱动力。</p>
|
| [28] |
重庆市土壤有机碳库的估算及其空间分布特征 .https://doi.org/10.3321/j.issn:1009-2242.2005.01.014 URL [本文引用: 2] 摘要
基于重庆市第二次土壤普查的1411个土壤剖面数据,结合重庆市土壤图、土地利用现状图和行政区划图,在地理信息系统技术的支持下,对重庆市土壤有机碳密度及储量进行了估算,同时引入有机碳丰度指数这一指标,对有机碳在不同土壤、不同区域以及不同景观中的分布特征进行了分析。结果表明:重庆市20cm和100cm深度的土壤有机碳储量分别为0.27Tg和1.0Tg;20cm深度的土壤有机碳密度介于0.33~30.36kg/m2之间,100cm深度的土壤有机碳密度介于1.27~72.69kg/m2之间;重庆市土壤有机碳库在不同土壤、不同区域以及不同景观的分布具有高度的空间变异性,100cm深度的土壤、区域和景观有机碳丰度指数分别为0.58~1.95,0.55~1.39和0.46~1.58,与气候、植被、人类活动等因素密切相关。
Estimating soil organic carbon pool of Chongqing area and its spatial distribution .https://doi.org/10.3321/j.issn:1009-2242.2005.01.014 URL [本文引用: 2] 摘要
基于重庆市第二次土壤普查的1411个土壤剖面数据,结合重庆市土壤图、土地利用现状图和行政区划图,在地理信息系统技术的支持下,对重庆市土壤有机碳密度及储量进行了估算,同时引入有机碳丰度指数这一指标,对有机碳在不同土壤、不同区域以及不同景观中的分布特征进行了分析。结果表明:重庆市20cm和100cm深度的土壤有机碳储量分别为0.27Tg和1.0Tg;20cm深度的土壤有机碳密度介于0.33~30.36kg/m2之间,100cm深度的土壤有机碳密度介于1.27~72.69kg/m2之间;重庆市土壤有机碳库在不同土壤、不同区域以及不同景观的分布具有高度的空间变异性,100cm深度的土壤、区域和景观有机碳丰度指数分别为0.58~1.95,0.55~1.39和0.46~1.58,与气候、植被、人类活动等因素密切相关。
|
| [29] |
Soil carbon pools and fluxes in urban ecosystems .https://doi.org/10.1016/S0269-7491(01)00263-9 URL PMID: 11833898 [本文引用: 2] 摘要
The transformation of landscapes from non-urban to urban land use has the potential to greatly modify soil carbon (C) pools and fluxes. For urban ecosystems, very little data exists to assess whether urbanization leads to an increase or decrease in soil C pools. We analyzed three data sets to assess the potential for urbanization to affect soil organic C. These included surface (0–10 cm) soil C data from unmanaged forests along an urban–rural gradient, data from “made” soils (1 m depth) from five different cities, and surface (0–15 cm) soil data of several land-use types in the city of Baltimore. Along the urban–rural land-use gradient, we found that soil organic matter concentration in the surface 10 cm varied significantly ( P =0.001). In an analysis of variance, the urban forest stands had significantly ( P =0.02) higher organic C densities (kg m 612 to 1 m depth) than the suburban and rural stands. Our analysis of pedon data from five cities showed that the highest soil organic C densities occurred in loamy fill (28.5 kg m 612 ) with the lowest occurring in clean fill and old dredge materials (1.4 and 6.9 kg m 612 , respectively). Soil organic C densities for residential areas (15.5±1.2 kg m 612 ) were consistent across cities. A comparison of land-use types showed that low density residential and institutional land-uses had 44 and 38% higher organic C densities than the commercial land-use type, respectively. Our analysis shows that as adjacent land-use becomes more urbanized, forest soil C pools can be affected even in stands not directly disturbed by urban land development. Data from several “made” soils suggests that physical disturbances and inputs of various materials by humans can greatly alter the amount C stored in these soils.
|
| [30] |
Centennial black carbon turnover observed in a Russian steppe soil .https://doi.org/10.5194/bgd-5-661-2008 URL [本文引用: 2] 摘要
Black carbon (BC), from incomplete combustion of fuels and biomass, has been considered highly recalcitrant and a substantial sink for carbon dioxide. Recent studies have shown that BC can be degraded. We use soils sampled 100 years apart in a Russian steppe preserve to generate the first whole-profile estimate of BC stocks and turnover in the field. BC stocks (initially 2.5 kg mlt;supgt;-2lt;/supgt;) decreased 25% with cessation of biomass burning. BC turnover in the soil was 293 y (best estimate; range 212amp;ndash;541 y), much faster than inert/passive carbon in soil models. Such results provide a new constraint on theories of soil carbon stabilization. Most importantly, BC cannot be assumed chemically recalcitrant in all soils; other explanations for very old soil carbon are needed.
|
| [31] |
Mobility of black carbon in drained peatland soils .https://doi.org/10.5194/bgd-4-871-2007 URL [本文引用: 4] 摘要
Amount, stability, and distribution of black carbon BC were studied at four sites of a large peatland ("Witzwil") formerly used as a disposal for combustion residues from households to derive BC displacement rates in the profile. Possible artefacts from thermal oxidation with Differential Scanning Calorimetry (DSC) on BC quantification of C-rich deposits were inferred by choosing three sites from a second peatland with no historical record of waste disposal as a reference ("Seebodenalp"). All sites were under grassland at time of sampling, but were partially cropped in the past at Witzwil. Mean BC contents in topsoils of Witzwil ranged from 10.7 to 91.5 (0 30 cm) and from 0.44 to 51.3 (30 140 cm) mg BC g 1 soil, corresponding to BC/OC ratios of 0.04 to 0.3 (topsoil) and 0.02 to 0.18 (deeper soil). At three sites of Seebodenalp, BC was below the detection limit of 0.4 mg g 1 organic soil, indicating negligible formation of BC during thermal oxidation of peat. 13C NMR spectra corroborated the high BC contents at Witzwil. The data refer to a considerable vertical transport of BC given that soils were ploughed not deeper than 30 cm since abandonment of waste application about 50 years ago. The total amount of BC in the Witzwil profiles ranged from 3.2 to 7.5 kg BC m 2, with 21 to 69 percent of it stemming from below the former ploughing depth. Under the premise of negligible rates of BC consumption since abandonment of waste application, minimum BC transport rates in these peats are 0.6 to 1.2 cm a 1. The high mobility of BC might be explained by high macro-pore volumes in combination with occasional water saturation. By means of DSC peak temperatures, different types of BC could be distinguished, with deeper horizons containing BC of higher thermal stability. Application of combustion residues likely involved a mixture of various BC types, of which thermally more stable ones, most likely soots, were preferentially transported downwards.
|
| [32] |
Storage and mobility of black carbon in permafrost soils of the forest tundra ecotone in Northern Siberia .https://doi.org/10.1111/j.1365-2486.2008.01568.x URL [本文引用: 4] 摘要
Abstract Boreal permafrost soils store large amounts of organic carbon (OC). Parts of this carbon (C) might be black carbon (BC) generated during vegetation fires. Rising temperature and permafrost degradation is expected to have different consequences for OC and BC, because BC is considered to be a refractory subfraction of soil organic matter. To get some insight into stocks, variability, and characteristics of BC in permafrost soils, we estimated the benzene polycarboxylic acid (BPCA) method-specific composition and storage of BC, i.e. BPCA-BC, in a 0.44km 2 -sized catchment at the forest tundra ecotone in northern Siberia. Furthermore, we assessed the BPCA-BC export with the stream draining the catchment. The catchment is composed of various landscape units with south-southwest (SSW) exposed mineral soils characterized by thick active layer or lacking permafrost, north-northeast (NNE) faced mineral soils with thin active layer, and permafrost-affected raised bogs in plateau positions showing in part thermokarst formation. There were indications of vegetation fires at all landscape units. BC was ubiquitous in the catchment soils and BPCA-BC amounted to 0.6–3.0% of OC. This corresponded to a BC storage of 22–3440gm 612 . The relative contribution of BPCA-BC to OC, as well as the absolute stocks of BPCA-BC were largest in the intact bogs with a shallow active layer followed by mineral soils of the NNE aspects. In both landscape units, a large proportion of BPCA-BC was stored within the permafrost. In contrast, mineral soils with thick active layer or lacking permafrost and organic soils subjected to thermokarst formation stored less BPCA-BC. Permafrost is, hence, not only a crucial factor in the storage of OC but also of BC. In the stream water BPCA-BC amounted on an average to 3.9% of OC, and a yearly export of 0.10g BPCA-BCm 612 was calculated, most of it occurring during the period of snow melt with dominance of surface flow. This suggests that BC mobility in dissolved and colloidal phase is an important pathway of BC export from the catchment. Such a transport mechanism may explain the high BC concentrations found in sediments of the Arctic Ocean.
|
| [33] |
Fate of soil-applied black carbon: Downward migration, leaching and soil respiration .https://doi.org/10.1111/j.1365-2486.2009.02044.x URL [本文引用: 3] 摘要
Black carbon (BC) is an important pool of the global C cycle, because it cycles much more slowly than others and may even be managed for C sequestration. Using stable isotope techniques, we investigated the fate of BC applied to a savanna Oxisol in Colombia at rates of 0, 11.6, 23.2 and 116.1 t BC hap#, as well as its effect on non-BC soil organic C. During the rainy seasons of 2005 and 2006, soil respiration was measured using soda lime traps, particulate and dissolved organic C (POC and DOC) moving by saturated flow was sampled continuously at 0.15 and 0.3 m, and soil was sampled to 2.0 m. Black C was found below the application depth of 0-0.1 m in the 0.15-0.3 m depth interval, with migration rates of 52.4pl14.5, 51.8pl18.5 and 378.7pl196.9 kg C hap# yrp# (plSE) where 11.6, 23.2 and 116.1 t BC hap#, respectively, had been applied. Over 2 years after application, 2.2% of BC applied at 23.2 t BC hap# was lost by respiration, and an even smaller fraction of 1% was mobilized by percolating water. Carbon from BC moved to a greater extent as DOC than POC. The largest flux of BC from the field (20-53% of applied BC) was not accounted for by our measurements and is assumed to have occurred by surface runoff during intense rain events. Black C caused a 189% increase in aboveground biomass production measured 5 months after application (2.4-4.5 t additional dry biomass hap# where BC was applied), and this resulted in greater amounts of non-BC being respired, leached and found in soil for the duration of the experiment. These increases can be quantitatively explained by estimates of greater belowground net primary productivity with BC addition.
|
| [34] |
|
| [35] |
Spatial distribution of soil magnetic susceptibility and correlation with heavy metal pollution in Kaifeng city, China .https://doi.org/10.1016/j.catena.2015.11.004 URL [本文引用: 1] 摘要
The characterization of heavy metal pollution is urgently needed in modern environmental studies. However, traditional geochemical methods for detecting soil heavy metals are rather time-consuming and expensive. In recent years, non-destructive and rapid magnetic techniques seem promising in monitoring soil pollution but it is questionable how this relates to heavy metal concentrations. Therefore, in order to understand the correlation of heavy metal pollution with environmental magnetism, magnetic susceptibility (χ LF ) and the concentrations of As, Cd, Cr, Cu, Ni, Pb and Zn were measured in the topsoil (0–1502cm) collected from Kaifeng City, China. In this study, the spatial distribution of heavy metals and χ LF , as well as the correlation between pollution load index ( PLI ) and χ LF were carried out. Results show that the contamination factor ( CF ) values of different heavy metals follow the order: Cd (10.48)02>02Zn (2.28)02>02Pb (1.68)02>02Cu (1.51)02>02Ni (0.81)02>02Cr (0.80)02>02As (0.65). The average pollution load index ( PLI ) of the metals is 2.53, representing a moderate pollution level as a whole of the city soil. In general, similar spatial distribution patterns of heavy metals and χ LF were found in this research, which decrease progressively from the southeast/east to the northwest/west in the study area. High concentrations of heavy metals and high levels of χ LF appears around the southeast, the north of the older city (within the ancient city wall), and along the Longxi–Haizhou Railway. Moreover, contents of As, Cd, Cr, Cu, Ni, Pb and Zn in soils and PLI are significantly positively correlated with their χ LF . The results further attest that the measurement of χ LF is a simple, rapid and quantitative method for the assessment of heavy metal contamination of soils. When χ LF 02≤027102×0210 61028 02m 3 02kg 61021 , the soil is considered to be non-polluted; 7102×0210 61028 02<02χ LF 02≤0216202×0210 61028 02m 3 02kg 61021 represents slightly polluted soils; 16202×0210 61028 02<02χ LF 02≤0225302×0210 61028 02m 3 02kg 61021 moderate pollution, and χ LF 02≥0225302×0210 61028 02m 3 02kg 61021 corresponds to heavily polluted soils. However, the standard is exclusively valid for the study area and cannot be simply “transferred” to other polluted areas.
|
| [36] |
Learning about the carbon cycle from global budget data .https://doi.org/10.1029/2005GL023935 URL [本文引用: 1] 摘要
Observation-based estimates of the global carbon budget serve as important constraints on carbon cycle models. We test the effect of new budget data on projection uncertainty. Using a simple global model, we find that data for an additional decadal budget have only a marginal effect on projection uncertainty, in the absence of any constraints on decadal variability in carbon fluxes. Even if uncertainty in the global budget were eliminated entirely, uncertainty in the mechanisms governing carbon sinks have a much larger effect on future projections. Results suggest that learning about the carbon cycle will best be facilitated by improved understanding of sink mechanisms and their variability as opposed to better estimates of the magnitudes of fluxes that make up the global carbon budget.
|
| [37] |
|
| [38] |
A large and persistent carbon sink in the world's forests .https://doi.org/10.1126/science.1201609 URL PMID: 21764754 [本文引用: 1] 摘要
The terrestrial carbon sink has been large in recent decades, but its size and location remain uncertain. Using forest inventory data and long-term ecosystem carbon studies, we estimate a total forest sink of 2.4 ± 0.4 petagrams of carbon per year (Pg C year-1) globally for 1990 to 2007. We also estimate a source of 1.3 ± 0.7 Pg C year-1 from tropical land-use change, consisting of a gross tropical deforestation emission of 2.9 ± 0.5 Pg C year-1 partially compensated by a carbon sink in tropical forest regrowth of 1.6 ± 0.5 Pg C year-1. Together, the fluxes comprise a net global forest sink of 1.1 ± 0.8 Pg C year-1, with tropical estimates having the largest uncertainties. Our total forest sink estimate is equivalent in magnitude to the terrestrial sink deduced from fossil fuel emissions and land-use change sources minus ocean and atmospheric sinks.
|
| [39] |
Significance of the carbon sink produced by H2O-carbonate-CO2-aquatic phototroph interaction on land .https://doi.org/10.1007/s11434-014-0682-y URL [本文引用: 1] 摘要
One of the most important questions in the science of global change is how to balance the atmospheric CO 2 budget. There is a large terrestrial missing carbon sink amounting to about one billion tonnes of carbon per annum. The locations, magnitudes, variations, and mechanisms responsible for this terrestrial missing carbon sink are uncertain and the focus of much continuing debate. Although the positive feedback between global change and silicate chemical weathering is used in geochemical models of atmospheric CO 2 , this feedback is believed to operate over a long timescale and is therefore generally left out of the current discussion of human impact upon the carbon budget. Here, we show, by synthesizing recent findings in rock weathering research and studies into biological carbon pump effects in surface aquatic ecosystems, that the carbon sink produced by carbonate weathering based on the H 2 O–carbonate–CO 2 –aquatic phototroph interaction on land not only totals half a billion tonnes per annum, but also displays a significant increasing trend under the influence of global warming and land use change; thus, it needs to be included in the global carbon budget.
|
| [40] |
Substantial global carbon uptake by cement carbonation .
Calcination of carbonate rocks during the manufacture of cement produced 5% of global CO2 emissions from all industrial process and fossil-fuel combustion in 20131, 2. Considerable attention has been paid to quantifying these industrial process emissions from cement production2, 3, but the natural reversal of the process?carbonation?has received little attention in carbon cycle studies. Here, we use new and existing data on cement materials during cement service life, demolition, and secondary use of concrete waste to estimate regional and global CO2 uptake between 1930 and 2013 using an analytical model describing carbonation chemistry. We find that carbonation of cement materials over their life cycle represents a large and growing net sink of CO2, increasing from 0.10 GtC yr?1 in 1998 to 0.25 GtC yr?1 in 2013. In total, we estimate that a cumulative amount of 4.5 GtC has been sequestered in carbonating cement materials from 1930 to 2013, offsetting 43% of the CO2 emissions from production of cement over the same period, not including emissions associated with fossil use during cement production. We conclude that carbonation of cement products represents a substantial carbon sink that is not currently considered in emissions inventories1, 3, 4.
|
| [41] |
Short-term CO2 mineralization after additions of biochar and switchgrass to a Typic Kandiudult .https://doi.org/10.1016/j.geoderma.2009.10.014 URL [本文引用: 1] 摘要
Biochar additions to soil can increase soil organic carbon (SOC) concentrations; however, minimal information is available on relationships with soil nitrogen (N) cycle. We hypothesized that biochar additions to sandy soils should be resistant to microbial mineralization in short-term studies but may prime organic carbon (OC) mineralization of fresh residue that promotes N immobilization. A laboratory pot incubation study was conducted with a Norfolk loamy sand (Fine-loamy, kaolinitic, thermic, Typic Kandiudult) mixed with pecan-shell biochar at rates of 0, 5, 10 and 20 g kg 61 1 and with 0 and 10 g kg 61 1 dried, ground switchgrass ( Panicum virgatum L. ). On days 25 and 67 of the incubation, all pots were leached with 1.2 to 1.3 pore volumes of deionized H 2O and the leachate NO 3–N, NH 4–N, and dissolved organic (DOC) concentrations were measured. Also cumulative soil CO 2 fluxes after days 25 and 67 were determined. Biochar alone and mixed with soil and switchgrass after 67 days of incubation were characterized using Fourier transformed infrared spectroscopy (FT-IR). Mixing biochar with switchgrass after 67 days caused a significant increase in SOC content while soil total nitrogen (TN) and leachate DOC concentrations showed mixed results. Biochar mineralization by itself was found to be minimal, but by days 25 and 67, soil with biochar and switchgrass exhibited higher cumulative CO 2 fluxes implying stimulation of switchgrass mineralization. Significant NO 3–N immobilization occurred after 25 days in treatments with biochar + switchgrass; however, by day 67 the NO 3–N concentrations rebounded slightly. The FT-IR analysis revealed that switchgrass in the presence of biochar underwent some structural modifications. Biochar applications in the short-term can cause N immobilization resulting in temporary plant available NO 3–N concentration reductions.
|
| [42] |
Degradability of black carbon and its impact on trace gas fluxes and carbon turnover in paddy soils .https://doi.org/10.1016/j.soilbio.2010.07.012 URL [本文引用: 1] 摘要
Rice paddy soils are characterized by anoxic conditions, anaerobic carbon turnover, and significant emissions of the greenhouse gas methane. A main source for soil organic matter in paddy fields is the rice crop residue that is returned to fields if not burned. We investigated as an alternative treatment the amendment of rice paddies with rice residues that have been charred to black carbon. This treatment might avoid various negative side effects of traditional rice residue treatments. Although charred biomass is seen as almost recalcitrant, its impact on trace gas (CO 2 , CH 4 ) production and emissions in paddy fields has not been studied. We quantified the degradation of black carbon produced from rice husks in four wetland soils in laboratory incubations. In two of the studied soils the addition of carbonised rice husks resulted in a transient increase in carbon mineralisation rates in comparison to control soils without organic matter addition. After almost three years, between 4.4% and 8.5% of the black carbon added was mineralised to CO 2 under aerobic and anaerobic conditions, respectively. Theaddition of untreated rice husks resulted in a strong increase in carbon mineralisation rates and in the same time period 77%鈥100% of the added rice husks were mineralised aerobically and 31%鈥54% anaerobically. The 13 C-signatures of respired CO 2 gave a direct indication of black carbon mineralisation to CO 2. In field trials we quantified the impact of rice husk black carbon or untreated rice husks on soil respiration and methane emissions. The application of black carbon had no significant effect on soil respiration but significantly enhanced methane emissions in the first rice crop season. The additional methane released accounted for only 0.14% of black carbon added. If the same amount of organic carbon was added as untreated rice husks, 34% of the applied carbon was released as CO 2 and methane in the first season. Furthermore, the addition of fresh harvest residues to paddy fields resulted in a disproportionally high increase in methane emissions. Estimating the carbon budget of the different rice crop residue treatments indicated that charring of rice residues and adding the obtained black carbon to paddy fields instead of incorporating untreated harvest residues may reduce field methane emissions by as much as 80%. Hence, the production of black carbon from rice harvest residues could be a powerful strategy for mitigating greenhouse gas emissions from rice fields.
|
| [43] |
A handful of carbon .https://doi.org/10.1038/447143a URL [本文引用: 1] |
| [44] |
Sustainable biochar to mitigate global climate change .URL PMID: 20975722 [本文引用: 1] 摘要
Abstract Production of biochar (the carbon (C)-rich solid formed by pyrolysis of biomass) and its storage in soils have been suggested as a means of abating climate change by sequestering carbon, while simultaneously providing energy and increasing crop yields. Substantial uncertainties exist, however, regarding the impact, capacity and sustainability of biochar at the global level. In this paper we estimate the maximum sustainable technical potential of biochar to mitigate climate change. Annual net emissions of carbon dioxide (CO(2)), methane and nitrous oxide could be reduced by a maximum of 1.8090009Pg CO(2)-C equivalent (CO(2)-C(e)) per year (12% of current anthropogenic CO(2)-C(e) emissions; 1090009Pg=1090009Gt), and total net emissions over the course of a century by 130090009Pg CO(2)-C(e), without endangering food security, habitat or soil conservation. Biochar has a larger climate-change mitigation potential than combustion of the same sustainably procured biomass for bioenergy, except when fertile soils are amended while coal is the fuel being offset.
|
| [45] |
河南商丘县东周城址勘查简报 .
一、引言商丘地区处在历史上所称的黄泛区,自北宋末至清咸丰年问黄河南泛所引起的大量泥砂堆积,导致了大部分史前和历史时代的文化遗址被深埋于黄河冲积物之下。1936年李景聃先生为探索先商和早商文化的起源和发展,曾在商丘一带作过调查,对当地
The brief report of the East Zhou Town site reconnaissance in Shangqiu, Henan .
一、引言商丘地区处在历史上所称的黄泛区,自北宋末至清咸丰年问黄河南泛所引起的大量泥砂堆积,导致了大部分史前和历史时代的文化遗址被深埋于黄河冲积物之下。1936年李景聃先生为探索先商和早商文化的起源和发展,曾在商丘一带作过调查,对当地
|
| [46] |
黄泛平原古城镇洪涝经验及其适应性景观 .https://doi.org/10.3969/j.issn.1000-3363.2007.05.012 URL [本文引用: 1] 摘要
黄河以其善淤、善决、善徙的个性,塑造了黄泛平原上独特的自然与人文景观。以黄泛平原的古代城镇为研究对象,探讨了黄河泛滥区城镇的洪涝灾害经验,总结了古代城市三大主要防洪治涝的适应性景观遗产:择高地而居,城墙和护城堤,以及蓄水坑塘。这些文化景观折射了黄泛平原特有环境下真实的人地关系,饱含着古人应对洪涝灾害的生存经验,对今天的城市水系治理、防洪治涝规划以及土地利用规划等仍大有裨益。
The flood and watering adaptive landscapes in ancient Chinese cities in the Yellow River Basin .https://doi.org/10.3969/j.issn.1000-3363.2007.05.012 URL [本文引用: 1] 摘要
黄河以其善淤、善决、善徙的个性,塑造了黄泛平原上独特的自然与人文景观。以黄泛平原的古代城镇为研究对象,探讨了黄河泛滥区城镇的洪涝灾害经验,总结了古代城市三大主要防洪治涝的适应性景观遗产:择高地而居,城墙和护城堤,以及蓄水坑塘。这些文化景观折射了黄泛平原特有环境下真实的人地关系,饱含着古人应对洪涝灾害的生存经验,对今天的城市水系治理、防洪治涝规划以及土地利用规划等仍大有裨益。
|

/
| 〈 |
|
〉 |