

1 引言
土壤水分(soil moisture, SM)是土壤-植物-大气连续体(Soil-Plant-Atmosphere Continuum, SPAC)水热传输的重要组成部分,也是全球气候系统的关键气候变量之一。土壤含水量的变化可引起地表反照率和土壤热性质的变化,从而影响地表能量平衡以及不同形式有效能量的分配。土壤水分与气候系统存在密切联系,气候变化可以改变土壤水分状况,而土壤水分的反馈作用又会影响区域未来的气候特征[1]。
Han等[4]和Tobin等[5]研究显示,估算土壤剖面水分时,简单的数据融合方法可以和复杂的数据同化技术一样有效。由维也纳科技大学和欧空局牵头建立的国际土壤水分网络(International Soil Moisture Network, ISMN)是全球最大的实测土壤水分数据库,截至2021年7月ISMN已涵盖71个网络和2842个站点[6]。地面观测准确度高且观测深度大,但费时费力,无法实现大范围连续观测。遥感作为一种可覆盖全球的观测手段,能克服地面观测的空间尺度问题,但有限的穿透深度被认为是其应用的限制因素。Qiu等[7]计算土壤水分与植被的互信息发现,深层土壤水分观测数据的增强信息可以通过表层观测数据的低通变换得到有效重现,表明遥感数据对探测深层土壤水分信息具有很大的潜力。因此,若能结合地面观测与遥感观测在空间尺度和垂向深度两方面的优势,先基于实测数据建立表层与深层土壤水分之间的联系,再引入遥感表层土壤水分数据,那么获取全国尺度上连续的土壤剖面水分信息是可以实现的[8]。本文将通过融合地面观测与遥感观测资料,建立一套中国长序列、多深度层次和较高空间分辨率的土壤剖面水分数据。
基于上述背景,本文的研究内容包括三部分:① 从ISMN获取中国范围内观测剖面较深、序列较长的实测土壤水分数据,利用随机森林回归算法建立不同季节不同深度土层的表层-深层土壤水分关系模型;② 引入ESA CCI SM(European Space Agency Climate Change Initiative Soil Moisture)表层土壤水分产品,以饱和含水量和凋萎系数作为约束条件对其进行值域校正,经实测数据验证后,将该产品输入模型反演中国各季节不同深度层次的土壤水分;③ 基于反演结果,分析中国1m土层贮水量的空间分布特征、季节分布模式、年际变化趋势、突变特征以及周期变化规律。
2 数据来源与研究方法
2.1 数据来源
2.1.1 实测土壤水分数据与气候分类数据
实测土壤水分数据下载自ISMN(
图1
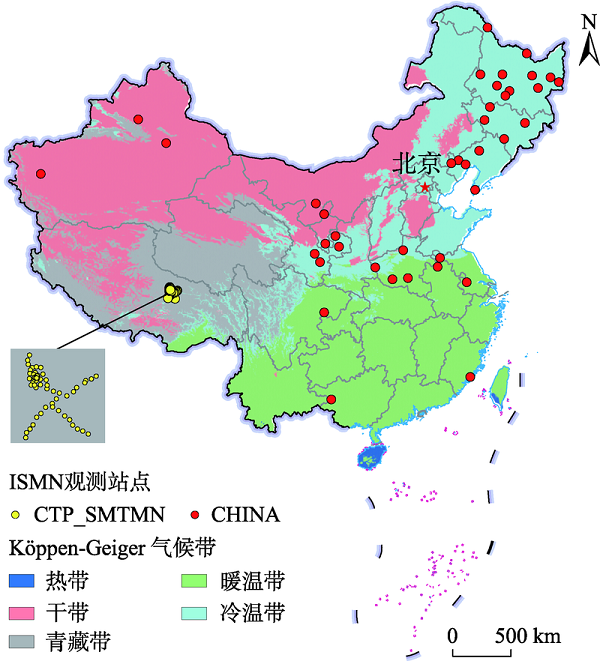
图1
ISMN土壤水分观测站点与Köppen-Geiger气候带的空间分布
注: 该图基于自然资源部地图技术审查中心标准地图(审图号为GS (2020)4619号)绘制,底图无修改。
Fig. 1
Spatial distribution of ISMN soil moisture observation stations and Köppen-Geiger climatic zones
2.1.2 ESA CCI SM被动遥感土壤水分产品数据
ESA CCI SM产品是欧空局Climate Change Initiative项目的一部分,旨在提供全球范围的卫星观测土壤水分数据集。本文使用2020年11月发布的ESA CCI SM v05.2。与以往版本相比,该版本在算法上有三点优化:加入了自2015年4月开始的SMAP(Soil Moisture Active Passive)数据、改进了CDF(Cumulative Distribution Function)匹配方法以及更新了AMSR2(Advanced Microwave Scanning Radiometer 2)传感器之间的尺度变换机制[19,20]。数据集包含主动产品、被动产品和融合产品,本研究选用被动产品,其传感器包括SMMR,SSM/I,TMI,AMSR-E,WindSat,AMSR2,SMOS和SMAP_radiometer。被动产品反演土壤水分的基础是陆地参数反演模型(Land Parameter Retrieval Model, LPRM),将被动微波传感器获取的观测亮温通过LPRM建立的微波辐射传输模型转换为土壤含水量[21]。数据的空间分辨率为0.25º,时间分辨率为日,选取的时间跨度为1980-01-01—2019-12-31。
2.1.3 基于世界土壤数据库的中国土壤数据集(v1.1)
世界土壤数据库(Harmonized World Soil Database, HWSD)由联合国粮农组织(Food and Agriculture Organization of the United Nations, FAO)和维也纳国际应用系统研究所(International Institute for Applied Systems Analysis, IIASA)建立。基于HWSD的中国土壤数据集(v1.1)[22]通过国家青藏高原科学数据中心下载(
图2
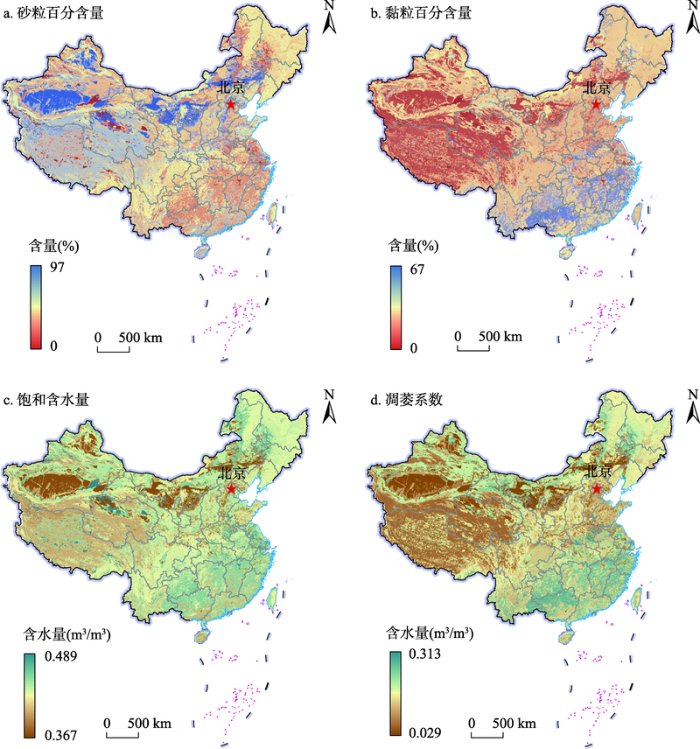
图2
HWSD砂粒与黏粒百分含量和有关的土壤水分常数
注:该图基于自然资源部地图技术审查中心标准地图(审图号为GS (2020)4619号)绘制,底图无修改。
Fig. 2
Percentage content of sand and clay and related soil water constants based on HWSD
2.2 研究方法
2.2.1 实测与遥感土壤水分数据的质量控制方法
ISMN提供的实测数据已按Dorigo等[23]的方法进行了质量控制,共划分4种质量标签。C表示观测数据取值范围不合理(例如土壤含水量为负值或超出饱和含水量),D表示结合其他地球物理参数判断观测数据存疑(例如土壤温度低于0℃或24小时内土壤含水量出现峰值但未伴随出现降水事件),M表示用于判断质量的相关参数缺失,G表示数据质量佳。为保证地面实测资料的准确性,本研究仅选择质量标签为G的实测数据进行分析。
ESA CCI SM产品自带8种质量标签(数字0~7),其中flag=0表示观测数据已经过检查且不存在质量问题,flag=1表示像元所在的土壤被雪覆盖或温度低于0℃,flag=2表示像元植被覆盖度高,flag=4表示存在其他质量问题(例如模型不收敛),其余4种标签表示上述三类质量问题的组合。在数据处理过程中,只考虑flag=0的数据,其余数据全部剔除。
然而,经过上述质量控制的ESA CCI SM产品仍无法满足应用需求。统计发现,在1980—2019年间,中国有6497个像元(占比42.31%)的最高值超过0.9 m3/m3,有11273个像元(占比73.42%)的最高值超过其理论饱和含水量,该产品对中国土壤水分存在明显高估。另外,有4132个像元(占比26.91%)的最低值等于0 m3/m3,有12617个像元(占比82.17%)的最低值低于其凋萎系数,说明产品在低含水量区间也可能存在大量不合理的偏低观测值。在使用该产品之前,本文利用饱和含水量和凋萎系数信息进一步校正其值域。饱和含水量和凋萎系数通过HWSD土壤质地数据与Koren等[24]的经验公式计算:
式中:
Dorigo等[23]对ISMN实测数据的值域控制方法是分别以0 m3/m3与饱和含水量作为土壤含水量的下限阈值和上限阈值,将负观测值和高于饱和含水量的观测值归为问题数据。本文首先按照上述方法对ESA CCI SM产品进行值域校正。该产品不存在负观测值,满足下限阈值,只需考虑上限阈值。剔除所有高于饱和含水量的观测值,此方法称为“单边剔除法”。由于单边剔除法对低于上限阈值的观测值全盘保留,因此属于一种不完全校正方法,无法校正遥感数据的总体偏差。此外,以0 m3/m3为下限阈值并不能改善遥感产品对低含水量区间的低估。针对上述问题,本文进一步对值域控制方法做了以下两点改进。
改进一:单边控制法。单边控制法的上下限阈值与单边剔除法相同,但不是简单地剔除数据,而是通过寻找一个与饱和含水量有关的校正系数,实现遥感观测值的总体校正。具体过程是:在极端湿润情况下,土壤含水量趋于饱和,此时像元存在理论饱和值和观测饱和值。将1980—2019年间最高观测值超过0.99 m3/m3的2438个像元定义为饱和像元,计算每个饱和像元的饱和含水量与遥感观测含水量的比值,该比值反映了理论值与观测值之间的偏离程度。对全部饱和像元的比值求平均,得到总体校正常数,从而对遥感数据的值域进行总体控制。但经过该方法校正后的遥感数据仍存在大量不合理的偏低观测值。
式中:
改进二:双边控制法。先利用凋萎系数对低含水量区间进行调整,再利用饱和含水量对高估偏差进行校正。具体实现过程是:首先将1980—2019年间最低观测值为0 m3/m3的4132个像元定义为干旱像元,计算每个干旱像元的凋萎系数与遥感观测值的差值并求平均。所有原始遥感观测值都加上该平均差值,使值域整体上调。将单边控制法中加上平均差值之后的2438个饱和像元定义为双边控制法的饱和像元,按照相同的思路得到新的总体校正常数。经过双边控制之后,最低观测值介于0 m3/m3和凋萎系数之间,最高观测值不超过饱和含水量,同时解决了高低值两端取值不合理的问题。
式中:
2.2.2 土壤剖面水分的表征方式
实测与遥感土壤水分数据都是以体积含水量表示,本文根据刘苏峡等[25],将体积含水量转换为土壤贮水量。将土壤剖面划分为K个观测层次,对于第k层(1≤ k ≤K):
式中:
计算时,将0~5 cm与5~10 cm两个土层合并为0~10 cm。
2.2.3 ESA CCI SM产品数据准确性的验证方法
ESA CCI SM产品是反演土壤剖面水分的基础,有必要先基于实测数据验证其准确性。按照2.1.1章节的时间归类方法,将日尺度的ESA CCI SM数据转化为旬尺度。两个ISMN数据库的观测时段不重叠,需要分开验证。CHINA数据库的金县站和晋江站遥感观测值缺测严重,将其剔除,其余38个站点参与验证,验证时段为1984-05-18—1992-07-28。选取CTP_SMTMN数据库大尺度网络的38个站点参与验证(编号为那曲L01~那曲L38),验证时段为2010-07-28—2016-09-18。取像元内的一个站点或多个站点的平均值对遥感观测值进行验证,CHINA数据库的38个站点分布在38个像元内,CTP_SMTMN数据库的38个站点分布在12个像元内。同一像元内的多个站点使用其名称组合来命名,例如那曲L36/37/38。将原始的ESA CCI SM产品数据以及经过单边剔除法、单边控制法和双边控制法校正处理的产品数据分别与上述两套实测数据对比,使用皮尔逊相关系数(Pearson Correlation Coefficient, R)、平均绝对误差(Mean Absolute Error, MAE)与均方根误差(Root Mean Square Error, RMSE)评价遥感数据和实测数据的一致性。选择R最大、MAE和RMSE最小的值域控制方法作为该产品的最佳校正方法。
2.2.4 表层-深层土壤水分关系的随机森林回归建模
随机森林回归模型有两个关键参数需要优化:决策树数量(ntree)和每个节点输入的变量数量(mtry),二者直接影响模型的预测精度[12]。本研究仅基于表层土壤水分反演深层土壤水分,不借助其他辅助变量,因此随机森林模型只有一个自变量(即表层土壤水分),mtry设置为1。由于自变量构成简单,参数优化过程得到极大简化。mtry确定后,以模型误差随着决策树数量的增加从某一数值处开始趋于稳定为判断标准确定最优的ntree。其他参数采用缺省值。随机森林中的每棵决策树都参与预测,取所有决策树预测结果的平均值作为最终预测值。
CHINA数据库共有40个站点,选取其中37个观测深度为0~100cm的站点(晋江、金县和锡林郭勒站由于观测深度不足100cm,暂不考虑),并另外从站点呈“X”型分布的CTP_SMTMN数据库大尺度网络中选取5个在空间上相距较远的站点,两个数据库合计42个站点共同参与随机森林回归建模。42个站点中各有5个,5个,6个和26个站点分布于干带、青藏带、暖温带和冷温带,涵盖了中国最主要的四大气候带,且每个站点的资料长度都在5年以上,绝大部分站点的最大观测深度达到100 cm,具有较高的时空代表性。将42个站点的观测数据按季节分类,以4:1的比例划分训练集和验证集,对4个季节的9个土层组合(0~10 cm与0~20 cm、0~10 cm与0~30 cm,…,0~10 cm与0~100 cm)建立36个表层-深层土壤水分关系模型。将1980—2019年的ESA CCI SM日尺度表层土壤水分产品整理为旬尺度并按季节分类,输入上述36个随机森林回归模型,反演全国不同季节0~20、0~30,…,0~100 cm土层的土壤贮水量。使用平均绝对百分比误差(Mean Absolute Percentage Error, MAPE)、决定性系数(Coefficient of Determination, R2)和纳什效率系数(Nash-Sutcliffe Efficiency, NSE)评价模型精度。随机森林回归通过R的randomForest程序包实现。
2.2.5 土壤水分时间序列的突变检验方法
先利用Mann-Kendall法获取土壤水分序列中可能的突变点,再依次设置步长为3年,4年,5年和6年,利用滑动t检验对突变点进行验证。
2.2.6 土壤水分时间序列周期分析的小波分析方法
3 结果分析
3.1 基于双边控制法校正后的ESA CCI SM产品的准确性验证结果
分别用2.2.1章节提及的单边剔除法、单边控制法和双边控制法对ESA CCI SM产品进行值域校正,发现双边控制法效果最佳(三种方法的校正效果对比分析详见4.1章节)。经过双边控制法校正后,ESA CCI SM产品数据与CHINA数据库实测数据比较R、RMSE和MAE的平均值分别为0.26、0.08 m3/m3和0.07 m3/m3。参与验证的38个站点中,R最大值为0.58,15个站点R>0.3,27个站点通过p=0.05显著性检验,其中21个站点通过p=0.001显著性检验。另外,29个站点RMSE<0.10 m3/m3,仅3个站点RMSE>0.11 m3/m3。
ESA CCI SM产品数据与CTP_SMTMN数据库实测数据比较R、RMSE和MAE的平均值分别为0.76、0.06 m3/m3和0.05 m3/m3,全部站点都通过p=0.0001显著性检验。ESA CCI SM产品与CTP_SMTMN数据库的拟合效果更好,这是因为西藏那曲地区90%以上被高寒草地覆盖,植株低矮且生物量低,不会导致微波信号的明显衰减,是土壤水分微波遥感的理想场地[15]。分不同气候带来看,ESA CCI SM产品的准确性在青藏带最高,冷温带次之,在极端干旱的干带和极端湿润的暖温带最低,与Dorigo等[19]的研究结果一致。图3对比了四大气候带中9个相关系数较高的站点的遥感观测值和实测值。ESA CCI SM产品对土壤水分的时间变化具有较好的重现能力(图4)。
图3
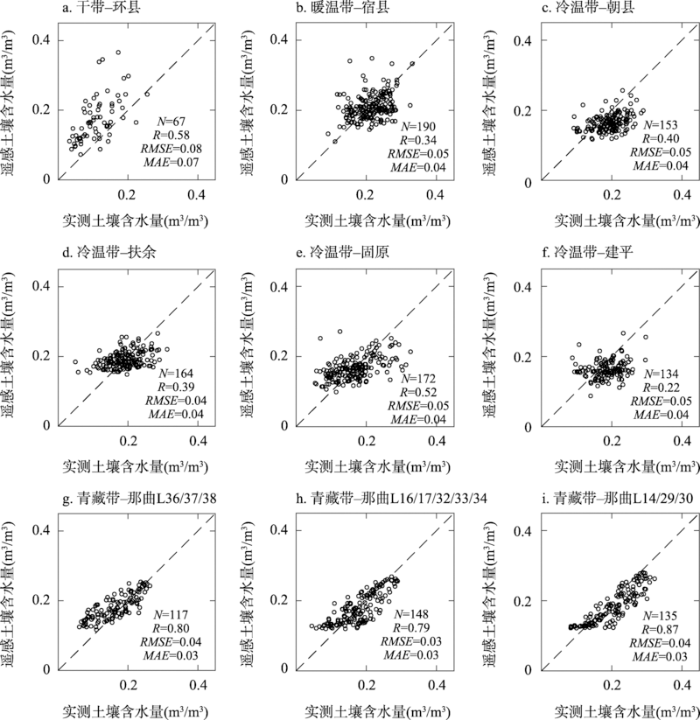
图3
实测与遥感土壤含水量的散点分布
Fig. 3
Scatter plots of in-situ observed and remotely sensed soil water content
图4
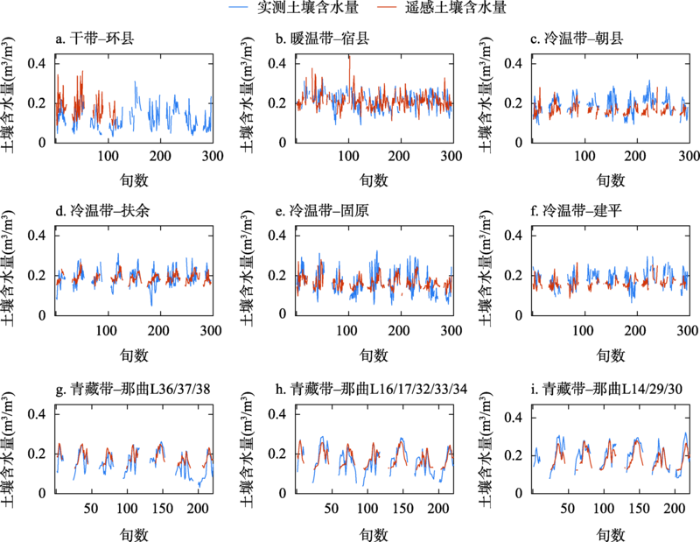
图4
实测与遥感土壤含水量的时间序列分布
注:
Fig. 4
Time series of in-situ observed and remotely sensed soil water content
受以下因素的影响,利用实测数据验证ESA CCI SM产品的准确性存在较大困难。其一,时间连续性与时间尺度差异。CTP_SMTMN数据库的土壤水分传感器可以逐小时连续观测,而遥感观测只能反映某一时间点的瞬时状态。实测数据和遥感数据时间尺度的本质差异也导致二者不可能完全匹配。其二,下垫面信息差异。实测数据为点尺度,遥感数据为像元尺度,后者包含的空间信息更丰富[28]。其三,中国复杂的地形会严重影响微波信号[29]。另外,验证时段内若因数据严重缺测导致样本量下降,也会使遥感数据的准确性降低,此时验证结果不能完全代表真实情况。例如,CHINA数据库的验证时段共296旬,未通过p=0.05显著性检验的11个站点中,有8个站点的样本量都不超过75旬。RMSE最大的敦化站(0.17 m3/m3)和嘉荫站(0.15 m3/m3)分别只有44和26旬的样本量。在前人研究中,ESA CCI SM产品与地面实测数据的相关系数偏低是普遍现象[29,30]。从上述验证结果来看,本文认为经过双边控制法校正后的ESA CCI SM产品的准确性可以接受。
3.2 基于随机森林回归的土壤水分反演模型的时空效果评价
3.2.1 模型在时间上的反演效果评价
36个表层-深层土壤水分关系模型总体上精度较高,共有27个模型训练集的R2和NSE高于0.6(图5a),分别有23个和34个模型的MAPE低于15%和20%。由于使用的是两套实测土壤水分数据库合并之后的数据,而地表以下40~100 cm仅有CHINA数据库有数据,因此各指标数值从40 cm到50 cm出现微小反弹,但总体上仍表现为土层越深估算效果越差。原因是随着深度增大,表层土壤水分与深层土壤水分之间的关联减弱,导致模型精度下降。对各土层的反演R2求平均来看,表层-深层土壤水分关系模型的精度在不同季节总体上表现为:秋季>夏季>春季>冬季,从表层土壤水分估算深层土壤水分的准确性在秋季最高,冬季最低(图5a)。
图5
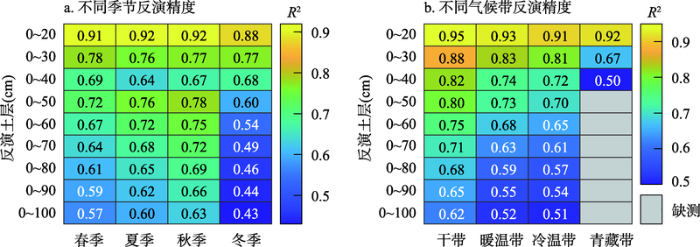
图5
随机森林回归模型在不同季节和不同气候带的反演精度
Fig. 5
Accuracy of random forest regression models in different seasons and climatic zones
3.2.2 模型在空间上的反演效果评价
本文通过合并各气候带的站点资料建立全国尺度上的通用模型,有必要基于实测数据验证该通用模型在各气候带的反演效果。由于绝大部分站点在冬季严重缺测,因此仅考虑春季、夏季与秋季。将三个季节的验证结果求平均得到单个站点的验证结果,再对同一气候带内的全部站点求平均得到每个气候带的验证结果。通用模型在各气候带的反演效果总体较好,反演精度都随深度增加而降低。在0~40 cm范围内,通用模型的准确性表现为干带>暖温带>冷温带>青藏带,在0~100 cm范围内表现为干带>暖温带>冷温带(图5b)。
3.3 中国土壤水分的时空变化特征
3.3.1 土壤水分的垂向变化特征
将反演结果整理为1980—2019年的逐年序列,得到全国0~10、0~20、0~30、0~40、0~50、0~60、0~70、0~80、0~90和0~100cm共10个深度层次土壤贮水量的多年平均值和标准差分别为1.64±0.11、3.50±0.21、5.29±0.30、7.13±0.38、10.04±0.46、12.25±0.54、14.47±0.62、16.75±0.69、19.05±0.76和21.36±0.83 cm。通过计算不同深度的10cm土层(0~10、10~20、20~30、30~40、40~50、50~60、60~70、70~80、80~90和90~100 cm)土壤贮水量的多年平均值,分析土壤水分的垂向变化特征。
根据土壤水分的垂向变化特征(图6)可将土壤剖面划分为三层:波动层(0~40 cm)、跃变层(40~60 cm)和稳定层(60~100 cm)。波动层内土壤水分随深度增加而波动上升。跃变层内土壤水分变化急剧,先陡增后骤降形成最大土壤水分梯度,原因可能是上下层土壤质地和持水能力存在明显差异。土壤水分最高值出现在50 cm深度处,与已有研究一致[31,32]。稳定层受水文气象过程的影响较小,土壤水分变化平缓。表层和深层土壤相对干燥,中间层土壤相对湿润,形成这种垂向分布模式的原因可能是:表层土壤蒸发强烈,且降水易下渗,不易保存水分;中间层土壤蒸发较弱,且大气降水和冰雪融水下渗补给充足,持水能力好;深层土壤远离地表,降水的补给作用不明显[33]。由于本文建立的土壤水分反演模型是全国尺度上的通用模型,因此不同地区的土壤水分具有相似的垂向变化特征(图6)。
图6
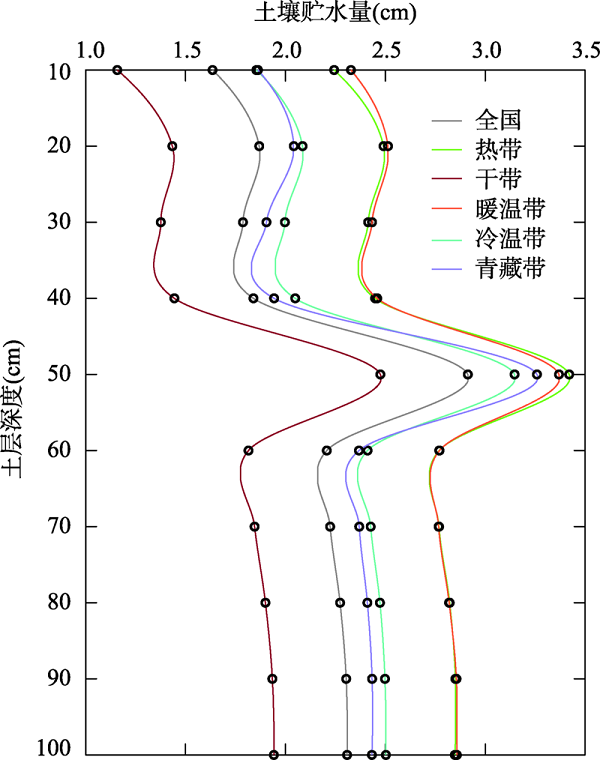
图6
不同气候带土壤贮水量的垂向变化
Fig. 6
Vertical variation of soil water storage in different climatic zones
3.3.2 土壤水分的水平分布特征
中国不同深度层次的土壤水分都表现出自西北向东北与东南地区递增的分布格局(图7),与前人研究得到的宏观分布格局一致[34⇓-36]。随着剖面累加深度增大,土壤干燥区的面积不断减小(图7)。土壤水分的高值中心主要分布在东南地区、东北平原和藏东南地区,低值中心分布在三大内陆盆地、内蒙古中西部、陕西北部和藏西北地区(图7)。值得留意的是,四川省中部有一条明显的西南-东北走向的土壤干燥带,其在Lu等[35]的研究中也有体现。该干燥带的形成原因尚不清楚,初步推测可能是由于两侧海拔高度相差悬殊,恶劣的地形条件不利于土壤发育和植被生长,导致土壤持水性能差、土壤含水量低。然而目前大部分研究都未识别出该干燥带,其真实性有待进一步验证。
图7
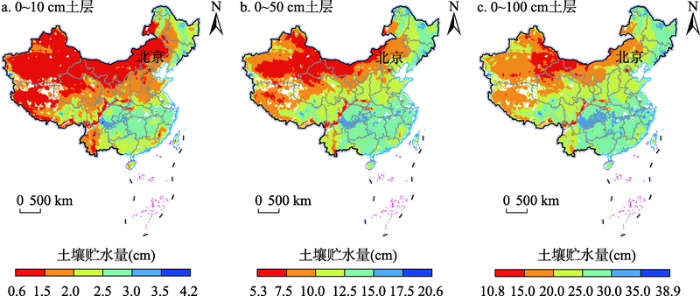
图7
不同深度土层多年平均土壤贮水量的空间分布
注: 该图基于自然资源部地图技术审查中心标准地图(审图号为GS (2020)4619号)绘制,底图无修改。
Fig. 7
Spatial distribution of multi-year average soil water storage in different soil layers
图8
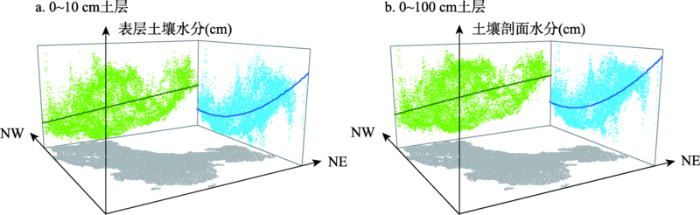
图8
多年平均表层土壤水分和土壤剖面水分的空间变化趋势示意
Fig. 8
Diagram of spatial trend of multi-year average surface soil moisture and profile soil moisture
从不同气候带来看,表层土壤水分和土壤剖面水分都表现为热带和暖温带最高,冷温带和青藏带次之,干带最低(图9)。土壤水分的空间变异程度干带最大,青藏带和冷温带次之,热带和暖温带最小,空间变异都随深度增加而减弱(图9)。寒旱区土壤较干燥且空间变异较大,暖湿区土壤较湿润且分布较均一。具体来看,在干带,土壤水分在“三山夹两盆”地形区呈现干湿交替分布。在青藏带,藏东南和藏西北地区的土壤干湿状况存在明显差异。在冷温带,东北地区与内蒙古东部地区差异较大(图7)。土壤水分的空间变异与气候带面积有关。变异程度最小的热带占全国国土面积的比例也最小(0.31%),变异程度最大的干带占国土面积的比例也最大(34.86%)。此外,土壤含水量及其空间变异程度也与下垫面植被类型有关。Fan等[37]研究表明,森林土壤含水量最高且变化范围最小,荒漠土壤含水量最低且变化范围最大,草甸和草原居中。热带和暖温带是典型森林区,土壤水分空间均一性高。干带是典型荒漠/草原区,土壤水分空间变异强烈。
图9
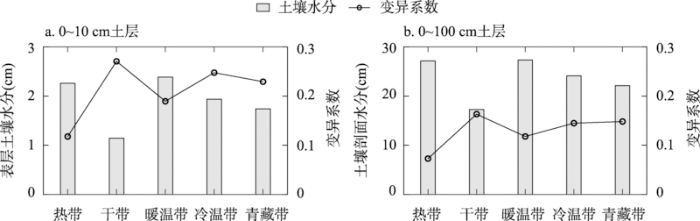
图9
不同气候带多年平均表层土壤水分和土壤剖面水分的平均值与空间变异系数
Fig. 9
Mean and spatial coefficient of variation of multi-year average surface soil moisture and profile soil moisture in different climatic zones
图10
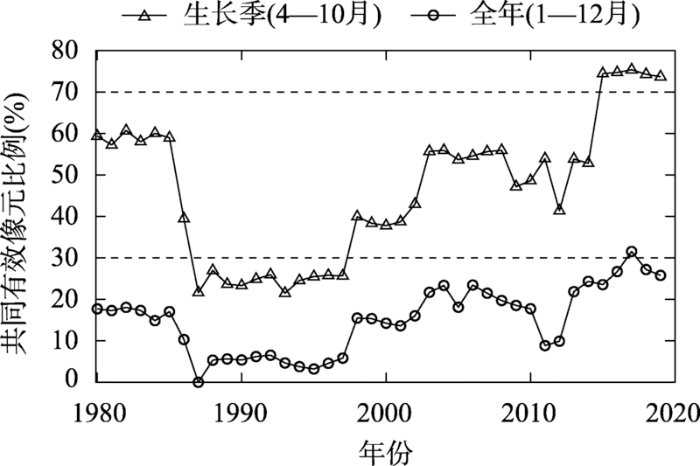
图10
ESA CCI SM产品在全年和生长季的共同有效像元比例
Fig. 10
Common effective pixel ratio of ESA CCI SM product for the whole year and growing season
3.3.3 土壤水分的季节分布模式
比较不同季节的土壤水分时需保证样本量相同,此时应选取各月份的共同有效像元。共同有效像元是指在各时段内都有观测数据的像元。由于冬季遥感数据缺测严重,将4—10月定义为生长季,分别统计1980—2019年全年和生长季的共同有效像元比例。发现全年的共同有效像元的比例基本都低于30%,而生长季的共同有效像元比例较高,尤其是2015—2019年都超过70%(图10)。因此以2015—2019年生长季为研究时段,通过计算每个月份的5年平均值来探讨中国土壤水分的季节分布模式。
表层土壤水分和土壤剖面水分的季节变化具有同步性。热带、干带和青藏带的土壤水分在夏季最高,其中干带和青藏带具有明显的单峰型变化特征。暖温带和冷温带的土壤水分则在夏季最低,具有截然不同的季节分布模式。从全国来看,土壤在夏季最湿润(图11)。
图11
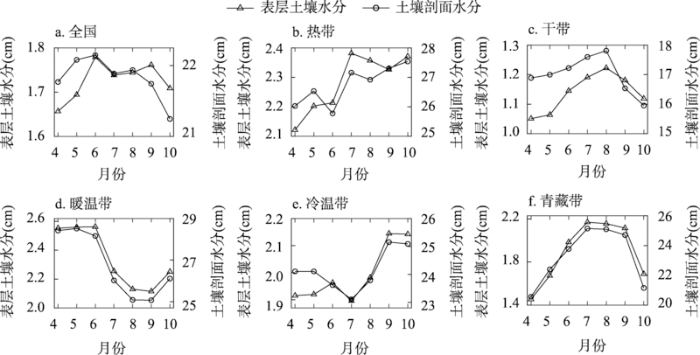
图11
表层土壤水分和土壤剖面水分的季节分布
Fig. 11
Seasonal distribution of surface soil moisture and profile soil moisture
3.3.4 土壤水分的年际变化趋势
基于1980—2019年春季(3—5月)、夏季(6—8月)、秋季(9—11月)、冬季(12月至次年2月,2019年冬季用2019年12月表示)、生长季(4—10月)和全年平均的时间序列计算土壤水分的变化趋势,表层土壤水分和土壤剖面水分的变化趋势基本一致(表1)。热带的土壤水分除了在春季变化趋势不显著,在其他时间都显著上升。干带的土壤水分在夏季显著上升,在春季、冬季和全年显著下降。暖温带和冷温带的土壤水分分别在秋季和冬季显著下降,在夏季都显著上升。青藏带的土壤水分在夏季显著上升,在春季和秋季显著下降(表1)。全国的年平均土壤水分呈下降趋势,与张蕾等[32]研究一致。全国土壤水分在夏季显著上升,在冬季显著下降,呈现“湿季愈湿,干季愈干”的变化规律。热带呈湿润化趋势,干带和青藏带呈干燥化趋势,全国土壤水分呈现“湿区愈湿,干区愈干”的空间特征。Lai等[36]发现1961—2010年中国湿润区土壤湿度增加,干旱/半干旱区土壤湿度减小,与本文结论一致。Dore[38]研究指出,降水集中度减小可能导致干旱地区更干旱,湿润地区更湿润。赵东升等[39]研究表明,1960—2018年全国降水集中度显著减小,干湿空间分异加剧,这可能是导致土壤水分“干区愈干,湿区愈湿”的重要原因。从距平图(图12)来看,全国冬季和夏季土壤水分在1986年/1987年附近由正距平转为负距平,1990s是夏季和冬季土壤最干燥的年代。夏季土壤水分于1997年达到最低值,并于1998年由负距平转为正距平。
表1 1980—2019年表层土壤水分和土壤剖面水分的变化趋势
Tab. 1
| 地区 | 全年 | 春季 | 夏季 | 秋季 | 冬季 | |||||||||
|---|---|---|---|---|---|---|---|---|---|---|---|---|---|---|
| 表层 | 剖面 | 表层 | 剖面 | 表层 | 剖面 | 表层 | 剖面 | 表层 | 剖面 | |||||
| 全国 | -0.03 | -0.25 | -0.03 | -0.21 | 0.04* | 0.27* | -0.02 | -0.11 | -0.13** | -0.94** | ||||
| 热带 | 0.07** | 0.48** | 0.03 | 0.20 | 0.06** | 0.47** | 0.08** | 0.72** | 0.09** | 0.52** | ||||
| 干带 | -0.02** | -0.16** | -0.02** | -0.13** | 0.02** | 0.13** | 0.00 | -0.04 | -0.06** | -0.58** | ||||
| 暖温带 | 0.00 | 0.05 | 0.01 | 0.06 | 0.07** | 0.50** | -0.04* | -0.26 | -0.03 | -0.10 | ||||
| 冷温带 | 0.00 | 0.01 | -0.01 | -0.02 | 0.03* | 0.20* | 0.01 | 0.13 | -0.04* | -0.28** | ||||
| 青藏带 | -0.02 | -0.16 | -0.05** | -0.38** | 0.04* | 0.32* | -0.06* | -0.48* | -0.02 | -0.08 | ||||
注:*和**分别表示在0.05和0.01水平上显著;大部分地区生长季土壤水分的变化趋势不显著,故不列入表中。
图12
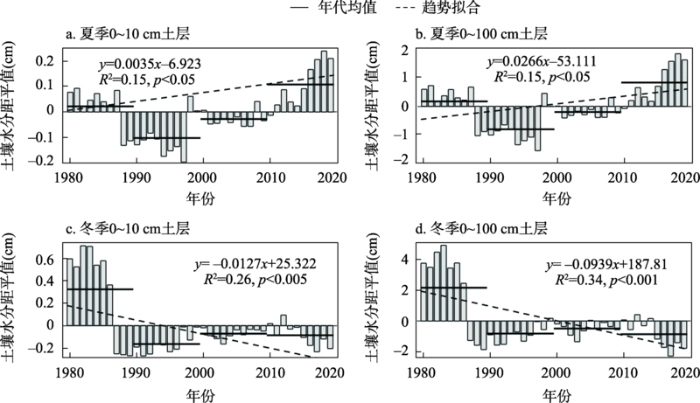
图12
1980—2019年全国夏季与冬季的表层土壤水分和土壤剖面水分距平
Fig. 12
Surface soil moisture anomaly and profile soil moisture anomaly in summer and winter from 1980 to 2019 in China
3.3.5 土壤水分的突变特征
热带和干带是土壤水分变化趋势最显著的地区(表1),下文进一步分析其突变特征。用M-K法找出可能的突变点后,结合4种步长的滑动t检验进行验证。由于序列首尾两端具有不确定性,仅考虑位于1984—2015年的突变点。当有2种或2种以上滑动t检验的判断结果与M-K法一致时,确认其为突变点。
热带全年、春季、夏季、秋季、冬季和生长季的表层土壤水分/土壤剖面水分分别在2007年/2006年、2008年/2008年、2009年/2008年、2004年/2004年、2007年/2007年和2007年/2006年发生突变,表层土壤水分和土壤剖面水分的突变时间基本一致。之后UF统计量不断上升并突破临界值,土壤显著变湿。罗红霞等[40]发现海南7个站点的相对湿度和降水量在2005年前后都出现陡增。因此热带土壤在2004—2009年的湿润化突变可能是对气候湿润化的响应。
干带共检测出4个突变点。夏季的表层土壤水分和土壤剖面水分分别在1985年和1986年发生突变,此后土壤显著变湿。冬季和全年的土壤剖面水分分别在2014年和2013年发生突变,此后土壤显著变干。1985年/1986年的湿突变主要受气候湿润化突变的影响。西北地区在1986年左右经历了由干转湿的气候跃变,此后年降水量和夏季降水量显著增加[41⇓-43]。2013年/2014年的干突变可能与西北地区显著增温有关。李哲等[44]研究发现西北地区在1998—2012年出现了与全球一致的变暖停滞现象(Global Warming Hiatus)。Hiatus结束后西北地区气温迅速上升,且冬季的升温幅度最大,导致土壤蒸发快速增强,土壤水分显著下降。
3.3.6 土壤水分的周期变化特征
表2 表层土壤水分与土壤剖面水分的主要周期
Tab. 2
| 地区 | 全年 | 春季 | 夏季 | 秋季 | 冬季 | 生长季 | |||||||||||
|---|---|---|---|---|---|---|---|---|---|---|---|---|---|---|---|---|---|
| 表层 | 剖面 | 表层 | 剖面 | 表层 | 剖面 | 表层 | 剖面 | 表层 | 剖面 | 表层 | 剖面 | ||||||
| 全国 | — | — | 5 | 5 | 5 | 5 | 4 | 4 | — | 12 | 7 | 7 | |||||
| 热带 | 6/2 | 7/2 | 8 | 8 | 6 | 6 | 5/2 | 6/2 | 5 | 9/2 | 6/2 | 7 | |||||
| 干带 | 11/8/3 | — | 8/3 | 8/5/3 | 11/5/2 | 11/5/2 | 7 | 7 | 11 | 11 | 2 | 7/2 | |||||
| 暖温带 | 12/7/3 | 7/3 | 7 | 7 | 7/2 | 7/2 | 12/5/3 | 12/5/3 | 12/3 | 12/6/3 | 7 | 7 | |||||
| 冷温带 | 10 | 10 | 10/5 | 10/5 | 6/9 | 6/10 | 10 | 9 | 11/4 | 11 | 9 | 9/6 | |||||
| 青藏带 | 5 | — | 11/6 | 11/6/4 | 5/8 | 5/8 | 4 | 4 | 11/4 | 7/12/3 | 5 | 5/8 | |||||
注:“—”表示在研究时段内未识别出周期。
中国土壤水分的周期特征和气候要素(尤其是降水)的周期特征有较高的相似性。李启芬等[45]研究表明,1981—2017年北方(大致对应本文的冷温带和干带)的夏季降水具有9~11年和5~6年周期,南方地区(大致对应本文的暖温带)的夏季降水具有7~8年周期,与本文夏季土壤水分主周期高度相似。刘扬等[46]发现西北干旱区的年降水量在1980s之后表现出稳定的11年主周期,卢鹤立等[47]在青藏高原夏季降水序列中识别出5年的基本周期,都与本文研究结果相符。另外,青藏高原地区土壤水分的周期变化特征还与气温存在密切联系。韦志刚等[48]研究指出,1980s之后青藏高原冬春季气温和夏季气温分别表现出11年和5~8年周期,基本对应青藏带各季节土壤水分的周期。
4 讨论
4.1 不同值域控制方法对ESA CCI SM产品的校正效果比较分析
图13
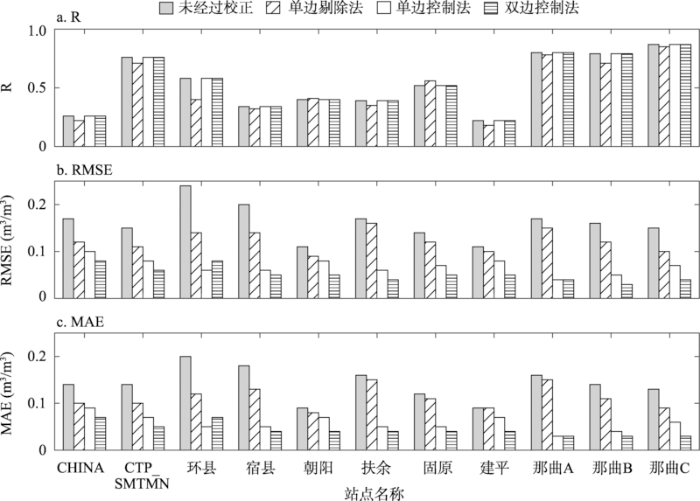
图13
不同值域控制方法对ESA CCI SM产品的校正结果
注:那曲A表示那曲L36/37/38站,那曲B表示那曲L16/17/32/33/34站,那曲C表示那曲L14/29/30站。
Fig. 13
Correction results of ESA CCI SM product by using different methods for range constraining
4.2 土壤剖面水分反演的不确定性分析
有限的地面实测资料是区域土壤水分时空变化研究中普遍面临的问题。为使实测数据的覆盖面更广、代表性更高,本文融合了两个观测网络,但由于站点仍然有限且空间分布不均,个别气候带的样本量偏少甚至无样本,仅能建立全国尺度上的通用反演模型。Gao等[2]基于CDF匹配构建了从表层土壤水分估算土壤剖面水分的方法,该方法在不同气候区的估算精度存在明显差异,原因是表层-深层土壤水分之间的关联强度在很大程度上受气候影响。本文建立的通用模型没有考虑表层-深层土壤水分关系的空间分异性,但从反演精度的验证结果来看,其在各气候带依然具有较好的适用性。为了弥补空间上的局限性,本文从时间角度对不同季节分别建模。未来若能获取更全面的实测资料,通过兼顾表层-深层土壤水分关系在不同气候带和不同季节的差异,将会获得更加准确的反演结果。另外,本文基于随机森林回归建立的反演模型结构简单,使用的自变量仅有表层土壤水分。在未来研究中,可进一步考虑气候条件、土壤质地和土地覆盖类型等因素对土壤水分的影响,以提高土壤剖面水分反演精度,并充分发挥机器学习方法处理多变量复杂问题的优势。
作为目前国际上时间序列最长的遥感土壤水分资料之一,ESA CCI SM产品为深入了解地球系统提供了重要的数据支撑。但该产品的数据有效率并不高,几乎每景数据都存在大面积缺测,冬季缺测尤为严重。中国一些地区在冬季同时缺失地面观测和遥感观测资料,融合多源资料的优势在这些地区无法体现。受数据缺测的影响,冬季土壤水分的反演效果比其他季节差,分析结果的可靠性也有所降低。目前很多研究都无法有效解决数据缺测问题,在进行时空分析时往往仅以夏季为研究对象[34,36]。本文在比较不同季节的土壤水分时选取有效像元比例最高的时期作为研究时段,并另外对生长季进行了分析。这可以在一定程度上减小数据缺测对研究结果的影响,但仍未从根本上解决问题。如何实现冬季土壤水分的多源连续观测依然是需要努力攻克的难题。另外,ESA CCI SM产品对中国地区土壤水分存在明显的高估,不宜直接使用。本文以土壤水分常数(饱和含水量和凋萎系数)作为约束条件对该产品进行了值域校正,在不减小相关系数的前提下有效降低了RMSE和MAE,使其取值更加合理。本文提出的“双边控制法”操作简便、意义明确,并给出了该产品具体的校正常数,可以为相关研究提供参考。其他类型的土壤水分产品也可以按照相同的思路对其值域进行合理性判断和校正处理。
表层和深层土壤水分在某些情况下(如持续干旱)可能会出现解耦,此时表层土壤水分难以反映深层土壤水分状况,二者联系减弱,相关性较差[55]。因此在建立关系模型时,若能考虑二者的耦合/解耦问题,将会得到更理想的估算结果,这将是未来研究的方向之一。
5 结论
本文通过融合地面观测与遥感观测资料,使用随机森林回归算法建立了一套中国地区长序列、多深度层次和较高空间分辨率的土壤剖面水分数据,并基于该数据分析了中国1m土层贮水量的时空变化特征。
ESA CCI SM产品与实测数据总体上匹配较好,二者具有相似的时间动态变化,但遥感产品对中国土壤水分存在明显高估。结合饱和含水量和凋萎系数进行值域校正的“双边控制法”可以有效降低该产品的高估偏差。ESA CCI SM产品在青藏高原地区准确性最高。
随机森林回归模型的反演精度随着土层深度增加而降低。秋季反演的准确性最高,夏季和春季次之,冬季最低。模型在干带精度最高,暖温带和冷温带次之,在青藏带最低。
中国0~10、0~20、0~30、0~40、0~50、0~60、0~70、0~80、0~90和0~100cm 10个深度层次土壤贮水量的多年平均值及标准差分别为1.64±0.11、3.50±0.21、5.29±0.30、7.13±0.38、10.04±0.46、12.25±0.54、14.47±0.62、16.75±0.69、19.05±0.76和21.36±0.83 cm。土壤水分呈现明显的分层,即波动层(0~40cm)、跃变层(40~60 cm)和稳定层(60~100 cm)。中国1m土层贮水量具有自西北向东北和东南方向递增的分布格局。寒旱区土壤较干燥且空间变异程度较大,暖湿区土壤较湿润且空间分布更加均一。
夏季是热带、干带和青藏带土壤水分的湿季,却是暖温带和冷温带土壤水分的干季。过去40年,热带土壤呈湿润化趋势,干带和青藏带土壤呈干燥化趋势,即“湿区愈湿,干区愈干”。全国1 m土层贮水量在夏季上升,在冬季下降,即“湿季愈湿,干季愈干”。热带土壤在2004—2009年显著变湿,干带夏季土壤水分在1985—1986年显著上升,冬季和年平均土壤水分在2013—2014年显著下降。中国1m土层贮水量最常见的年际变化周期和年代际变化周期分别为5年和11年。
致谢
真诚感谢两位匿名评审专家在论文评审中所付出的时间和精力,评审专家对本文的研究在数据质量控制、随机森林算法表述和研究结果的合理性解释等方面提出了宝贵的修改意见,使本文获益匪浅。
参考文献
Impact of soil moisture-climate feedbacks on CMIP5 projections: First results from the GLACE-CMIP5 experiment
Testing of observation operators designed to estimate profile soil moisture from surface measurements
High spatial resolution simulation of profile soil moisture by assimilating multi-source remote-sensed information into a distributed hydrological model
Benchmarking a soil moisture data assimilation system for agricultural drought monitoring
Validation of a new root-zone soil moisture product: Soil MERGE
Soil MERGE (SMERGE) is a 0.125 degrees, root-zone soil moisture (RZSM) product (0-40-cm depth) generated within the contiguous United States (CONUS). This product is developed by merging RZSM output from the North American land data assimilation system (NLDAS) with surface satellite retrievals from the European Space Agency Climate Change Initiative. SMERGE, at present, spans four decades (1979-2016). Here, we introduce the SMERGE approach and describe the validation of SMERGE RZSM estimates using three geophysical observations: 1) comparison with sparse in situ soil moisture data acquired from the soil climate analysis network (SCAN) and the U.S. Climate Reference Network (USCRN); 2) ranked correlation analysis against normalized difference vegetation index (NDVI) datasets; and 3) ranked correlation analysis of antecedent RZSM with storm-event streamflow across a range of precipitation intensities (5-45 mm/day). Relative to in situ SCAN and USCRN observations, SMERGE has an average daily correlation of 0.7-0.8 and unbiased root-mean square error close to 0.04 m(3)/m(3)-a level that is commonly applied as a validation target for large-scale soil moisture datasets. NDVI benchmarking allows us to indirectly evaluate SMERGE across CONUS and reveals it can predict near-term vegetation health anomalies with skill comparable to that of RZSM products generated by more complex data assimilation methods. In addition, streamflow-based evaluation results demonstrate that SMERGE antecedent RZSM can be used as a reliable predicator of storm-event runoff efficiency for rainfall events >25 mm/day.
The international soil moisture network: Serving earth system science for over a decade
The impact of vertical measurement depth on the information content of soil moisture times series data
中国根层与表层土壤水分关系分析
DOI:10.3724/SP.J.1258.2013.00001
[本文引用: 2]

根层与表层土壤水分的关系, 是由较易获取的表层土壤水分信息去探讨较难获取的深层土壤水分信息的重要桥梁。已有的根层与表层土壤水分关系(简称根表关系)大都基于一种作物或一种生态系统。该文根据我国生态系统研究网络, 包括森林、草地、农田、荒漠和沼泽生态系统的31个站点109个观测场2006年全年3 437对根层和表层土壤水分数据, 研究了根表关系以及生态系统、土壤质地、湿润度、植被、土壤厚度和土壤水分量级对根表关系的影响。研究发现, 表层和根层土壤水分存在着线性关系。森林和沼泽的根层与表层土壤水分相关程度较高, 无论是率定段还是校核段, 其决定系数(R<sup>2</sup>)均大于0.79。农田和草地生态系统的率定段相关性较好, R<sup>2</sup>均大于0.80, 校核段相关性稍弱, R<sup>2</sup>分别为0.70和0.50。荒漠生态系统的相关关系最弱, 率定段的R<sup>2</sup>为0.62, 校核段的R<sup>2</sup>为0.49。土壤质地和生态系统因素对根表关系的影响较为一致。半湿润带、半干旱带和干旱带的根表关系空间分异性最强; 十分湿润带的根表关系与壤土和森林生态系统的根表关系相对应。湿润带内部的根表关系较为一致。将植被对根表关系的影响分为4类, 前两类为根表关系微弱的植被, 由植被本身或者植被以外的地域因素导致, 不适合用根表关系去由表层推算根层土壤水分; 后两类为根表关系良好植被, 区别为服从和不服从关系总线, 可分别用各自的根表关系或者关系总线从表层土壤水分获取根层土壤水分。表层土壤水分与0–20、0–30、……、0–100 cm土层的土壤水分均分别具有较好的相关关系, 但二者的相关性随土层厚度的增加而降低。不过, 即使是土层厚度抵及100 cm, R<sup>2</sup>仍能维持在0.79。通过将土壤水分分别除以所有观测数据的最大值(“标甲”法)和各个生态系统数据的最大值(“标乙”法), 发现根表关系不受土壤水分量级本身的影响。
Relationship analysis between soil moisture in root zone and top-most layer in China
<p><em>Aims</em> It is more difficult to determine soil moisture in root zones (RSM) than soil moisture in the top-most layer (TSM). The relationship between TSM and RSM based on point A is useful for acquiring RSM at point B from its TSM if the relationship between TSM and RSM is general. The general relationships established so far have been based on only one crop or one ecosystem. Our aims are to determine the general relationship between TSM and RSM in China over various crops and ecosystems and to explore the effects of ecosystem, soil property, precipitation, vegetation, soil thickness and the order of magnitude of soil moisture on the relationship.</br><em>Methods</em> We used 3 437 pairs of TSM and DSM data from 31 stations at 109 observation sites. The data represent all the terrestrial ecosystems, including forest, grass, agriculture, desert and mire, in 2006 from the China Ecosystem Research Network. We used linear regression in mathematics and effect analysis in physics to study the general relationship between TSM and RSM and to determine the influence of ecosystem, soil property, precipitation, vegetation, soil thickness, the order of magnitude of soil moisture on the relationship. The data are divided into calibration and verification groups for producing the relationship.</br><em>Important findings</em> There is generally a linear relationship between TSM and RSM. The coefficient of determination (<em>R</em><sup>2</sup>) between RSM and TSM is high for forest and mire ecosystems (<em>R</em><sup>2</sup> > 0.79 for both calibration and verification), intermediate for agricultural (<em>R</em><sup>2</sup> > 0.80 for calibration and 0.70 for verification) and grass ecosystems (<em>R</em><sup>2</sup> > 0.80 for calibration and 0.50 for verification) and low for desert ecosystem (<em>R</em><sup>2</sup> = 0.62 for calibration and 0.49 for verification). The effect of soil properties on the relationship is similar to that of ecosystem, with mire ecosystem corresponding to meadow soil with white pulp, desert ecosystem corresponding to aeolian soil, grass ecosystem corresponding to sandy-loam and sandy soil, forest ecosystem corresponding to loam and agricultural ecosystem corresponding to various soil types. The spatial variability of the parameters for the relationship is very high for soil moisture within semi-humid, semi-arid and arid zones and low for humid zone. The relationship is similar among very-humid zone, loam and forest ecosystem. The effect of vegetation on the relationship can be divided into four categories: poor relationship due to the influence of vegetation itself, poor regional relationship due to the difference between the location sites of vegetation, good relationship at single point and good relationship over a region. It is not recommended to derive the RSM from TSM based on the relationship for the first two categories. It is suitable to use the relationship only at single point for the third category. And it is practicable to use the regional relationship to derive RSM from TSM for the fourth category. Correlation is higher between TSM and RSM where the soil layer is thicker. The <em>R</em><sup>2</sup> can remain as high as 0.79 when the soil</br>layer is as thick as 100 cm. By scaling the original soil moisture data with maximum value, it is found there is no effect of the order of the magnitude of soil moisture on the relationship.</p>
From near-surface to root-zone soil moisture using an exponential filter: An assessment of the method based on in-situ observations and model simulations
Modeling and theoretical analysis of GNSS-R soil moisture retrieval based on the random forest and support vector machine learning approach
Estimating soil moisture over winter wheat fields during growing season using machine-learning methods
Random forests
The global soil moisture data bank
Spatial variation of soil moisture in China: Geostatistical characterization
A multiscale soil moisture and free-thaw monitoring network on the Third Pole
Evaluation of AMSR-E retrievals and GLDAS simulations against observations of a soil moisture network on the central Tibetan Plateau
Evaluation of ORCHIDEE-MICT-simulated soil moisture over China and impacts of different atmospheric forcing data
Present and future Koppen-Geiger climate classification maps at 1-km resolution
ESA CCI Soil Moisture for improved earth system understanding: State-of-the art and future directions
Evolution of the ESA CCI Soil Moisture climate data records and their underlying merging methodology
SMOS soil moisture retrievals using the land parameter retrieval model: Evaluation over the Murrumbidgee Catchment, southeast Australia
Global Agro-Ecological Zones Assessment for Agriculture (GAEZ 2008)
Global automated quality control of in situ soil moisture data from the international soil moisture network
Use of a priori parameter estimates in the derivation of spatially consistent parameter sets of rainfall-runoff models
黄河沿岸陕豫区土壤水分的空间变化特征及其驱动力因子分析
Analysis of spatial variability of soil moisture and its driving force factors in the Shaanxi-Henan region along the Yellow River
黄河中下游地区降水变化的周期分析
Precipitation cycles in the middle and lower Yellow River
近百余年北京气候变化的小波特征
Wavelet characteristics of climate change in Beijing since the 19th century
In-situ and triple-collocation based evaluations of eight global root zone soil moisture products
Evaluation of the ESA CCI soil moisture product using ground-based observations
欧空局主、被动微波土壤湿度产品的比较验证
Comparative evaluation of ESA CCI active and passive microwave soil moisture products
CLM4. 0模式对中国区域土壤湿度的数值模拟及评估研究
CLM4. 0模式对中国区域土壤湿度的数值模拟及评估研究
中国土壤湿度的时空变化特征
DOI:10.11821/dlxb201609003
[本文引用: 2]
基于中国155个农业气象观测站1981-2010年逐旬土壤湿度资料,分析了全国和12个气候区域0~50 cm逐层的土壤湿度时空分布规律,采用趋势分析和Cramér-von Mises(CVM)方法探究了土壤湿度的变化趋势及突变性。结果表明:西南、江淮、东北、江南、江汉、黄淮和华南地区各层土壤湿度均高于全国平均值,内蒙古地区最低;随着深度增加,西南地区土壤湿度增加最明显,仅青藏高原地区土壤湿度减小。不同区域0~50 cm各层土壤湿度年变化和季节变化差异明显,并具有阶段性特征,大部地区深层土壤湿度高于浅层;总体上,新疆、华南、华北、青藏高原、东北、黄淮地区1981-2010年土壤湿度减小趋势显著,其中新疆地区减小最为明显。除江淮地区外,各区域土壤湿度均存在较为明显的年际差异,突变时段主要集中在20世纪80年代后期至90年代初期、90年代后期两个时间段。
Spatial-temporal characteristics of soil moisture in China
Using actual observed soil moisture data of 155 agro-meteorological stations across China, at dekadal scale from 1981 to 2010, this paper examined the spatial and temporal characteristics of soil moisture at each 10 cm depth from 0 to 50 cm, at regional and national scales. Annual trend and significant change point were detected through tendency analysis and Cramér-von Mises test methods. Since soil texture and crop types were approximately homogeneous in each climatic region, regional average variation of soil moisture could be observed in the analysis. Mean soil moisture was between 15% and 25% in most regions while it was above 25% in the northern part of Northeast China and southern part of Southwest China. At each depth, larger soil moisture was detected in Southwest China, Jianghuai, Northeast China, Jiangnan, Jianghan, Huanghuai and South China, while the smallest value was observed in Inner Mongolia. As soil deepening, except in Tibetan Plateau, increases in soil moisture were apparent, being a maximal magnitude in Southwest China. Obviously, as well as periodical characteristics, annual and seasonal difference of soil moisture emerged at each depth, corresponding well to regional precipitation, temperature, and water demand for planting crops. An obvious freezing-increasing-deceasing-increasing trend existed in Northeast China, Inner Mongolia and Xinjiang, a variation of deceasing-increasing-fluctuating in North China, Huanghuai, and eastern Northwest China, a multiple fluctuation in Jianghuai, Jianghan and Jiangnan, and a deceasing-increasing-deceasing trend in South China and Southwest China, while an increasing-deceasing trend was found in the Tibetan Plateau. Soil moisture at a greater depth was higher than that at superficial layers. Annual soil moisture varied at each depth, but the mean value decreased from 1981 to 2010. Such annual variation could be well explained by corresponding temperature and precipitation. Consequently, soil moisture tended to decrease in response to temperature increase, following climate change. Apart from climatic factors, soil texture and crop type, as well as human activity, can have influence on soil moisture, which is needed to be studied further. Soil moisture decreased in Xinjiang, South China, North China, Tibetan Plateau, Northeast China and Huanghuai among which Xinjiang was most remarkable with a velocity above -2.3%?(10a)-1. Except in Jianghuai, a significant change of soil moisture was detected, mainly during two periods, i.e. from the late 1980s to early 1990s, and late 1990s.
青藏高原土壤湿度时空分布特征研究进展
Advances in the spatio-temporal features of soil moisture over the Tibetan Plateau
Modeling spatial and temporal variations in soil moisture in China
Reconstruction and analysis of temporal and spatial variations in surface soil moisture in China using remote sensing
Spatial and temporal soil moisture variations over China from simulations and observations
Spatiotemporal impact of soil moisture on air temperature across the Tibet Plateau
Climate change and changes in global precipitation patterns: What do we know?
The objective of this paper is to synthesize the large literature recording changing patterns of precipitation in the observed data, thus indicating that climate change is already a reality. Such a synthesis is required not only for environmental researchers but also for policy makers. The key question is the broad picture at major regional and continental levels. Some interesting conclusions for this survey are emerging. For example, the review shows increased variance of precipitation everywhere. Consistent with this finding, we observe that wet areas become wetter, and dry and arid areas become more so. In addition, the following general changing pattern is emerging: (a) increased precipitation in high latitudes (Northern Hemisphere); (b) reductions in precipitation in China, Australia and the Small Island States in the Pacific; and (c) increased variance in equatorial regions. The changes in the major ocean currents also appear to be affecting precipitation patterns. For example, increased intensity and frequency of El Niño and ENSO seem associated with evidence of an observed "dipole" pattern affecting Africa and Asia, although this time series is too short so far. But the changing pattern calls for renewed efforts at adaptation to climate change, as the changing precipitation pattern will also affect the regional availability of food supply.
基于自然分区的1960-2018年中国气候变化特征
Trend of climate variation in China from 1960 to 2018 based on natural regionalization
海南岛1959-2015年气候变化特征分析
Analysis of climatic change characteristics on Hainan island from 1959 to 2015
我国西北地区近50年降水和温度的变化
The climatic change in northwest China in recent 50 years
Reexamination of the aridity conditions in arid northwestern China for the last decade
西北极端干旱区近54年降水量和温度变化趋势
Variation trends of temperature and precipitation in extremely arid region of northwestern China in recent 54 years
1960-2019年西北地区气候变化中的Hiatus现象及特征
DOI:10.11821/dlxb202009003
[本文引用: 1]
1998—2012年全球地表平均温度发生变暖停滞(Hiatus),然而Hiatus现象是否在全球各地均存在尚有争议,其在西北地区的表现及特征缺乏深入研究。本文基于1960—2019年气温地面观测数据,利用累积距平曲线、Mann-Kendall突变检验、滑动t检验及Yamamoto检验进行气候突变分析,结合线性倾向估计进行气候变化趋势分析,对西北地区气候变化中的Hiatus现象及其特征进行了探讨。结果表明:① 西北地区年均气温在1986年、1996年和2012年分别突变,1996年突变升温后在1998—2012年间保持高位震荡;② 1998—2012年间西北地区年均温变化率为-0.20 ℃/10a,呈现明显Hiatus现象,分季节看,冬季降温幅度最大,夏季仍保持升温,春季均温比秋、冬季提前1年开始和结束停滞期,从空间上看,西北地区东南部降温最显著,青藏高原不存在Hiatus;③ 2012年Hiatus结束后西北地区气温普遍快速升高,季节上以冬季升温最快,空间上以南疆升温最快。综合来看,1998—2012年的Hiatus现象在除青藏高原外的西北地区表现明显,停滞后的快速升温值得高度关注。
Characteristics of warming hiatus of the climate change in northwest China from 1960 to 2019
The mean global surface air temperature data indicate that there might be a global warming hiatus during 1998-2012. However, whether it existed around the world is still controversial, and the characteristics of the hiatus in Northwest China remain unclear. Based on the in-situ observation data of air temperature from 1960 to 2019, we analyzed the characteristic of hiatus in Northwest China through the cumulative anomaly curve, the Mann-Kendall test, Move-t test, the Yamamoto test and the linear trend estimation. The results showed that the statistically significant change-point of the annual mean air temperature in Northwest China was in 1986, 1996, and 2012, respectively. The air temperature suddenly rose in 1996, and then kept stable from 1998 to 2012. The annual mean air temperature showed an obvious cooling trend by -0.20 ℃ decade-1 in Northwest China from 1998 to 2012. Meanwhile, the annual mean air temperature in winter had the largest decrease rate and that of summer increased. The east of Northwest China displayed the most significant cooling during 1998-2012, and the Tibetan Plateau was still heating up at the same time. The air temperature of Northwest China rose substantially after 2012, especially in winter, and southern Xinjiang experienced the strongest warming during 2012-2019. Generally speaking, the warming hiatus was evident in Northwest China during 1998-2012 except the Tibetan Plateau. Therefore, more attention should be paid to the marked upward trend in air temperature after the hiatus in Northwest China due to the crucial environment.
1981年以来中国夏季降水变化特征及其与SST和前期环流的联系
DOI:10.7522/j.issn.1000-0534.2018.00148
[本文引用: 1]
利用NCEP再分析及全国160站月平均降水资料, 通过EOF、 M?K检验、 小波分析以及SVD等方法, 探讨了全国1981 -2017年夏季降水变化特征, 以及这种变化特征与全球海表温度和前期环流变化的联系。结果表明: 全国夏季降水EOF第一模态具有全区一致的、 年代际的变化特征; 而第二模态则是东北与其余地区反相且具有年际变化的特征。全国夏季降水尤其内蒙古一带1981 -1997年为偏少期, 1998 -2017年为偏多期, 2014 -2017年夏季降水与1998 -2013年比南多北少, 北方地区和长江流域夏季降水的突变年份是1997年, 南方地区的突变年份是2013年, 北方有26~30年、 9~11年以及5~6年、 南方有20~22年、 12~13年、 长江流域有16年、 6~10年的周期变化。中国夏季降水在具有年代际变化特征的背景下, 又具有年际变化特征。东太平洋与西太平洋、 印度洋和大西洋冬季海温呈反相关的模态并具有年代际变化, 这主导了次年全国夏季降水全区一致的、 具有年代际变化的特征, 而东太平洋、 印度洋、 大西洋西岸与西太平洋、 大西洋东北部冬季海温呈反相关的模态具有年际变化, 这主导了全国夏季降水南北反相的具有年际变化的特征。海表温度变化主要通过影响大气环流(海平面气压、 500 hPa高度场), 从而对次年全国夏季降水产生影响。通过对冬、 春季关键区大气环流进行连续观测, 可以作为预测次年全国夏季降水的依据之一。
The characteristics of summer precipitation in China since 1981 and its relationship with SST and pre-circulation
The characteristics of summer precipitation in China from 1981 to 2017 and its relationship with SST and pre?circulation in global were discussed using the NCEP reanalysis data and the monthly mean precipitation data of 160 stations in China based on EOF, Mann?Kendall, wavelet analysis and SVD analysis.The results show that, the first EOF mode of summer precipitation in China had the characteristics of uniform regional and interdecadal changes, the second EOF mode had the characteristics that the northeast in China and the other regions was opposite and had interannual changes.Summer precipitation especially in the Inner Mongolia area from 1981 to 1997 was relatively less than that from 1998 to 2017, while during 2014 -2017 compared with 1998 to 2013, summer rainfall in south of China was more than in north.Summer precipitation in the northern regions and the Yangtze River basin changed suddenly in 1997, while the south’s changed suddenly in 2013.The north had 26 ~ 30 years, 9 ~11 years and 5 ~ 6 years, the south had 20 ~ 22 years, 12 ~ 13 years, and the Yangtze River Basin had 16 years, 6 ~ 10 years of periodic changes.In the context of interdecadal variation, summer precipitation in China was also interannual variation.SST of the East Pacific in winter was negatively correlated with the Western Pacific Ocean, the India Ocean and the Atlantic and this had interdecadal variation, and that led to a consistent and interdecadal change of the next year’s summer precipitation in China.While SST of the Eastern Pacific, the Indian Ocean, the western Atlantic in winter was inversely correlated with the Western Pacific and the Northeastern Atlantic and this had inter?annual changes, that led to the north?south inversion of the next year’s summer precipitation.SST affected the next year’s summer rainfall by influencing atmospheric circulation such as sea level pressure, 500 hPa height field.Through the continuous observation of the atmospheric circulation in the key area in winter and in spring, it can be used as one of the bases for predicting summer precipitation in the next year.
近50年中国北方不同地区降水周期趋势的比较分析
Comparison of the precipitation cycle and trend in different areas of northern China in recent 50 years
近44年来青藏高原夏季降水的时空分布特征
Temporal-spatial distribution of summer precipitation over Qinghai-Tibet plateau during the last 44 years
青藏高原气温和降水的年际和年代际变化
Interannual and interdecadal variations of air temperature and precipitation over the Tibetan plateau
Seasonality in ENSO-related precipitation, river discharges, soil moisture, and vegetation index in Colombia
Assessment of drought evolution characteristics based on a nonparametric and trivariate integrated drought index
Polar drift in the 1990s explained by terrestrial water storage changes
Interdecadal changes in the ENSO-monsoon system
Temporal structure of the southern oscillation as revealed by waveform and wavelet analysis
巨型流域水质量变化指标与极移变化的联系
Indexing the relationship between polar motion and water mass change in a giant river basin
Using lagged dependence to identify (de)coupled surface and subsurface soil moisture values
