

1 引言
收缩城市(Shrinking cities)的概念由德国学者Häußermann和Siebel等提出,用于表示由于城市经济衰退所引起的人口减少现象[1]。虽然城市收缩的过程涉及经济、社会、人口以及城市景观等多个维度,但城市人口减少或人口流失成为收缩城市识别研究中采用最为广泛的指标[2⇓⇓⇓⇓-7]。改革开放以来,中国经历了快速的城镇化发展过程,城镇人口规模急剧增长,2020年第七次人口普查数据显示,全国城镇人口规模已增长至9.02亿,城镇化率达到63.89%。伴随着快速的城镇化进程,绝大多数城市都经历了城市土地和人口的快速扩张[8⇓-10]。但是,近年来,中国的人口和经济发展出现新的特征。在人口方面,中国人口总量增长已明显放缓,老龄化率不断增长,人口结构出现重要变化,《国家人口发展规划(2016—2030年)》指出中国进入“人口发展的关键转折期”,这对城市人口增长带来一定冲击,并且这种影响在长期将更为明显[11,12]。在经济发展方面,后金融危机时代,很多外向型经济城市正面临人口红利逐渐消失和全球竞争加剧等问题,产业转型过程带来经济增长放缓、土地财政紧张等挑战[13,14];同时,资源型城市也面临资源枯竭、资源型产业转型升级乏力以及新兴产业发展不足等问题[15⇓⇓-18]。很多城市在区域间人口竞争中逐步处于劣势,面临城镇化动力不足和人口流失等问题[19]。在此背景下,部分学者认为中国开始出现“收缩城市”,展现出中国城镇化和城市发展变化的另一面。
借鉴国外研究,国内学者以人口变化为指标对中国的收缩城市进行识别,认为城市收缩的现象已经非常明显。例如,基于第五次和第六次全国人口普查数据,研究发现2000—2010年中国存在180个常住人口减少的城市[20];收缩城市不仅广泛分布在中西部等经济相对不发达的地区[21,22],而且在珠三角、长三角和京津冀等发达的城市群地区占比也较高[13,23⇓⇓⇓-27]。但是,多数已有研究面临“城市”概念界定不准确所导致的人口统计口径难以反映城市人口真实变化的问题。由于行政区划的原因,中国的直辖市、地级市和县级市与西方国家的城市存在较大差异,直接采用行政区域范围内的人口统计数据极有可能造成城市收缩或增长状态的错误判断。国内学者已逐步关注到城市人口统计口径不准确在识别收缩城市中产生的偏差。例如戚伟等对中国城市行政地域与实体地域的差异进行了详细对比分析[28];吴康等指出了人口统计口径所带来的收缩城市认知与测算误区[29]。基于此,学者试图通过土地利用数据、POI数据、夜间灯光数据等识别城市的实体地域并间接测算其人口变化,以此来识别“真正”的收缩城市[30⇓⇓⇓-34]。
事实上,中国有明确的城市空间范围及城市规模的官方标准。2014年《国务院关于调整城市规模划分标准的通知》正式颁布,确立“以城区常住人口为统计口径”界定城市规模[35],其中,“城区”是指在市辖区和不设区的市,区、市政府驻地的实际建设连接到的居民委员会和其他区域。“城区常住人口”本质上是中国对城市实体地域“城区”范围内的人口规模的核算标准,能够有效地将其与“镇区常住人口”和“乡村常住人口”区分开来。随着2020年第七次人口普查“城区常住人口”数据发布,中国发布了超大、特大城市等“五类七档”城市规模等级及名单。因而,判定城市规模的变动,可以通过“城区常住人口”变动来计算。如果“城区常住人口”出现负增长,即可判定为人口减少型的收缩城市。本研究根据2010和2020两期人口普查“城区常住人口”数据,实现基于国家城市规模划分标准口径的收缩城市识别。
2 识别方法及数据来源
2.1 城区范围及其人口规模界定
城市的城区范围界定及其人口统计口径的可比性关系到城市收缩判定与识别结果的准确性。1986年,国务院批复民政部《关于调整设市标准和市领导县条件的报告》,城市辖区范围迅速扩张,城市行政地域范围与城市实际建成的实体地域范围相差越来越大。同时,改革开放以来,国内出现大规模、高强度的流动人口,常住人口逐步取代户籍人口,成为更广泛使用的人口统计口径。目前,仅有人口普查能够提供精确到个位数的城区常住人口(部分年份采用“市人口”、“城市人口”等名称)数据。但是,中国历次人口普查的城区范围界定标准差异较大,在做时间对比或差值计算时需慎重[36⇓⇓-39]。目前,有且仅有2010年第六次人口普查和2020年第七次人口普查的城区人口口径保持一致,能够支撑两期之间城区人口规模变化的核算。
2010年和2020年人口普查的城区人口的确定依据是《统计上划分城乡的规定》(国函[2008]60号批复),与2014年《国务院关于调整城市规模划分标准的通知》确立的“城区常住人口”口径保持一致。其中,“城区”是指在市辖区和不设区的市,区、市政府驻地的实际建设连接到的居民委员会和其他区域。对于直辖市和设区的市(一般是指下设市辖区的地级市),相当于所有市辖区(包括飞地型市辖区)以区政府为中心的建成区范围;对于不设区的市(一般是指县级市和不设市辖区的地级市),相当于以市政府为中心的建成区范围[28,29,40]。采用居民委员会、村民委员会等村级单元近似替代实际建设范围,是为了方便与村级单元人口普查数据匹配。国家统计局每年发布全国各村级单元的统计用区划和城乡划分代码,城乡分类代码前两位为“11”是指城区范围,其中,“111”表示主城区,“112”表示城乡结合区;代码前两位为“12”的是指镇区范围;代码前两位为“22”是指乡村范围。
需要指出的是,在中国统计标准中,“城市”仅覆盖直辖市、设区的市和不设区的市,不包括广义城市涵盖的县城、特大镇等。县城和其他建制镇的镇区同属于“镇区”类型,而且2010年和2020年两次人口普查均没有系统地发布县城常住人口或其他建制镇镇区常住人口,无法支撑2010—2020年所有县城人口和其他建制镇镇区的常住人口变化核算。此外,部分研究提出收缩城市采用2~3年等周期的人口变化界定收缩城市,但是中国非普查年份没有“城区常住人口”数据统计,难以反映新近的及短期阶段性的收缩城市演变特征。
2.2 2010—2020年中国收缩城市的判定依据与识别方法
本研究将“城区常住人口”负增长作为收缩城市的判定依据,反之,“城区常住人口”正增长界定为增长型城市。2010年与2020年的“城区常住人口”所采用的城乡划分标准一致,但是10年间“城区”的空间范围并不是恒定不变的,随着城市建成区扩张等影响,城乡分类代码前两位为“11”的城区空间单元每年都相应调整。更值得注意的是行政区划调整的影响,要确保行政区划的空间一致性,避免因为行政区划调整导致的错误判定。2010—2020年间行政区划调整较多,而且不同城市对开发区是否归属“城区”方面存在差异,因而不能简单地直接采用2020年和2010年普查发布的城区人口相减来判定城市增长或者收缩[41]。本研究以2020年城市行政区划及其城乡分类代码为基准,通过对2010年对应单元进行数据一致性处理,实现空间可比的城区人口变动核算。图1列出了针对2010年数据的具体处理方法。
图1
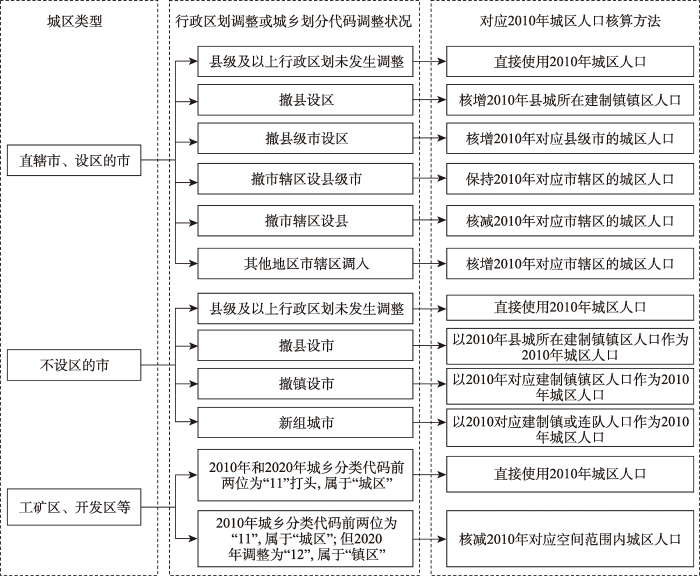
图1
2010—2020年城区人口变动核算方法
Fig. 1
Accounting method of population change in physical urban area from 2010 to 2020
2.2.1 直辖市和设区的市
如果县级及以上行政区划未发生调整,则直接使用2010年的城区人口;如果出现撤县设区,例如北京市撤销密云县设密云区、那曲地区撤销那曲县设色尼区等,对应核增2010年县城所在建制镇镇区人口(城乡分类代码前两位为“12”);如果出现撤县级市设区,例如石家庄市撤销藁城市设藁城区、日喀则地区撤销县级日喀则市设桑珠孜区等,对应核增2010年县级市城区人口;如果出现撤销市辖区设立县级市,例如撤销原地级巢湖市的居巢区,设立县级市巢湖市,保持原2010年对应市辖区的城区人口;如果出现撤销市辖区设县,例如原地级市伊春市撤销带岭区设立大箐山县,对应核减2010年所在市辖区城区人口;如果出现其他地区市辖区调入,例如原地级莱芜市的莱芜区、钢城区划入济南市,对应核增2010年市辖区城区人口。
2.2.2 不设区的市
这类城市行政区划不设市辖区,直接设乡、镇、街道办事处等,既包括地级的中山市、东莞市、嘉峪关市等,也包括全部的县级市。如果县以上行政区划未发生调整,则直接使用2010年的城区人口;如果出现了撤县设市,例如撤销承德市平泉县设立县级平泉市,以2010年县城所在建制镇镇区人口(城乡分类代码前两位为“12”)作为2010年城区人口;如果出现了撤镇设市,例如撤销苍南县龙港镇设立县级龙港市,以2010年对应建制镇镇区人口(城乡分类代码前两位为“12”)作为2010年城区人口;如果新组城市,例如北屯市、铁门关市、双河市、可克达拉市、昆玉市、胡杨河市等兵团城市,以2010年对应建制镇镇区人口(城乡分类代码前两位为“12”)或团部连队人口作为2010年城区人口。2012年地级不设区的市三沙市成立,但是2020年城乡分类代码前两位均为“12”,故城区人口核算不考虑三沙市。
2.2.3 工矿区、开发区等
2010年城区内部或者毗邻城区的工业园区、经济技术开发区、高新技术产业开发区等城乡分类代码前两位为“11”,属于城区。但是,2010年后,部分地区将这些城区内部或者毗邻的工矿区、开发区等也按照统计上的“独立的”工矿区、开发区等识别,相应的城乡分类代码前两位调整“12”,属于镇区。如果采用普查发布的城区人口直接相减,这些城市2010—2020年城区人口变动规模会被夸大,甚至被误判为收缩城市。需要核减2010年对应空间范围内的城区人口。例如,淮安市2010年和2020年发布的城区人口分别为13.06万人和13.03万人,直接计算就被误判为收缩城市,但是核减2010年淮安经济技术开发区所在城区人口后,淮安市城区人口实际是增长的。类似地,不做处理可能被误判为城区人口收缩还包括满洲里市、长春市、吉林市、白城市、连云港市、镇江市、温州市、芜湖市、蚌埠市、安庆市、滁州市、威海市、德州市、平顶山市、三门峡市、黄石市、湘潭市、衡阳市、益阳市等。其中,湘潭市九华示范区在2020年是城乡分类代码前两位“12”,属于镇区,但是考虑到九华示范区是长株潭一体化的典型区,拥有长沙地铁3号线,过去10年是湘潭市和长沙市居民重要的购房安居目的地,因此,将九华示范区按城区处理,核算结果显示湘潭市未出现城区人口收缩。
2.3 数据来源与处理
2010年和2020年城区常住人口数据分别来源于《2010年第六次全国人口普查劳动力数据资料》和《2020中国人口普查分县资料》。由于涉及2010年县城等建制镇镇区、独立工矿区与开发区城区等人口核算,需要提取城乡分类代码前两位为“12”或“11”的2010年村级人口普查数据。其中,全国主要城市2010年村级人口普查数据来源于华通数据中心(
部分地区确实未发布村级资料,主要影响2010年部分县城人口计算。为此,第一步采用《中国2010年人口普查分乡、镇、街道资料》县城所在建制镇镇域人口作为县城人口,在县城人口偏大估计的情况下,如果未出现2010—2020年城区人口下降,那么这个城市肯定不属于收缩城市。核算结果显示,这类城市基本都是增长型城市,不涉及到收缩城市。第二步,为了进一步精确这些增长型城市2010—2020年城区人口的增长量,参考《2012年中国建制镇统计年鉴》发布的2011年镇区人口(指标解释为“年末实际居住在镇区范围内总人口数”,与常住人口口径接近),以县城所在镇区人口估算2010年县城人口。上述涉及到估算的均属于增长型城市,不影响对收缩城市的核算。
为了与其他口径的对比,数据来源还包括《中国城市建设统计年鉴2020》《中国城市建设统计年鉴2010》《中国2010年人口普查分县资料》等。行政区划及调整资料参考历年《中华人民共和国行政区划简册》,并且将行政区划边界统一到2020年人口普查时点11月1日。
3 2010—2020年中国收缩城市识别
3.1 收缩城市的识别结果
如表1所示,2010—2020年,中国693个城市中,增长型城市共计635个,收缩城市仅有48个,收缩城市数量仅占全部城市总数的7.56%。其中,本溪市收缩规模最大,城区人口从2010年的96.85万人下降至2020年的76.59万人,收缩20.26万人。鸡西市收缩规模次之,收缩11.53万人。此外,收缩规模介于5~10万人的城市4个,包括鹤岗市、伊春市、七台河市和抚顺市。收缩规模介于1~5万人的城市21座,包括白山市、温州市、通化市、临江市、洮南市、舒兰市等。收缩规模小于1万人的20个,其中,集安市和乐昌市的人口收缩规模最小,不足1000人。
表1 2010—2020年城区人口变化统计表
Tab. 1
| 城市类型(按城区人口变动划分) | 数量(个) | 对全国城区人口增长贡献率(%) | 城市类型(按城区人口变动划分) | 数量(个) | 对全国城区人口增长贡献率(%) |
|---|---|---|---|---|---|
| 增长型城市合计 | 635 | 100.77 | 收缩城市合计 | 48 | -0.77 |
| ≥500万人 | 4 | 14.86 | -1~0万人 | 20 | -0.06 |
| 100~500万人 | 28 | 31.43 | -1~-5万人 | 21 | -0.28 |
| 50~100万人 | 29 | 11.51 | -5~-10万人 | 5 | -0.24 |
| 10~50万人 | 260 | 33.51 | <-10万人 | 2 | -0.19 |
| 5~10万人 | 154 | 7.05 | |||
| 1~5万人 | 125 | 2.31 | |||
| 0~1万人 | 34 | 0.10 |
相较于增长型城市,收缩城市不仅数量少,而且人口变动规模偏小。2010—2020年,在行政区划可对比的情况下,693个城市的城区人口总量从4.10亿人增长至5.75亿人,增长1.65亿人。其中,增长型城市的城区人口总量累计增长1.66亿人,对全部城市城区人口增长贡献率达到100.77%;而收缩城市的城区人口总量累计减少0.01亿人,对全部城市城区人口增长贡献率为-0.77%。并且,在635个增长型城市中,城区人口规模增长超过10万人的城市达到321个,占增长型城市的一半;而在收缩城市中,城区人口规模减少超过10万人的仅2个,绝大部分收缩城市的城区人口减少规模都低于5万人。因此,2010—2020年,中国城市整体仍然是“增长型”态势为主,收缩城市只是少数,而且收缩规模整体不大。
3.2 收缩城市的分布特征
图2
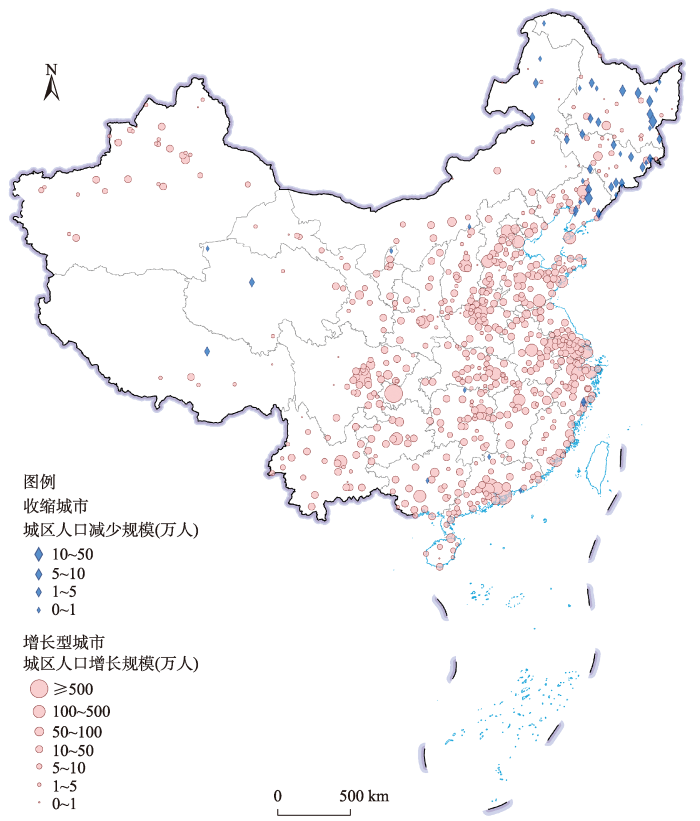
图2
2010—2020年城区人口变化规模空间分布图
注:此图基于国家自然资源部地图技术审查中心标准地图服务网站的标准地图(GS(2020)4615号)制作,底图边界无修改。
Fig. 2
Spatial pattern of population changes in physical urban area of Chinese cities from 2010 to 2020
表2 2010—2020年中国收缩城市信息一览表
Tab. 2
| 序号 | 城市名称 | 2010—2020年城区人口收缩规模(万人) | 2020年城区人口规模(万人) | 2010年城区人口规模(万人) | 所属地级行政区 | 所属省级行政区 | 所属 区域 | 行政区划等级 | 城市规模等级 | 是否属于资源型城市 | ||
|---|---|---|---|---|---|---|---|---|---|---|---|---|
| 1 | 本溪市 | -20.26 | 76.59 | 96.85 | 本溪市 | 辽宁省 | 东北 | 地级市 | 中等城市 | ** | ||
| 2 | 鸡西市 | -11.53 | 62.60 | 74.13 | 鸡西市 | 黑龙江省 | 东北 | 地级市 | 中等城市 | ** | ||
| 3 | 双鸭山市 | -8.88 | 36.19 | 45.08 | 双鸭山市 | 黑龙江省 | 东北 | 地级市 | I型小城市 | * | ||
| 4 | 鹤岗市 | -8.63 | 50.26 | 58.89 | 鹤岗市 | 黑龙江省 | 东北 | 地级市 | 中等城市 | * | ||
| 5 | 伊春市 | -7.95 | 29.63 | 37.58 | 伊春市 | 黑龙江省 | 东北 | 地级市 | I型小城市 | * | ||
| 6 | 七台河市 | -7.13 | 40.94 | 48.08 | 七台河市 | 黑龙江省 | 东北 | 地级市 | I型小城市 | * | ||
| 7 | 抚顺市 | -6.04 | 120.80 | 126.84 | 抚顺市 | 辽宁省 | 东北 | 地级市 | II型大城市 | * | ||
| 8 | 白山市 | -4.19 | 34.97 | 39.16 | 白山市 | 吉林省 | 东北 | 地级市 | I型小城市 | * | ||
| 9 | 温州市 | -4.15 | 238.18 | 242.33 | 温州市 | 浙江省 | 东部 | 地级市 | II型大城市 | |||
| 10 | 通化市 | -3.58 | 38.74 | 42.32 | 通化市 | 吉林省 | 东北 | 地级市 | I型小城市 | ** | ||
| 11 | 临江市 | -3.52 | 8.12 | 11.64 | 白山市 | 吉林省 | 东北 | 县级市 | II型小城市 | ** | ||
| 12 | 洮南市 | -3.40 | 10.52 | 13.92 | 白城市 | 吉林省 | 东北 | 县级市 | II型小城市 | |||
| 13 | 舒兰市 | -3.21 | 14.95 | 18.15 | 吉林市 | 吉林省 | 东北 | 县级市 | II型小城市 | * | ||
| 14 | 大安市 | -2.95 | 10.31 | 13.26 | 白城市 | 吉林省 | 东北 | 县级市 | II型小城市 | |||
| 15 | 阿尔山市 | -2.57 | 1.81 | 4.39 | 兴安盟 | 内蒙古自治区 | 东北 | 县级市 | II型小城市 | * | ||
| 16 | 格尔木市 | -2.07 | 15.45 | 17.52 | 海西蒙古族藏族自治州 | 青海省 | 西部 | 县级市 | II型小城市 | ** | ||
| 17 | 丹东市 | -2.06 | 68.46 | 70.52 | 丹东市 | 辽宁省 | 东北 | 地级市 | 中等城市 | |||
| 18 | 图们市 | -2.04 | 5.94 | 7.98 | 延边朝鲜族自治州 | 吉林省 | 东北 | 县级市 | II型小城市 | ** | ||
| 19 | 牙克石市 | -1.46 | 14.04 | 15.49 | 呼伦贝尔市 | 内蒙古自治区 | 东北 | 县级市 | II型小城市 | ** | ||
| 20 | 四平市 | -1.44 | 48.13 | 49.58 | 四平市 | 吉林省 | 东北 | 地级市 | I型小城市 | |||
| 21 | 那曲市 | -1.33 | 2.97 | 4.30 | 那曲市 | 西藏自治区 | 西部 | 地级市 | II型小城市 | |||
| 22 | 肇东市 | -1.27 | 25.99 | 27.27 | 绥化市 | 黑龙江省 | 东北 | 县级市 | I型小城市 | |||
| 23 | 安达市 | -1.25 | 16.70 | 17.95 | 绥化市 | 黑龙江省 | 东北 | 县级市 | II型小城市 | |||
| 24 | 大石桥市 | -1.07 | 26.41 | 27.47 | 营口市 | 辽宁省 | 东北 | 县级市 | I型小城市 | ** | ||
| 25 | 和龙市 | -1.05 | 5.93 | 6.98 | 延边朝鲜族自治州 | 吉林省 | 东北 | 县级市 | II型小城市 | ** | ||
| 26 | 敦化市 | -1.05 | 19.50 | 20.55 | 延边朝鲜族自治州 | 吉林省 | 东北 | 县级市 | II型小城市 | * | ||
| 27 | 东宁市 | -1.04 | 5.72 | 6.77 | 牡丹江市 | 黑龙江省 | 东北 | 县级市 | II型小城市 | ** | ||
| 28 | 五大连池市 | -1.02 | 5.27 | 6.28 | 黑河市 | 黑龙江省 | 东北 | 县级市 | II型小城市 | * | ||
| 29 | 茫崖市 | -0.94 | 1.55 | 2.49 | 海西蒙古族藏族自治州 | 青海省 | 东北 | 县级市 | II型小城市 | ** | ||
| 30 | 讷河市 | -0.94 | 13.16 | 14.10 | 齐齐哈尔市 | 黑龙江省 | 东北 | 县级市 | II型小城市 | |||
| 31 | 鞍山市 | -0.93 | 145.74 | 146.67 | 鞍山市 | 辽宁省 | 东北 | 地级市 | II型大城市 | ** | ||
| 32 | 合山市 | -0.79 | 3.90 | 4.69 | 来宾市 | 广西壮族自治区 | 西部 | 县级市 | II型小城市 | * | ||
| 33 | 丰镇市 | -0.77 | 11.38 | 12.15 | 乌兰察布市 | 内蒙古自治区 | 西部 | 县级市 | II型小城市 | |||
| 34 | 龙井市 | -0.63 | 8.60 | 9.24 | 延边朝鲜族自治州 | 吉林省 | 东北 | 县级市 | II型小城市 | ** | ||
| 35 | 根河市 | -0.63 | 4.19 | 4.82 | 呼伦贝尔市 | 内蒙古自治区 | 东北 | 县级市 | II型小城市 | ** | ||
| 36 | 汕尾市 | -0.57 | 30.36 | 30.93 | 汕尾市 | 广东省 | 东部 | 地级市 | I型小城市 | |||
| 37 | 北安市 | -0.54 | 12.78 | 13.33 | 黑河市 | 黑龙江省 | 东北 | 县级市 | II型小城市 | |||
| 38 | 石嘴山市 | -0.54 | 36.54 | 37.08 | 石嘴山市 | 宁夏回族自治区 | 西部 | 地级市 | I型小城市 | * | ||
| 39 | 津市市 | -0.53 | 10.93 | 11.46 | 常德市 | 湖南省 | 中部 | 县级市 | II型小城市 | |||
| 40 | 漠河市 | -0.51 | 3.11 | 3.62 | 大兴安岭地区 | 黑龙江省 | 东北 | 县级市 | II型小城市 | ** | ||
| 41 | 富锦市 | -0.45 | 12.56 | 13.01 | 佳木斯市 | 黑龙江省 | 东北 | 县级市 | II型小城市 | |||
| 42 | 同江市 | -0.42 | 4.78 | 5.20 | 佳木斯市 | 黑龙江省 | 东北 | 县级市 | II型小城市 | |||
| 43 | 盖州市 | -0.38 | 17.54 | 17.92 | 营口市 | 辽宁省 | 东北 | 县级市 | II型小城市 | |||
| 44 | 穆棱市 | -0.38 | 6.38 | 6.76 | 牡丹江市 | 黑龙江省 | 东北 | 县级市 | II型小城市 | ** | ||
| 45 | 蛟河市 | -0.22 | 13.11 | 13.33 | 吉林市 | 吉林省 | 东北 | 县级市 | II型小城市 | ** | ||
| 46 | 调兵山市 | -0.18 | 15.27 | 15.45 | 铁岭市 | 辽宁省 | 东北 | 县级市 | II型小城市 | ** | ||
| 47 | 集安市 | -0.08 | 7.24 | 7.33 | 通化市 | 吉林省 | 东北 | 县级市 | II型小城市 | ** | ||
| 48 | 乐昌市 | --0.05 | 10.26 | 10.32 | 韶关市 | 广东省 | 东部 | 县级市 | II型小城市 | ** | ||
注1:“所属区域”中,将内蒙古自治区东部五盟市(呼伦贝尔市、通辽市、赤峰市、兴安盟、锡林郭勒盟)列入东北地区,其他列入西部地区。
注2:“是否属于资源型城市”中,**表示《资源型城市可持续发展规划(2013—2020年)》中确定的资源型城市,含地级行政区和县级市;*表示国家分三批(2008年、2009年和2012年)认定的资源枯竭城市。
从城市等级分布看,收缩城市以县级市和小城市居多。根据城市行政规模等级,48个收缩城市中,包括16个地级城市和32个县级城市。2014年确定的城市规模划分新标准,48个收缩城市中,城区人口规模介于100万~300万人的II型大城市3个,包括温州市、鞍山市和抚顺市;城区人口规模介于50万~100万人的中等城市4个,包括本溪市、鸡西市、丹东市和鹤岗市;城区人口规模介于20万~50万人的I型小城市10个;城区人口规模低于20万人的II型小城市31个。可见,城市行政等级或规模等级越低,出现收缩城市的概率越高。但是,全国县级市共387个,其中城区人口正增长的城市达到355个;I型小城市和II型小城市累计443个,其中城区人口正增长的城市达到402个。也就是说,大部分处于城市等级底部的城市尚未出现收缩。
从城市属性分布看,收缩城市中大多数都属于资源型城市。根据《全国资源型城市可持续发展规划(2013—2020年)》确立的资源型城市名单和2008年、2009年、2012年确立的资源枯竭型城市名单,48个收缩城市中,有32个属于资源型城市,其中,包括12个资源枯竭型城市。但是,值得注意的是,262个资源型城市中收缩城市仅占12%,69个资源枯竭型城市(县、区)中收缩城市仅占17%。也就是说,资源衰退或枯竭确实是影响城市收缩的一个因素,但是大部分资源型城市或资源枯竭型城市尚未出现收缩。
总体来看,当前中国收缩城市与“东北城市”“中小型城市”“资源型城市”确实存在一定关联,但是不完全一致,不宜片面地将“东北城市”“中小型城市”“资源型城市”与“收缩城市”对等挂钩。
3.3 与其他识别方案的对比
表3列出了常见的三种不同口径的收缩城市识别方法及其识别结果。第一种识别方案是不考虑行政区划调整的人口普查“城区人口”收缩,即采用2020年与2010年两期人口普查发布的“城区人口”直接相减,获得名义上的收缩城市。这种方案既不考虑撤县(县级市)设市、拆并地级市等行政区划调整,也未考虑开发区等城乡划分代码调整等变动,会导致很多误判。例如,伊春市被识别为最大的收缩城市,事实上2019年伊春市经历了一轮大规模的行政区划调整,部分原来的市辖区开展撤区设县,相应地,2010年部分“城区人口”已经调整为“县城人口”,这也是近年来伊春市适应自身城市收缩形势完成的行政区划“逆向”适应性调整。再例如,镇江市、淮安市等城市由于开发区内人口由2010年“城区人口”调整为2020年的“镇区人口”属性,导致名义上被误判为收缩城市。按照上述识别方案,中国收缩城市达到58个,尤其是城区人口收缩规模为10万人以上和介于5~10万人之间的城市数量被明显高估。
表3 2010—2020年基于不同口径的收缩城市识别结果表
Tab. 3
| 收缩规模 | 方案1:不考虑行政区划调整的人口普查“城区人口”收缩 | 方案2:《城市建设统计年鉴》 “城区人口”收缩 | 方案3:城市行政区划范围内 “常住总人口”收缩 |
|---|---|---|---|
| 5个:伊春市、本溪市、温州市、鸡西市、满洲里市 | 18个:抚顺市、伊春市、鄂尔多斯市、淮北市、鞍山市、洪湖市、乌鲁木齐市、四平市、罗定市、营口市、包头市、公主岭市、鸡西市、辽源市、本溪市、锦州市、鄂州市、海城市 | 60个:榆树市、海伦市、丰城市、天门市、扶余市、舒兰市、肇东市、无为市、公主岭市、本溪市、海城市、邓州市、射洪市、讷河市、兴宁市、瓦房店市、鸡西市、绥化市、白山市、平度市、大安市、五常市、钟祥市、齐齐哈尔市、嫩江市、磐石市、盖州市、淮安市、七台河市、北安市、兴化市、武威市、洮南市、温州市、陆丰市、尚志市、洪湖市、偃师市、鹤岗市、灯塔市、蛟河市、应城市、铜川市、枣阳市、宁安市、安达市、宣威市、汉川市、松滋市、抚顺市、乳山市、海林市、雷州市、阆中市、梅河口市、淮南市、桦甸市、石首市、双辽市、东台市 | |
| 5~10万人 | 8个:湘潭市、双鸭山市、鹤岗市、蚌埠市、七台河市、吉林市、白城市、抚顺市 | 17个:广汉市、都江堰市、舒兰市、攀枝花市、牡丹江市、永济市、肇东市、东方市、鹤岗市、佳木斯市、敦化市、汾阳市、万宁市、黄石市、济源市、大安市、义乌市 | 66个:双鸭山市、沅江市、满洲里市、大石桥市、穆棱市、牙克石市、凌海市、武冈市、乐陵市、北镇市、涟源市、新民市、京山市、敦化市、安丘市、开原市、深州市、莱阳市、五大连池市、四平市、栖霞市、廉江市、泰兴市、洪江市、吉林市、铁力市、原平市、淮北市、凤城市、和龙市、南宫市、内江市、桐城市、安陆市、樟树市、定州市、密山市、伊春市、高安市、临湘市、灵宝市、隆昌市、集安市、巴中市、醴陵市、汨罗市、通化市、潜江市、莱州市、潜山市、东港市、商洛市、普宁市、德惠市、乐平市、北票市、海阳市、兴城市、三门峡市、巢湖市、临江市、华阴市、肥城市、老河口市、丰镇市、虎林市 |
| 1~5万人 | 23个:镇江市、白山市、通辽市、通化市、临江市、洮南市、舒兰市、东宁市、大安市、衡阳市、阿尔山市、格尔木市、丹东市、图们市、扶余市、牙克石市、四平市、肇东市、安达市、大石桥市、和龙市、敦化市、五大连池市 | 74个:阜新市、景德镇市、朝阳市、兰溪市、白城市、桦甸市、滨州市、黄山市、霍林郭勒市、黄冈市、福清市、齐齐哈尔市、赤峰市、琼海市、辽阳市、通辽市、松原市、三河市、根河市、霸州市、玉门市、敦煌市、中卫市、白银市、常德市、海阳市、汩罗市、瓦房店市、龙井市、冷水江市、奎屯市、汉川市、郴州市、四会市、当阳市、北票市、通化市、铁岭市、瑞安市、哈尔滨市、常宁市、磐石市、图们市、文山市、大石桥市、塔城市、开原市、吉林市、海伦市、凌海市、德惠市、津市市、井冈山市、张家港市、铁力市、大冶市、晋江市、宁国市、双鸭山市、兴宁市、新民市、文昌市、洮南市、双辽市、巢湖市、五指山市、丹江口市、太仓市、讷河市、安宁市、博乐市、哈密市、阿克苏市、北安市 | 88个:永济市、丹东市、图们市、湘乡市、枝江市、龙井市、岑溪市、平泉市、扎兰屯市、明光市、兴平市、广水市、白城市、宜城市、监利市、抚州市、揭阳市、汕尾市、个旧市、仙桃市、根河市、昌邑市、资阳市、大冶市、津市市、绵竹市、当阳市、潮州市、阿尔山市、萍乡市、调兵山市、牡丹江市、高邮市、滦州市、丹江口市、台山市、孟州市、保山市、高平市、遂宁市、仪征市、江油市、项城市、莱西市、遵化市、凌源市、晋州市、漠河市、抚远市、滕州市、如皋市、葫芦岛市、铜陵市、招远市、富锦市、彬州市、阜新市、巩义市、禹州市、罗定市、玉门市、辛集市、靖江市、青铜峡市、吴川市、常宁市、扬中市、佳木斯市、舞钢市、卫辉市、曲阜市、高密市、峨眉山市、荔浦市、贵溪市、绥芬河市、建瓯市、宜都市、合山市、瑞昌市、河间市、茫崖市、资兴市、乐昌市、庄河市、耒阳市、渭南市、泊头市 |
| <1万人 | 22个:讷河市、鞍山市、漠河市、合山市、丰镇市、益阳市、龙井市、根河市、汕尾市、北安市、石嘴山市、津市市、富锦市、同江市、盖州市、穆棱市、淮安市、蛟河市、调兵山市、集安市、黄石市、乐昌市 | 32个:集安市、灯塔市、乐昌市、邵武市、北镇市、合山市、昌吉市、醴陵市、凤城市、五大连池市、和龙市、沅江市、义马市、德令哈市、乌海市、虎林市、湘潭市、韶山市、任丘市、韩城市、同江市、铜川市、额尔古纳市、永康市、连州市、牙克石市、乳山市、乌苏市、黑河市、乌兰察布市、永安市、临夏市 | 46个:霍州市、邛崃市、靖西市、新乐市、义马市、恩平市、辽源市、汾阳市、陇南市、额尔古纳市、韩城市、赤壁市、诸城市、武安市、安国市、华亭市、任丘市、华蓥市、什邡市、东宁市、启东市、瑞金市、嵊州市、海东市、那曲市、邹平市、同江市、康定市、河津市、珲春市、腾冲市、永安市、禹城市、弥勒市、邵武市、万源市、敦煌市、英德市、平凉市、平湖市、鞍山市、庐山市、沁阳市、荣成市、马尔康市、益阳市 |
| 合计 | 58个 | 141个 | 260个 |
第二种识别方案是《城市建设统计年鉴》“城区人口”收缩。《城市建设统计年鉴》每年发布各个城市的“城区人口”数据,被部分学者用于对国内的收缩城市识别。但是,这个年鉴的“城区人口”是指“划定的城区(县城)范围的人口数,按公安部门的户籍统计为准”,与《国务院关于调整城市规模划分标准的通知(国发〔2014〕51号)》要求的“以城区常住人口为统计口径”并不一致。一方面,《城市建设统计年鉴》的户籍人口既未核增在常住地实际居住半年及以上的流入人口,也未核减具有本地户籍但是常住在外地半年及以上的流出人口;另一方面,《城市建设统计年鉴》城区范围与《关于城乡划分标准的规定(国函[2008]60号批复)》也无完全对照,城区范围及其人口数据往往是自下而上的上报数据,城市间和年际间的统计标准并不完全一致。根据这个识别方案,中国收缩城市达到141个,仅收缩规模超过10万人的城市就达到18个。然而,外来人口是城区人口增长的重要来源,只考虑户籍口径的城区人口来衡量城市收缩显然是不合适。
第三种识别方案是城市行政区划范围内“常住总人口”收缩,对人口普查数据做了行政区划可对比的处理。相较于实体地域内“城区人口”,“城市行政区划范围内常住总人口”还包括镇区人口和乡村人口。2010—2020年,中国城镇化发展仍然以从乡到城镇的人口流动为主,很多城市行政区划范围内的常住总人口减少是由于乡村人口减少,并非城区人口减少。以城市行政范围界定,中国收缩城市数量达到260个,其中,榆树市、海伦市、丰城市等成为收缩规模最突出的地区。城市行政区划范围的常住总人口这个数据在非普查年份更容易获得,经常被用来作为收缩城市的识别口径,但是这个口径本质上是区域人口减少,而非城区人口减少,明显夸大了收缩城市的数量及其收缩规模。
综合来看,上述三种常见的收缩城市识别方案主要存在的问题包括:① 忽视行政区划调整或城乡划分代码调整带来的影响;② 误用人口统计口径,户籍人口口径不能够客观体现城市人口规模;③ 误用城市空间范围,片面地采用城市行政地域范围替代城市实体地域范围。除了基于统计数据或普查数据,还有基于夜间灯光数据、POI数据等收缩城市识别方案,这类方法的数据获取灵活性更高,在时间上可以实现逐年的研究精度,在空间上可以延展到县城、特大建制镇等广义范围内城市实体地域的研究粒度,但是这类方法难以明确标定收缩规模,需要进一步加强与“城区人口数据”的校验。
4 讨论
4.1 收缩城市识别的问题
尽管依据《统计上划分城乡的规定》(国函[2008]60号)确定的2010年和2020年城区人口开展2010—2020年收缩城市识别。但在实际数据核算时,发现几处问题:
4.1.1 相对独立的市辖区可以作为单独城区进行城市人口变化测算
直辖市和设区的市下辖市辖区,随着撤县设区、撤县级市设区等行政区划调整,很多距离城市中心较远的县域被调整为市辖区。例如,北京市的密云区、延庆区、怀柔区、平谷区等,其以区行政中心为中心形成的建成区与北京市中心城区的建成区并不相连,且距离相对较远。按照2014年版本城市规模划分新标准,很多相对独立的市辖区的城区人口被统计为整个城市城区人口的一部分。但是,严格按照城市实体地域的界定,这些相对独立的市辖区的城区是一个单独的城市实体地域。显然,如果相对独立的市辖区本身是城区人口减少的,但是由于纳入到所在直辖市或设区的市整个城区人口中计算,其城区人口收缩现象就很容易被忽略。国家《“十四五”新型城镇化实施方案》明确指出:“严格控制撤县建市设区,推进市辖区结构优化和规模适度调整。”随着市辖区建制优化,相对独立的市辖区的城区人口增长与收缩现象也应当受到重视。
4.1.2 实行统一的工矿区、开发区等城乡分类标准
《统计上划分城乡的规定》明确指出“与政府驻地的实际建设不连接,且常住人口在3000人以上的独立的工矿区、开发区、科研单位、大专院校等特殊区域及农场、林场的场部驻地视为镇区”。但实际界定过程存在不一致的情况。例如,很多城市的工矿区、开发区在2010年前两位代码为“11”,属性为“城区”,而到2020年前两位代码才调整为“12”,属性变为“镇区”。而且,仅有河北省、山西省、内蒙古自治区、吉林省、江苏省、安徽省、山东省、河南省、湖南省、西藏自治区及部分地级市对工矿区、开发区等调整为镇区。另外,在工矿区和开发区的认定和分类方面也存在不准确的问题,例如,苏州工业园区常住人口规模达到113.39万人,在2010年已然是城区的一部分,应当按照统一标准纳入城区,但是2020年城乡分类被调整为镇区。如此,由于不同地区分类标准不同,不仅影响城市规模等级划分的可比性,同时还影响到城区人口规模增长量或收缩量的可比性。
4.1.3 加强县城人口增长或收缩识别
县城在建制上属于镇,因而县城人口属于镇区人口。但是,中国并没有单独发布县城所在建制镇的镇区人口,一般是和其他建制镇一并加总,发布县域镇区人口总和。1999年国家统计局颁布的《关于统计上划分城乡的规定(试行)》中将“县及县以上人民政府所在建制镇的镇区”单独设置代码“121”,“其他建制镇的镇区”设置代码“122”。而后替代的《统计上划分城乡的规定》并没有延续上述代码设置方案,只是在《统计用区划代码和城乡划分代码编制规则》指出城乡划分代码包括13位、14位、15位、16位和17位,其中13位、14位为城乡属性代码,用“1”表示县级政府驻地。然而,国家统计局每年只公布15位、16位和17位城乡分类代码,只能区分城区、镇区和乡村,不能区分县城和其他一般建制镇。因而,现有数据很难支持全国层面的县城人口核算及其增长、收缩状态识别。2022年中共中央办公厅、国务院办公厅印发《关于推进以县城为重要载体的城镇化建设的意见》指出县城人口增长或收缩状态应受到高度重视。因此,无论是城乡属性代码还是县城人口数据,都应加强公开。
4.2 当前收缩城市的形成原因
2010—2020年,中国常住人口城镇化率从49.68%升至63.89%,农村人口进入城镇地区态势明显,大多数城市依然保持人口增长。收缩城市的出现是少数现象,究其原因:
4.2.1 经济发展因素
一是经济转型发展的阵痛,尤其是东北地区城市及一些资源型城市,普遍面临经济结构调整和转型的现实问题,一旦经济发展乏力,就业机会缩窄,根据经典的人口迁移推拉理论,这些城市不仅对腹地农村人口及外来人吸引力下降,自身也会出现人口流失,出现人口净迁出现象。《中国城市统计年鉴(2021年)》数据显示,48个收缩城市大部分城市GDP增速低于全国平均水平,双鸭山市、鹤岗市、七台河市、抚顺市、丹东市等城市GDP呈现负增长,出现经济收缩与人口收缩伴生现象。二是经济区位及周围城市竞争的作用,例如地处珠江三角洲和粤闽浙城市群之间的汕尾市,不仅吸引外来人口的竞争力有限,而且也存在本地人口向周边地区流出现象。三是城市建设发展周期的影响,最典型的那曲市,2006年青藏铁路通车后那曲城区迎来快速发展和建设时期,但随着城市建设逐步稳定后部分行业从业人员明显下降,据人口普查数据计算,那曲市色尼区批发和零售业从业人口从2010年的5010人下降至2020年的670人。
4.2.2 人口结构因素
尤其是东北等早年“独生子女”计划生育严格的地区,出现人口老龄化、低生育率等人口结构转型现象,伴随着生育理念、生育行为的转变,使得自然增长的人口规模无法补偿净迁出的人口规模,加剧了城区人口收缩。2020年第七次人口普查显示,辽宁、吉林和黑龙江“城区”部分的总和生育率分别为906.81‰、868.05‰和761.37‰,均处于全国下游水平。
4.2.3 发展政策因素
最典型是温州市,其城市经济发展水平保持较高水平,但是由于过去10年的老城区都市更新政策,实施“大拆大整”专项行动,很多城中村改造致城区外来人口选择迁居或离开。2010年,温州市鹿城区、龙湾区和瓯海区累计户籍登记在外省的外来人口共140.98万人,2020年这个数字已经下降至89.36万人,10年间外省外来人口减少51.62万人。这与经济结构或人口结构导致的收缩是完全不同的,可以理解为政策导致的阶段性收缩。
需要指出的是,不同收缩城市的形成原因是多样且复杂的,上述仅针对48个收缩城市的主要影响因素作简要概括。
4.3 未来收缩城市的发展趋势
按照《国家人口发展规划(2016—2030年)》,中国处于人口发展的关键转折期,同时随着中国城镇化发展已经进入中后期发展阶段,按照国际经验及国内实际,未来收缩城市数量及收缩规模很可能出现增长。一方面,全国性的人口总规模增长惯性减弱将深刻影响城市人口自然增长。根据联合国《世界人口展望(2022)》预测,中国总人口很快迎来负增长。虽然城市地区在一定时期内仍然保持正增长态势,但是同样面临老龄化程度不断加深、少儿占比呈下降趋势等结构性问题,一旦城市自然增长率下降或出现负增长,将可能引发城区人口规模下降。另一方面,城镇化中后期的“城-城”人口迁移将加剧部分城市人口流失。根据泽林斯基的人口迁移转变理论,随着城镇化进入中后期,“乡-城”人口迁移活跃度降低,“城-城”人口迁移活跃度提升,就业机会较少的城市人口将向就业机会较多的城市集聚,部分城市出现人口净迁出。因而,目前48个收缩城市只是少数现象,中国收缩城市的高峰可能尚未出现。从长期来看,在老龄化、低生育率、城市间人口相互迁移等叠加作用下,收缩城市将成为中国城镇化后期阶段的重要城镇化发展现象之一。
5 结论
根据《国务院关于调整城市规模划分标准的通知》确定的“城区常住人口”城市规模划定标准,本研究通过“城区常住人口”负增长识别收缩城市。采用2010年和2020年两期人口普查“城区常住人口”数据,通过对行政区划调整、独立工矿区、开发区等进行空间一致性处理,开展2010—2020年收缩城市识别。主要结论包括:
(1)2010—2020年中国收缩城市仅有48个,而且绝大多数收缩城市的城区常住人口减少规模低于5万人。收缩城市主要分布在东北地区,大多属于县级市和中小城市,不乏资源型和资源枯竭型城市。
(2)使用错误口径会造成收缩城市数量和规模的夸大,“城区常住人口”标准口径能够更科学的反映城市人口变化。未来,应当重视相对独立的市辖区和县城城区人口核算,并将城区内部或毗邻城区的工矿区、开发区等纳入城区范围,实行全国统一的工矿区、开发区等城乡分类标准。同时,加强逐年的“城区常住人口”数据公开,开展城市人口收缩的及时性识别。
(3)当前中国收缩城市主要受到自身经济发展、人口结构、城市政策等因素的影响。未来随着全国性的人口总规模增长惯性减弱和城镇化发展进入中后期,在老龄化、低生育率、城际人口迁移活跃等叠加作用下,中国收缩城市的数量和规模很可能出现明显增长。
本研究对收缩城市的研究局限于“城区人口减少”。事实上,收缩城市不仅仅局限于人口减少这一个维度,还涉及经济收缩、建筑物闲置、基础设施更新不足等更广范围的维度。即使在人口维度,随着人口流动的日益活跃,实有人口、瞬时人口、昼夜人口等概念对城市发展意义将进一步提升,同时城市与城市之间网络关联将突破实体地域的概念,向更为广泛的空间边界延展。同时,加强“收缩城市”向“收缩城镇”的拓展研究,关注县城和一般建制镇镇区的人口收缩现象。这都是未来收缩城市识别研究的重要科学问题。
致谢
真诚感谢匿名评审专家在论文评审中所付出的时间和精力,专家对本文收缩城市判定依据、图表完善、结论梳理方面的修改意见,使本文获益匪浅。
参考文献
Understanding urban shrinkage in China: Developing a multi-dimensional conceptual model and conducting empirical examination from 2000 to 2010
Varieties of shrinkage in European cities
The issue of urban shrinkage has become the new ‘normal’ across Europe: a large number of urban areas find themselves amongst the cities losing population. According to recent studies, almost 42 per cent of all large European cities are currently shrinking. In eastern Europe, shrinking cities have formed the overwhelming majority – here, three out of four cities report a decrease in population. Shrinkage has proved to be a very diverse and complex phenomenon. In our understanding, a considerable and constant loss of population by an urban area classifies it as a shrinking city. So, while the indicator of shrinkage used here is rather simple, the nature of the process and its causes and consequences for the affected urban areas are multifaceted and need to be explained and understood in further detail. Set against this background, the article presents, first, urban shrinkage as both spatially and temporally uneven. Second, this article shows that the causes of urban shrinkage are as varied as they are numerous. We explore the ‘pluralist world of urban shrinkage’ in the European Union and beyond. The article provides an original process model of urban shrinkage, bringing together its causes, impacts and dynamics, and setting them in the context of locally based urban trajectories. The main argument of this arrticle is that there is no ‘grand explanatory heuristics’ of shrinkage; a ‘one-size-fits-all’ explanatory approach to shrinkage cannot deliver. To progress and remain relevant, one ought to move away from outcome-orientated towards process-orientated research on urban shrinkage.
收缩城市研究综述
A review of researches on shrinking cities
收缩城市量化计算方法进展
Research on quantitative calculation method of shrinking city
中国城市收缩的综合测度及其时空分异特征研究
On the comprehensive measurement of urban shrink in China and its spatio-temporal differentiation
人口流失与空间扩张:中国快速城市化进程中的城市收缩悖论
Lossing population with expanding space: Paradox of urban shrinkage in China
中国人口城镇化与土地城镇化协调发展的时空特征与驱动因素
Temporal and spatial characteristics and driving factors of coordinated development between population urbanization and land urbanization in China
中国县域土地城镇化的区域差异及其影响因素
DOI:10.11821/dlxb201812005
[本文引用: 1]

中国经历了史无前例的快速城镇化进程,与之相伴随的是更加迅猛的土地城镇化过程。基于2000年和2015年中国土地利用现状遥感监测数据,综合运用空间分析、多元回归和地理加权回归的方法,深入分析了中国县域土地城镇化的区域特征及其影响因素。结果表明:① 中国县域土地城镇化率年均增长2.77%,其中近40%的区县城镇化率年均增长大于3%;在空间上呈现出不同于人口城镇化的扩散趋势。② 中国县域土地城镇化的南北分异规律较东西分异更为明显。土地城镇化的高值区域始终集中在胡焕庸线的东南半壁,而围绕主要的城市群地区则形成“组团式”增长的热点区,地区间差异趋于收敛。③ 人口集聚、经济发展、产业结构、城市特性与地理区位等要素对县域土地城镇化空间分异格局的影响较为显著、稳定,各要素对土地城镇化的影响均具有明显的时空依赖特征。分析揭示县域土地城镇化的时空特征及其动力机制,对于科学认识新型城镇化和实施城乡融合、乡村振兴战略,具有重要的理论价值与现实意义。
Regional disparity and the influencing factors of land urbanization in China at the county level, 2000-2015
In the unprecedented urbanization process in China, urbanized land has expanded quickly at the same pace or even faster than the growth of the urban population. Employing both the ordinary least square and geographical weighted regression, we analyzed the spatial patterns and factors influencing land urbanization at the county level in 2000 and 2015. This analysis was assisted by land-use data for China acquired from the resource and environment data cloud platform. The research reveals the following points: (1) The annual growth rate of land urbanization experienced 2.77 percentages on average from 2000 to 2015. About 40% of the counties witnessed an annual increase of 3% or above. Land urbanization was manifested in a pattern of diffusion, which differed from the continued spatial polarization of demographic urbanization in China. (2) Geographically, the north-south differentiation of land urbanization was clearer than the east-west differentiation. And the high-value regions tended to be located to the southeast of "Hu Line". Counties surrounding those metropolitan areas were detected as hotspots of land urbanization. In general, there was a convergent trend of land urbanization among regions in China. (3) The factors of population growth, economic development, industrial structure, city/county features, and geographical location have played significant roles in the spatial disparities of land urbanization at the county level. Besides, the spatio-temporal dependence of their influences were also explored. This study on land urbanization and its influencing factors at the county level advances our theoretical and practical understandings of the new-type urbanization, urban and rural integration, and rural revitalization strategies in contemporary China.
Urban sprawl among Chinese cities of different population sizes
新时代中国人口老龄化长期趋势预测
Long-term Trends Projection of China's Population Aging in the New Era
珠三角快速城镇化地区发展的增长与收缩新现象
DOI:10.11821/dlxb201710006
[本文引用: 2]
珠江三角洲是世界范围内经济和城镇发展“增长奇迹”的典型地区,当中以东莞为代表的“外向型城镇化”模式长期受到国内外学者的关注。然而,2008年的金融危机冲击对东莞经济造成巨大冲击,市域范围同时出现了普遍增长与局部收缩两种截然不同的新空间现象。随着中国经济步入新常态,城镇化快速发展过程中伴随的局部收缩现象逐渐引起学界和社会的广泛讨论。基于此,从城镇发展要素的集聚与流动出发,结合经济、人口和用地三个维度,提出理解城镇增长与收缩的分析框架,并对不同类型特征的城镇进行区分:持续增长、转型增长、潜在收缩与显著收缩。在实证分析部分,文章以东莞为案例,通过考察各镇街单元城镇增长与收缩的时间演变和空间格局,结合典型城镇案例分析,从经济危机冲击、刘易斯转折点、路径依赖存在、制度环境安排四个方面探讨东莞城镇增长与收缩的形成机制,最后对增长与收缩的未来深化研究方向进行讨论。
Growth or shrinkage: New phenomena of regional development in the rapidly-urbanising Pearl River Delta
The Pearl River Delta (PRD), a typical area of rapid urbanization with Dongguan as its most representative case of the 'exo-urbanization' model, has thus long been attracting scholarly attention. However, after the financial crisis in 2008, a new spatial phenomenon has emerged in Dongguan, with overall growth and partial shrinkage taking place in the same city area. As the Chinese economy steps into a state of New Normal, partial shrinkage during a process of rapid urbanization has kindled heated debate. Starting from the vacancy phenomenon caused by the outflow of development factors, this paper has integrated three analytical dimensions, i.e., economy, population, and land, to put forward a framework for understanding urban growth and shrinkage. Four types of towns have been identified in Dongguan, featuring, respectively, continuous growth, resurgent growth, moderate shrinkage, and continuous shrinkage. Moreover, time trajectory and spatial pattern of growing and shrinking have been investigated to account for the distribution characteristic of urban growth and shrinkage. Then, through probing the shocks of economic crisis, Lewisian turning point, path dependence existence and institutional arrangement, we have analyzed the mechanisms of urban growth and shrinkage amid rapid urbanization in Dongguan. Conclusions and avenues for future research are discussed in the last section.
广东省人口局部收缩特征及其影响因素: 以东莞莞城为例
DOI:10.13284/j.cnki.rddl.003058
[本文引用: 1]
21世纪以来,广东省在经济和城镇化高速发展的同时也面临着人口的局部收缩,使经济发展的时空格局复杂化。通过实地调研、数理统计、GIS空间分析等定性与定量相结合的方法,分析了广东省人口收缩特征、类型及影响因素,并对东莞莞城进行典例个案分析。结果表明:2000―2010年广东省存在人口局部收缩现象,但总体程度较为轻微且在空间和类型上存在分异;区域发展不平衡、产业结构转型升级、郊区化和行政区划调整等因素导致了广东省人口收缩;莞城的收缩特征主要表现为外来人口持续减少、经济增速持续放缓和城镇功能地位转变3个方面;在主观和客观的推拉力因素作用下,外来人口未来预期发展下降及莞城自身劳动力需求减少共同导致了莞城的人口收缩。
Characteristics and factors of shrinking cities in Guangdong province: A case study of Guancheng in Dongguan city
城市增长与收缩的演变过程及其影响因素: 以黑龙江省煤炭资源型城市为例
DOI:10.13249/j.cnki.sgs.2020.09.006
[本文引用: 1]
中国快速城镇化过程中已经出现了城市增长与收缩并存的现象,其中收缩型城市中又以资源型城市较为典型。研究城市增长与收缩过程及其影响因素有助于优化资源型城市发展路径以及制定合理的规划策略。本研究以黑龙江省鸡西市、鹤岗市、双鸭山市、七台河市为研究案例,从城市比较研究的思路入手,利用均方差决策法、偏最小二乘法等方法定量化表征4市城市增长与收缩过程并分析其影响因素。结果表明:① 4市并不是处于持续收缩的状态,而是增长与收缩交替进行。② 从城市增长与收缩过程的影响因素方面看,鸡西市主要受居民收入与消费情况影响,鹤岗市主要受产业及投资影响,双鸭山市主要受制造业和外部投资影响,七台河市主要受煤炭产量影响。③ 从差异性角度分析,城市增长与收缩过程以及影响因素的差异主要由替代产业选择差异、城市间竞争、外部性影响所决定。
Process and factors of urban growth and shrinkage: A case study of mining cities in Heilongjiang province
In the process of rapid urbanization in China, there has been the coexistence of urban growth and shrinkage, among which resource-based cities are more typical. The research on the process and influence mechanism of urban growth and shrinkage is helpful to optimize the development path of resource-based cities and the appropriate planning response. In this paper, we take Jixi City, Hegang City, Shuangyashan City and Qitaihe City in Heilongjiang Province as case cities. From the idea of urban comparative study, the process of urban growth and shrinkage of the four cities is quantitatively characterized and its factors are analyzed by means of mean square decision-making method and partial least square method. The advantage of using mean square decision-making is to avoid errors of subjective evaluation. The partial least square method has gathered the advantages of PCA, correlation analysis and MLR method. The aim to use PLS here is to solve the multicollinearity problem of variables. The results show that: 1) The four cities are not in a state of continuous shrinkage, but the growth and shrinkage alternately. This result is in line with the characteristic that the development of mining cities change with the mining market. 2) From the perspective of factors of urban growth and shrinkage process, Jixi City is mainly affected by residents’ income and consumption, Hegang City is mainly affected by industry and investment, Shuangyashan City is mainly affected by the manufacturing industry and investment, and Qitaihe City is mainly affected by coal production. The four cities have different influential factors mainly in aspects of social development, external investment, and industrial transformation. In addition, each factors has different influencing extend on different cities. Therefore, we will see that cities with similar resource endowment could have different influential factors on urban growth or shrinkage. 3) From the perspective of difference, the process of urban growth and shrinkage and the difference of influence mechanism are mainly determined by the difference of alternative industry selection, the competition between cities, and the external influence and other factors.
中国东北三省城市收缩的识别及其类型划分
DOI:10.11821/dlxb202106004
[本文引用: 1]
城市收缩是一个受经济全球化影响,并具有区域地方特征的世界性经济社会现象,如何构建快速城镇化进程中“中国化”城市收缩研究理论分析框架,为世界城市收缩研究提供中国经验,是新时期中国地理学者、城市规划工作者亟需重点关注和研究的新命题。本文认为城市收缩本质是城市“发展势能”的相对弱化或绝对退化而引起以人口为核心的经济发展要素的再区位和城市功能形态空间重构的响应过程或状态,其是一个综合概念,一个基于人口变化、经济变化、投资消费变化与财政变化等的多维一体过程,据此构建基于“二步诊断法”的城市收缩识别体系及其类型划分标准,同时针对中国最具典型和代表性的东北三省开展城市收缩的实证分析。结果表明:① 东北三省存在明显的城市收缩现象、且呈现出区域化的发展演化趋势;整体可归纳为资源依赖型收缩城市、“虹吸”型收缩城市、综合型收缩城市及区位制约型收缩城市4种模式,其中资源依赖型收缩城市是主体,占据了整个收缩城市的2/3;② 空间上整体呈现出北高南低的空间格局,与经济发展重心不断南移相呼应;③ 指标维度收缩整体遵循“投资消费与经济下行→人口收缩→财政收缩”的内在演化逻辑关联;④ 立足于“二步诊断法”的城市收缩识别体系及其类型划分标准反映出当前基于人口变化学的识别标准的合理性及其局限性——人口变化学能够在很大程度上识别收缩城市,但是对于划分收缩城市类型、揭示收缩城市内在耦合机理具有一定的局限性;⑤ 实证结果表明“二步诊断法”是合理可行的,其可为中国城市收缩的识别、东北振兴政策的制定提供工具支撑与参考依据。
Identification and stage division of urban shrinkage in the three provinces of Northeast China
Urban shrinkage is a global socio-economic phenomenon embedded in wave of economic globalization and rooted in "localization". And it has become a new proposition for Chinese geographers and urban planners to build a theoretical analysis framework of "Chinese-style" urban shrinkage research in the process of rapid urbanization and to provide Chinese experience for the study of urban shrinkage globally. In this paper, we think the essence of urban shrinkage is a response progress or status that the city's "development potential" is relative weakening or absolute degradation and caused re-location of the population-centric economic development elements and spatial reconstruction of the urban functional forms. It is a comprehensive concept, a multi-dimensional and integrated process based on the changes in population, economy, investment and consumption, and social security. And we establish the identification system and the classification criteria of urban shrinkage types based on the "two-step diagnosis method", and select the three provinces of Northeast China which are the most representative urban shrinkage regions in China to make an empirical analysis. The results show that: (1) There does exist an obvious urban shrinkage phenomenon, and the evolution trend is going to regionalization in the three provinces. And we classify the whole identified shrinkage cities into four categories: resource-dependent shrinking cities, "siphon" shrinking cities, comprehensive shrinking cities and location-constrained shrinking cities. It can be found that the resource-dependent shrinking cities are the main body, occupying 2/3 of the entire shrinking cities. (2) The spatial pattern formed by the identified shrinkage cities shows the characteristics that the number of the shrinkage cities is large in the north and small in the south, which is echoing the situation that the economic center is continuously moving from north to south. (3) From the indicator dimension, it can be found that urban shrinking wholly follows the internal evolutionary and logical connection of "investment and consumption, economic shrinkage→population shrinkage→social security shrinkage". (4) The urban shrinkage identification system and its type classification criteria based on the "two-step diagnostic method" in this paper reflect the rationality and limitations of the current urban shrinkage identification standard based on population shrinkage, although it can identify shrinking cities to a large extent, and have certain limitations in classifying shrinking city types and revealing the internal coupling mechanism of shrinking cities. (5) The empirical results confirm that the "two-step diagnosis method" of urban shrinkage is reasonable and feasible, which can provide tool support and reference basis for the identification of China's urban shrinkage and the formulation of policies for the revitalization of Northeast China.
东北三省城镇收缩的特征及机制与响应
DOI:10.11821/dlxb202104001
[本文引用: 1]
基于城镇收缩视角认识东北三省人口流失与经济衰退问题,对深化中国老工业基地转型理论具有重要意义。本文以东北三省县级市(县)为研究对象,利用ArcGIS与空间计量方法,分析增长与收缩城镇的特征与空间关系,研究收缩城镇的职能差异和空间分布格局,探讨区域城镇收缩的形成机制与应对措施。结果显示:2000年以来,东北三省出现了明显的城镇增长与收缩分异现象,42.85%的县(市)发生城镇收缩问题;增长型城镇制造业与服务业日益高级化;收缩型城镇新型产业发展与产业结构升级缓慢,经济竞争力不断弱化;增长与收缩城镇存在密切的空间关联,增长型城镇一方面通过集聚效应不断吸取收缩城镇的人口、资本等生产要素,另一方面通过传统产业的空间转移加重收缩型城镇的经济转型压力;城镇收缩程度由北至南呈高、低起伏状变化,由东至西呈先增强,后减弱的变化态势,并且加工型城镇收缩程度最高,工矿型城镇次之,旅游与口岸型城镇相对较低;城镇收缩的影响因素包括公共服务设施发展滞后、工业发展与市场需求错位、产业结构关联度低、人口结构老龄化和区域中心地的集聚效应5个方面,且作用强度依次增强。依据经济长波理论与地方发展实际,东北三省未来将经历长期的城镇收缩过程。主动适应收缩,通过城镇精明收缩,对人口与经济要素进行优化重组,是东北三省未来发展应做出的战略选择。
Characteristics, mechanism, and response of urban shrinkage in the three provinces of Northeast China
Understanding the population loss and economic decline in the three provinces of Northeast China from a perspective of urban shrinkage is of great significance to deepening the transformation theory of China's old industrial bases. The main results can be summarized as follows. Since 2000, obvious differences in urban growth and shrinkage have occurred in Northeast China. Some 42.85% of cities showed an urban shrinkage. The manufacturing and service industries in cities of urban growth (growing cities) are increasingly advanced, while the development of new pattern industries and industrial structure upgrading are slow in cities of urban shrinkage (shrinking cities) and the economic competitiveness of these shrinking cities is weakening. There is a close spatial correlation between growing and shrinking cities. On the one hand, growing cities continuously absorb the production factors such as population and capital of shrinking cities through the agglomeration effect, and on the other hand, they increase the pressure of economic transformation of shrinking cities through the spatial transfer of traditional industries. The shrinkage degree varies from high to low from north to south, and shows a trend of 'first strengthening, then weakening' from east to west. The processing cities have the highest shrinkage degree, followed by industrial and mining cities, and the tourism and port cities have a relatively low shrinkage degree. The factors influencing urban shrinkage include the development lag of public service facilities, the misalignment of industrial development and market demand, the low correlation degree of industrial structure, the aging of population structure, and the agglomeration effect of regional central places, their intensity of action enhancing in turn. According to the economic long wave theory and local circumstances, Northeast China will experience a long-term urban shrinkage in the future. It should be a strategic choice to develop this region to actively adapt to the shrinkage, and optimize and reorganize population and economic factors through smart urban shrinkage.
Building a role model for rust belt cities? Fuxin's economic revitalization in question
东北三省人口流失的测算及演化格局研究
DOI:10.13249/j.cnki.sgs.2017.12.002
[本文引用: 1]
东北三省养育了全国8%的人口,但是改革开放以来人口不断外迁和流出,东北三省人口流失问题受到广泛关注。基于2000年以来的人口普查和抽样统计资料,系统地测算东北三省人口流失量,从省级和县市2个空间尺度分析东北三省人口流失的演化格局。主要结论包括:① 2000~2015年,东北三省人口出现持续流失,并且不断加剧。② 东北三省并不是中国人口流失最严重的地区。③ 东北三省内部出现较多人口流失的县市,空间范围呈现扩张。④ 经济动能不足是东北三省人口流失的主要原因。⑤ 东北三省人口发展的真正问题不在数量,而在人口质量和结构,包括人才流失严重、人口老龄化加剧、人口空间结构高度极化等。
Calculation and spatial evolution of population loss in Northeast China
Northeast China (Liaoning, Jilin and Heilongjiang) occupies 8% of total population in China. However, since the opening up and reforming, frequent population out-migration was on-going in Northeast China. The topic about population loss in Northeast China attracts more and more attentions. According to the census and sampling data after 2000, this research calculates the loss population in Northeast China. Based on the provincial scale and county-level scale data, the spatial pattern evolution of population loss is also figured out. The results are as follows. 1) Northeast China faced a continuous population loss during 2000-2015. And population loss in recent years has aggravated. 2) Northeast China is not the most serious population-losing region in China. 3) Most of counties or cities faced population loss in Northeast China. And population loss area in Northeast China was expanding. 4) The inactive economy development was the key affecting factor for the population loss in Northeast China. 5) The key issues that caused by population loss in Northeast China were population quality and demographic structure, such as brain drain, population aging, and population spatial polarization.This research aims to give some policy implications to the new round development in Northeast China.
Shrinking cities in a rapidly urbanizing China
长江中游城市群收缩城市时空变化特征及影响因素
Analysis of the changing characteristics and influencing factors of the shrinking city space-time in the middle-stream city group of the Yangtze River
湖南省多地理尺度下的人口“收缩地图”
DOI:10.11821/dlyj201702006
[本文引用: 1]
基于收缩城市理论,在省域、地州市、县市区和乡镇街道尺度下对湖南人口收缩现象进行定量分析。在全省人口增速放缓和劳动力缩减趋势下,湖南未来的“本地城镇化”和“人口回流”将延续或加剧部分边缘地区的人口收缩。当前各地州市发展规划中的人口和用地增长预期过高,未来人口资源和空间资源分布不相匹配。通过比较人口、城镇化和经济增长数据,总结出三种县市人口收缩类型:“中心袭夺型”、“空心衰减型”和“资源枯竭型”。通过绘制乡镇街道尺度的湖南人口“收缩地图”,发现人口增长在地级、县级中心城市周边集聚,而其他乡镇收缩明显且集聚显著,县级城市是湖南省人口增长/收缩的损益边缘。建议决策者应当开始认识收缩的问题和机遇,建立“紧缩”适宜的空间开发格局,并利用收缩机遇期,实现城镇减量提质。
A multi-scaled analysis of the “Shrinking Map” of the population in Hunan province
成渝城市群城市收缩的空间格局与形成机制研究
Study on spatial pattern and formation mechanism of urban contraction in Chengdu-Chongqing city cluster
京津冀与长江三角洲的局部收缩: 格局、类型与影响因素识别
Urban shrinkage in the Beijing-Tian-Heibei Region and Yangtze River Delta: Pattern, trajectory and factors
中国三大城市群收缩城市“三生”功能耦合协调度分析
DOI:10.3969/j.issn.1004-9479.2023.03.2021226
[本文引用: 1]
以人口密度作为量化标准,识别2012—2017年京津冀、长三角、珠三角三大城市群137个县级以上城市的收缩情况,构建多维度指标体系对收缩城市“三生”功能及耦合协调度时空格局演变特征进行分析,并运用多元回归模型探究其影响因素。研究表明:2012—2017年,三大城市群共40个收缩城市,占城市总量的29.20%,以轻度收缩为主,主要包括资源型城市、核心城市周边中小城市和偏远欠发达城市三种类型。研究期间,三大城市群收缩城市“三生”功能时空格局变化差异显著,京津冀收缩城市综合功能下降趋势最为明显。三大城市群收缩城市“三生”功能耦合协调度水平整体偏低,其中京津冀城市群明显高于长三角和珠三角城市群,地域差异显著。研究表明:不同城市群收缩城市耦合协调度影响因素与功能变化显著指标较为相关,三大城市群城市收缩情况与“三生”功能耦合协调度变化趋势联系密切。
Analysis on coupling coordination degree of production-living-ecological functions in shrinking cities of China's three major urban agglomerations
This article uses population density as a quantitative standard to identify the shrinkage of 137 cities at or above the county level in the three major urban agglomerations of Beijing-Tianjin-Hebei, Yangtze River Delta, and Pearl River Delta in 2012-2017, and construct a multi-dimensional index system to evaluate the shrinking cities The spatial and temporal differences of the production-living-ecological function are analyzed, and the spatial and temporal pattern evolution characteristics of the coordination degree of the shrinking. The research shows that: ① In 2012-2017, there were 40 shrinking cities in the three major urban agglomerations, accounting for 29.20% of the total number of cities, mainly with slight shrinkage, concentrated in the Yangtze River Delta urban agglomeration, mainly including resource-based cities, small and medium-sized cities around core cities and remote underdeveloped cities.② During the study period, the spatial and temporal patterns of the production-living-ecological function of the shrinking cities of the three major urban agglomerations were significantly different. The comprehensive function of the 21 shrinking cities declined, and the production-living-ecological function of the shrinking cities of the Beijing-Tianjin-Hebei urban agglomeration declined most obviously.③The coordination level of the production-living-ecological functional coupling in the shrinking cities of the three major urban agglomerations is generally low, and they are all in low-level coupling and transitional stages. Among them, the coupling coordination degree of the shrinking cities of Beijing-Tianjin-Hebei is significantly higher than that of the Yangtze River Delta and the Pearl River Delta. Urban agglomerations have obvious regional differences; the coupling coordination degree of shrinking cities in the Yangtze River Delta is relatively stable. The shrinking situation of the three major urban agglomerations is closely related to the change trend of the production-living-ecological function and coupling coordination degree. The research results can formulate differentiated production-living-ecological function promotion strategies for the shrinking cities of the three major urban agglomerations, and promote the production-living-ecological function of urban agglomerations.
长三角城市人口收缩的特征、经济效应与政策回应
Characteristics, economic effects, and policy responses of urban shrinkage in Yangtze River Delta
中国人口收缩的城乡分异特征及形成机理
DOI:10.13249/j.cnki.sgs.2021.07.002
[本文引用: 1]
在县市尺度上对2000—2010年人口收缩区的城乡分异特征进行分析,划分出城增乡减型、城乡双收缩型和城减乡增型等类型,并建立人口收缩城乡分异的理论分析框架,探讨了不同类型的形成机理,主要的发现如下:① 2000—2010年,人口收缩单元占比约为38.6%,城增乡减型单元占据绝对主体,达到34.5%,而“城乡双收缩型”和“城减乡增型”单元占比均较低。② 中部地区人口收缩区城镇人口增长普遍较快,东北地区城乡双收缩的特征较为突出,而东部和西部地区存在较明显的空间分异。③ 城镇化水平和经济发展水平对人口收缩城乡分异特征的影响最为显著,城镇化水平较高而经济发展水平较低的人口收缩区越可能出现城镇人口增长缓慢甚至城乡双收缩。④ 经济发展速度、人口自然增长水平、公共服务等因素对人口收缩城乡分异特征也存在一定的影响。
The differences of urban-rural population change and the underlying mechanism in the population shrinking counties in China
In recent years, the continuous decline of the total population at the regional scale has become increasingly obvious. Considering that most regions have still been experiencing the rapid urbanization processes, it is necessary to analyze the differences of urban and rural population changes and its underlying driving forces in the population shrinking areas. Based on the population census data in 2000 and 2010, this article has analyzed the difference characteristics of urban-rural population change in the population shrinking counties by identifying several urban-rural differentiation types, and then we have established a theoretical framework to investigate the underlying drivers. The main findings are as follows: 1) 38.6% of the research samples have experienced population shrinkage in the period from 2000 to 2010, but most of them have been characterized by “urban population increasing and rural population declining” (or “urban growth and rural decline” for short), and these units account for 89.5% of all the shrinking samples, and the proportion of urban-rural population both shrinking type (or “urban and rural both decline” for short) has a relatively low percentage. 2) In the central region, the type of “urban growth and rural decline A”, which means a high urban growth rate, occupies the main part, and Northeast China has a high percentage of the type of “urban and rural both decline”, and there are obvious spatial differentiations in the eastern and western China. 3) The factors of urbanization level and economic development level have the most significant impacts on the differentiation of urban-rural population change among the population shrinking areas: the population shrinking areas with higher urbanization level and lower economic development level will be more likely to experience slow urban population growth and even urban population decline. 4) The growth rate of economic development, the level of natural population growth, and the quality of public services also have certain impacts on the differentiation of urban-rural population change among the population shrinking areas. Based on these findings, we argue that the perspective of urban-rural differentiation can deepen understanding of population shrinkage in China, and it can also contribute to the relevant theories of population shrinkage in a developing context.
中国城市行政地域与实体地域的空间差异及优化整合
DOI:10.11821/dlyj020180881
[本文引用: 2]
中国的城市界定与行政区划紧密关联。根据2010年人口普查数据,系统分析不同尺度城市行政地域与城市实体地域的界定及其空间差异。主要结论:① 按照直辖市或地级市、设区的市和不设区的市、设街道的市和不设街道的市的层级,城市行政地域范围依次收缩,但是都大于城市实体地域范围。按照实体地域界定,2010年中国城市人口仅占30.18%。② 城市实体地域更能客观地反映城市位序规模的分布状态,而按照城市行政地域会导致规模或排序偏差。③ 未来在行政区划调整时,着重考虑撤县设市、增设地级市、确立乡级行政区划调整标准等,在建立城市实体地域时,可从独立市辖区、县城、特大镇等方面优化,并加强统计信息公开。
City administrative area and physical area in China: Spatial differences and integration strategies
The definition of city is connected to administrative division system in China. It is important to understand the spatial difference between city administrative area and city physical area. According to the population census data in 2010, we distinguished city definitions in multiple administrative levels, including municipality cities, prefectural cities, cities with districts, cities without districts, cities with sub-districts and cities without sub-districts. In addition, we compared the spatial areas between city administrative cities and physical cities area and put forward some integration strategies. The main results are listed as follows. (1) Among various administrative cities, municipality cities and prefectural cities were larger. The following ones were cities with districts and cities without districts. The areas of cities with sub-districts and cities without sub-districts were relatively small. City physical area reflected the real landscape of a city, which was smaller than all kinds of city administrative areas. It only covered 0.32% of the whole area in the mainland of China but had 30.18% of Chinese population in 2010. (2) To classify city scale hierarchies, the population in city physical area was a better measure than the population in city administrative area. According to the population in the physical area, Shanghai is the largest city in China in 2010. (3) China's city physical area definition was also affected by city administrative definition. We suggested China's city administrative division adjustment should concerns more on county-to-city conversion and new prefectural-city establishment. It is better to regard the population city physical area as a reference index for administrative division adjustment. For the definition of the city physical area, independent municipal district, county seat and large towns were suggested as the independent city physical area. Besides, we recommended to open the statistical data related to city physical area. We do hope our research can be beneficial for policy implications for China's administrative adjustment and city physical area studies.
收缩型城市: 认知误区、统计甄别与测算反思
DOI:10.11821/dlyj020200359
[本文引用: 2]
收缩型城市是中国城镇化、空间规划与城市治理的全新命题。论文在简要梳理收缩型城市相关文献的基础上总结了当前收缩型城市研究在中国的认知误区。因人口统计口径不一致、划分标准不可比、数量属性与地域空间脱节等原因给科学清晰的识别收缩型城市提出了挑战。在周一星、史育龙(1995)建议的基础上,论文提出了基于实体地域对比与行政地域互验来分析全国城市人口的增减变化及收缩型城市的甄别框架,测算表明:全国有114个建制市2010年的“城人口”规模低于2000年“市人口”规模,但由于2000年“市人口”的偏大统计以及2010年“城人口”存在的“个别水分”,这些城市也未必就全是“收缩型城市”;在剔除乡村人口较高的“城市型政区”后,全国2000年和2010年人口处于净流出状态的建制市分别为56个和75个。论文认为:中国应尽快建立城市实体地域概念,推进城市化区域协同统计制度;要构建“时空对齐”的全国常住人口地理信息系统数据库并综合考虑各地行政区划建制差异,持续推进城乡人口的精准划分。
Shrinking cities: Misunderstandings, identifications and reflections
While China′s urbanization has been characterized by 'growth-oriented' development models, the recent literature has highlighted the emergence of urban shrinkage in China, i.e., cities and regions that endure sustained population losses. This is especially the case for some resource-based cities in Northeast and North China, which have been losing their population and suffering from stagnant and even negative local GDP growth. Shrinking cities is a new phenomenon for research in the areas of population-resources-environments, spatial planning and urban governance in China. Based on a brief review of related literature, this paper summarizes some misunderstandings in the research of shrinking cities in China. It is a challenge to identify shrinking cities scientifically because of different demographies, different classification standards and disconnection between attributes data and geographic units. Extending from the suggestion from Zhou and Shi (1995), this paper, based on urban physical areas comparison and urban administrative areas test, analyzes the changes of China′s urban population and proposes a framework to identify the shrinking cities. The results show that there are 114 designated cities, in which the population size of the "Chengrenkou" (residential population in the built-up area) in 2010 was smaller than that of the "Shirenkou" (residential population in the administrative area) in 2000. However, due to a larger "Shirenkou" size in 2000 in statistics than in actual situation, and also several inflated figures of "Chengrenkou" in 2010, the exact number of "shrinking cities" is less than 114. After excluding "urban administrative areas" with a larger rural population, 56 cities and 75 cities were in net outflow in 2000 and 2010, respectively. The results are highly policy-relevant, therefore we should adjust future policies regarding urban shrinkage management. Finally, this paper argues that China should establish the concept of urban physical areas and promote the regional collaborative statistical system of urbanization. And it is also necessary to build a "spatio-temporal aligned" geographic information system database of China's resident population and take the regional differences in the administrative divisions into account in order to continuously promote the accurate division of urban and rural population.
基于百度慧眼的中国收缩城市分类研究
DOI:10.11821/dlxb202110010
[本文引用: 1]
收缩城市是快速城市化过程中不可忽视的一类城市,按照城市人口变化格局,开展收缩城市分类研究,是发现城市人口“空洞”及变化特征的重要一环。国际上将收缩城市主要分为穿孔型、圈饼型和边缘型,中国的收缩城市究竟包括哪些类型?尚缺少研究证实。本文以中国实体城市为分析单位,利用百度慧眼2016年11月─2018年11月200 m格网的常住人口数据,发现常住人口减少的实体城市共1506座,占实体城市总量(3022座)的49.8%。选取人口较为密集且在研究时段内出现严重收缩现象的126座收缩城市为研究样本,探讨中国收缩城市分类问题。分析表明:126座收缩城市样本多分布在秦岭淮河一线以北地区,包括穿孔型、全局型、局部型、圈饼型、边缘型等5种类型。其中,穿孔型收缩城市最多,共47座(37.3%),为中国收缩城市的主导类型,主要分布于黑龙江、内蒙古、甘肃;全局型收缩城市有33座(26.2%),主要分布于甘肃、陕西;局部型收缩城市有25座(19.8%),主要分布在黑龙江、内蒙古;圈饼型收缩城市有18座(14.3%),主要分布在内蒙古;边缘型收缩城市有3座。“重速度、轻质量”的前半程城镇化,以“增长”为主导的城市规划执念,资源枯竭或经济转型导致传统工业企业衰落解体,政府主动调整下的产业转移等是产生穿孔型收缩城市的主因。研究为政府精细调整城市发展重心、优化土地利用结构、提高城市宜居性、开展收缩语境下的城市规划与设计,提供了科学依据。
Classification of shrinking cities in China using Baidu big data
In the context of rapid urbanization, shrinking cities cannot be ignored. The classification of shrinking cities according to the patterns of urban population changes is the key to reveal the "hollow" and changing characteristics of the population. Researchers classified the shrinking cities in Western developed countries as "perforated", "doughnut" and "peripheral" types. However, there is a lack of evidence showing the types of shrinking cities in China. This paper takes the redefined physical cities in China (excluding Hong Kong, Macao and Taiwan) as the study area, and employs Baidu Huiyan's 200 m × 200 m grid cell permanent population data from November 2016 to November 2018 to identify different types of shrinking cities in the country. Our results show that 1506 physical cities have experienced a population reduction between 2016 and 2018, accounting for 49.8% of the total number of physical cities (3022). Furthermore, in order to accurately identify the types of shrinking cities, 126 densely populated and severely shrinking cities during the study period were selected as the research samples, mainly located to north of the Qinling Mountains and Huaihe River of China. Our analysis shows that the shrinking types of the sample cities can be classified into five categories: "perforated", "complete", "local", "doughnut", and "peripheral". The number of cities with perforated shrinkage is the largest, which numbered 47 (37.3% of the sample cities), most of which are found in Heilongjiang Province, Inner Mongolia Autonomous Region and Gansu Province. Complete shrinkage ranks the second, including 33 cities, which accounts for 26.2% of the samples, and mainly distributed in Gansu and Shaanxi provinces. The numbers of shrinking cities with local, doughnut and peripheral types are 25, 18 and 3, respectively. These cities are mainly distributed in Heilongjiang and Inner Mongolia. This is because the governments paid more attention to the development speed over quality during the first half of China's urbanization process, and adopted a growth-oriented urban planning strategy. Traditional industries declined due to resource depletion or economic transformation, and the transfer of industries under active government adjustment, all of which contribute to the emergence of perforated shrinkage. This study could provide scientific evidence for micro management of urban development, optimization of land use pattern, improvement of urban livability, and conduct of urban planning and design in the context of urban shrinkage.
Identifying shrinking cities with NPP-VIIRS nightlight data in China
Urban shrinkage in a developing context: Rethinking China's present and future trends
Redefining Chinese city system with emerging new data
Urban shrinkage with Chinese characteristics
This study exposes and maps a hitherto little‐known dimension of China's urban geography – that of shrinkage, directly affecting one in 10 of its cities. Urban shrinkage is revealed to be a growing concern for the most populous country on earth, with the absolute number of shrinking cities rising by 71% from 164 in the 1990s to 281 in the 2000s. By developing its own definition of the city as an urban area (UA) in the Chinese political‐administrative context, this paper builds a morphologic taxonomy of China's shrinking cities. This reveals the overall net population loss across Chinese shrinking cities more than doubling since 1990, reaching 7.3 million inhabitants in 2010. Sixty‐eight Chinese UAs, mostly in north‐eastern China, are found to have been shrinking continuously since 1990. Despite the multifaceted and entangled make‐up of urban shrinkage, the paper identifies four distinct causes of this geographical phenomenon in China: (1) state‐incubated reindustrialisation and economic restructuring, impacting upon 63% of all shrinking UAs; (2) the country's new economic geography, with the underlying centripetal forces of agglomeration pushing around 34% of all shrinking cities towards marginalisation; (3) state‐propelled demographic change, leading to natural population decline in 26% of Chinese shrinking cities; and (4) state‐sponsored mega‐shrinkage, responsible for urban population loss in almost 20% of all the cases. This study further provides a theoretically informed reflection on the peculiarity of shrinkage in China and its public policy implications.
建立中国城市的实体地域概念
DOI:10.11821/xb199504001
[本文引用: 1]
本文总结了我国在城市的行政地域与景观地域严重背离的情况下,继续使用行政地域区分城乡的种种弊端,认为解决这一问题的关键在于建立适合中国特点又具有国际可比性的城市实体地域概念,以此作为城乡划分及统计的地域基础,文章提出以下限人口规模、非农化水平和人口密度三个指标定义城市实体地域,并在大量实证研究的基础上,通过对中国城市空间形态的分类,提出了一套完整的划分实体地域的方法和工作程序。
Toward establishing the concept of physical urban area in China
中国城市人口规模结构的重构(一)
Reconstructing city population size hierarchy of China based on the Fifth Population Census(1)
城镇化新形势下的城乡(人口)划分标准讨论
A discussion on the definition of urban/rural population in the Chinese urbanization process
基于新标准的中国城市规模等级结构演变研究
Research on the evolution of city-size hierarchy in China based on new standard
中国城市规模划分新标准的适用性研究
Applicability of the new standard of city-size classification in China
The new standard of city-size classification in China that divides all cities into five categories and seven subcategories, which was published in 2014, has gained popular attention. However,there have been various results of city-size classification due to different interpretations of the new standard. This article compares the new standard with the old standard and analyzes the city-size hierarchy of China in 2010 to evaluate the applicability and limitations of the new standard. The results show that the new standard has improved significantly over the old standard by changing the definition of population statistics, definition of urban space statistics, and the classification standard. Comparing the classification results based on the new and the old standards as well as other methods, the number of megacities and big cities reduced significantly while the number of small cities increased. The new result shows a clear pyramid structure of city sizes, which conforms to the central place theory and the rank-size rule. Thus, the new standard provides better guidelines to city management. According to the 6th census data in 2010, China has 12 megacities, 58 big cities, 93 medium-size cities, and 493 small cities. The majority of the higher rank cities are located in national-level urban agglomerations in southeastern China. However, the new standard also has some limitations. Urban resident population statistics that is a key in the new standard are often unavailable in non-census years, and the classification result is affected by adjustments of urban administrative boundaries. Further research on urban area identification and data sharing is urgently needed.
改革开放以来中国行政区划格局演变与驱动力分析
DOI:10.11821/dlyj201502005
[本文引用: 1]
行政区划变更与社会经济发展密切相关,也影响着社会经济的健康发展。主要分析了1978年以来35年间中国县级以上各类型行政区的数量变化,根据变化特征和规律划分出四个发展阶段,阐述了各个阶段行政区划空间格局的发展变化,总结了中国行政区划演变的五种主要模式:建制变更、行政区拆分、行政区合并、建制升格以及新设立行政区。行政区划格局的演变受多种因素的影响,城镇化进程、中心城市的空间拓展、人口的集聚与增长、交通和通讯条件的改善以及政策因素都是行政区划格局演变的重要驱动力。在新型城镇化背景下,应该加强中国行政区划时空格局演变和驱动力分析,以期为中国未来的行政区划调整和城镇化的健康发展提供一些指导与借鉴。
Spatial pattern evolution and driving force analysis of administrative division in China since the reform and opening-up
The changes of administrative divisions are closely related to social and economic development, and affect the health of the social and economy development. This thesis mainly analyzes the variation in value of various kinds of administrative divisions which are above the county level during the last 35 years (1978-2013). It is divided into four stages according to the varying characteristics and pattern which are 1978-1982, 1982-1996, 1997-2003 and 2004-2013.The charts and diagrams illustrated the evolution of temporal-spatial patterns of each stage. The number and proportion of counties have been declining. During 1978-1996, the number of county-level cities had been rising and was mainly concentrated in the eastern coastal region. Thus, the Yangtze River Delta, Pearl River Delta, Beijing-Tianjin-Hebei region and other city groups formed. The number and proportion of municipal districts are growing steadily. The municipal districts are concentrated in the eastern and northeastern regions. Since 2003, the spatial distribution pattern of administrative divisions is basically stable. Now, municipal districts and county-level cities are mainly concentrated in the eastern and northeastern regions, but counties are mainly concentrated in the central and western regions.This paper summarizes the five main modes of the administrative divisions of China which are the change of the organizational system, the division of the administrative districts, the combination of the administrative districts, the upgrade of the organizational system and the establishment of the administrative districts.The pattern of evolution of administrative divisions is affected by many factors. This thesis draws the conclusion that the important driving forces include the progress of urbanization, spatial expansion of the central cities, agglomeration and growth of population, the improvement of the transportation and communication conditions and the government policies. Under the new urbanization background, this paper aims to provide some guidance and references for the future adjustment of the administrative districts in China and healthy development of urbanization through strengthening the study on the evolution and driving force of the temporal-spatial pattern in China's administrative districts.
