

1 引言
知识经济时代,科技创新成为经济社会发展的主要驱动力。人才是专业化知识与技术的重要载体,是科技创新活动最为核心的要素。全球各个国家与地区高度关注如何培养人才、吸引人才、留住人才和服务人才,竞相出台各种人才政策。2021年9月,习近平总书记在中央人才工作会议上强调,要深入实施新时代人才强国战略,加快建设世界重要人才中心和创新高地。党的二十大报告强调要深入实施科教兴国战略、人才强国战略和创新驱动发展战略,着力形成人才国际竞争的比较优势。构筑高水平人才高地和形成人才发展雁阵格局,必须首先掌握人才流动和人才集聚的规律。因此,分析中国人才的空间分布特征,揭示影响人才空间分布的主要因素,对于理解人才分布规律,优化人才分布格局,营造人才发展的良好环境具有重要意义,可以为中央和地方政府制定人才政策提供借鉴参考。
众多学者就人才分布的空间格局与影响因素开展了广泛的理论与实证研究。简言之,人才分布格局主要受地区人才培养和人才迁移两个方面的影响,人才迁移的作用日益凸显。人才培养方面,地区高等教育事业的发展对人才集聚起到关键的作用。Abel等的研究发现,在劳动力市场的供给侧,高校为其所在的地区培养了大量高学历人才,在劳动力市场的需求侧,高校及其相关企业直接提供了大量高技能就业岗位,留住本地培养的人才并吸引外地人才[1]。人才迁移方面,新古典主义迁移理论侧重于劳动力市场方面的因素,认为劳动力迁移的主要原因在于不同地区之间劳动回报率的差异,劳动力大规模的迁移最终导致迁出地和迁入地劳动回报率达到一个均衡的状态[2⇓-4]。而人口迁移的均衡理论认为,随着社会发展和基本物质需求的满足,人们愈来愈重视自身的生活品质,因此劳动回报率的区域差异不足以解释二战后美国等发达国家大规模的人口迁移,地区舒适性应该被纳入人口迁移的分析框架[5⇓-7]。地区舒适性主要包含自然环境舒适性、公共服务供给等方面。在自然环境的舒适性方面,Graves提出气候(包括温度、湿度等)对人口迁移有重要影响,在个体总体效用一致的前提下,一个地区的收入水平高本质上是对该地区舒适性低(如气候条件恶劣)的补偿,因此劳动力发生迁移的根本原因是追求高生活品质[8]。在城市舒适性方面,Glaeser等的“消费城市”假说认为,现代大都市将承担越来越重要的消费功能,一个城市能否在激烈的人才竞争中脱颖而出,取决于其能否为居住在这个城市的人才提供高品质的服务与消费品[9,10]。Clark等也持类似的观点,认为进入后工业化时代,城市经济增长和活力越来越取决于地区舒适性和公共物品的供给[11]。Florida提出了著名的3T(即人才talent、技术technology、包容tolerance)理论,指出包容性强的地区能够吸引大量的科技人才,科技人才的大量集聚能够驱动高新技术产业的发展和经济的增长[12,13]。
近年来,随着中国的经济社会转型发展,人才成为推动区域经济社会高质量发展的核心要素,各地区竞相出台人才吸引政策,人才的空间分布与流动成为地理学、人口学等学科关注的热点。已有研究通常以学历、职业和职称作为衡量人才的标准[14⇓⇓⇓-18],部分学者关注科研工作者[19⇓⇓-22]、高校毕业生[23⇓-25]和设计创意人才[26]等特定类型的人才。基于2000—2015年的人口普查数据和全国1%人口抽样调查数据的研究表明,中国的人才分布存在严重的不均衡性,东南多西北少,三大城市群逐渐成为国家级的人才高地,重庆、计划单列市和省会城市的人才也较为集中[16⇓-18,27]。人才持续从内地省份流向沿海省份,三大城市群是全国最主要的人才流入地,中部地区和东北地区的人才流失最为严重[28⇓⇓-31]。关于人才空间集聚影响因素的探讨,早期的研究关注经济机会和行政力量方面的因素,近几年的研究开始关注地区宜居性所起到的作用[16⇓-18,27,32⇓-34]。在经济机会方面,不同区域间薪酬水平、失业率和产业结构的差距塑造了中国人才的空间分布格局和人才迁移的主要流向[16⇓-18,27,34]。在行政力量方面,省会城市和计划单列市集中了大量的公共资源,公共服务水平高,相对于普通城市而言更具吸引力[17,18]。在地区宜居性方面,学者们发现气候条件、公共服务质量、交通可达性和消费设施是人才集聚的重要影响因素。高工资水平往往伴随着高生活成本,特大城市相对高昂的生活成本对人才尤其是青年人才具有明显的挤出效应[17,24,28]。此外,高等教育规模扩大和质量提升对人才集聚有一定的带动作用[20,35]。
综上所述,已有针对人才分布的研究视角多样,内容丰富。然而,既有的中国人才空间分布研究仍存在以下几点不足:首先,由于受人口统计数据发布周期的影响,既有研究基于2015年及以前的人口普查数据和1%人口抽样调查数据,分析全国的人才分布格局,时效性相对欠缺。近两年有学者基于新发布的第七次全国人口普查数据,揭示2020年全国所有人口、流动人口和城乡人口的空间分布及其变动特征,但尚没有研究探究2020年高学历高技能人才群体的空间分布格局[36⇓⇓⇓-40]。其次,前人大多在省级或者地级行政区尺度上刻画人才的空间分布格局,缺乏在更精细的地理尺度上揭示区域与城乡人才资源分布的不均衡特征。第三,既有研究大多基于人才总量或者人才密度研究人才空间分布的不均衡程度。然而,某地区的人才空间集聚度高,主要的原因可能是产业规模大和劳动力基数大,不一定是该地区的产业结构高级化和人口素质高。综合运用人才密度和人才占比两个指标,可以更全面地了解人才空间分布的状况。为了弥补既有研究的不足,本研究基于县级和地级尺度的第五次、第六次和第七次全国人口普查数据,运用描述性统计分析和泰尔指数及其分解方法,揭示2000—2020年中国高学历人才的空间分布特征及变化趋势,测度人才分布的空间不均衡水平,运用多元线性回归模型,识别地区人才密度与人才占比的影响因素。此外,鉴于城市群是建设全国乃至世界人才中心与创新高地的重要单元,且城市群地区人才集聚的影响因素可能有别于其余地区,本研究把全国的行政单元分为城市群和非城市群两个组别,并开展两个组别的对比分析。
2 数据来源与研究方法
2.1 研究区域
本研究的研究区域为中国的31个省(自治区、直辖市),不包括香港特别行政区、澳门特别行政区和台湾省。本研究首先在县级尺度上刻画人才的空间分布格局,由于2000—2020年期间部分县区发生了行政区划调整,在刻画人才密度与人才占比的空间差异时,按每个年份的地理界线来准确还原当年的情况,每个年份的研究对象分别为全国2872个(2000年)、2868个(2010年)、2854个(2020年)市辖区、县级市、县、旗、林区和特区(统称为“县区”);在进行增速测算和年份之间的比较时,根据行政区划调整进行了行政区划的合并处理,处理后共有2510个基本研究单元。其次,鉴于县级的社会经济统计数据缺失较多,本研究在地级及以上尺度识别人才密度与人才占比的影响因素,研究对象包括全国286个地级行政单元(地级市、地区、自治州和盟)和4个直辖市(简称“地级行政单元”)。鉴于部分地区、自治州和盟社会经济统计数据的缺失,本研究在地级及以上尺度的研究单元数量为290个。鉴于2000—2020年期间部分地级行政单元发生了行政区划调整,为确保数据的可比性,在开展影响因素分析时,从样本中剔除发生过重大行政区划变更的行政单元。
2.2 数据来源
本研究所使用的人才数据来源于2000年、2010年和2020年《中国人口普查分县资料》[41⇓-43],其余社会经济数据来源于《中国统计年鉴》[44]、《中国城市统计年鉴》[45]等。本研究的研究对象为高学历人才(简称“人才”),指拥有本科及以上文化程度的人(包括本科院校的毕业生、肄业生和在校生)。需要指出的是,由于国家统计局和各省统计局没有公布各市和各县区拥有本科及以上文化程度的学业完成情况,本研究所指的高学历人才包括了本科在校生和本科肄业生。为检验人才数据的可靠性,基于2020年全国31个省份的拥有本科及以上文化程度的就业人口规模(包括毕业生和肄业生,不包括在校生)和总人口规模(即本研究所关注的高学历人才规模,包括毕业生、肄业生和在校生)开展相关分析,发现两个变量的相关系数为0.987,说明本研究的结果基本上能够反映中国人才的分布情况。本研究基于人才密度与人才占比两个指标开展分析,人才密度指每平方公里土地面积的高学历人才数量,人才占比指高学历人才总量占6岁及以上各种受教育程度人口总数的比例。人才密度反映人才在空间上的集聚程度;而人才占比是人才在人口总量中的占比,反映了地区的人口素质。城市群的划分标准参考国家发改委已经发布的各个城市群规划文件,未正式发布规划文件的城市群,采用方创琳课题组出版的《中国城市群地图集》界定范围[46] ①(① 把全国所有的县区分为四个类别:Ⅰ类城市群地区(包括珠三角、长三角和京津冀三大城市群)、II类城市群地区(包括长江中游城市群、成渝城市群、山东半岛城市群、中原城市群、北部湾城市群、关中平原城市群和粤闽浙沿海城市群)、Ⅲ类城市群地区(包括辽中南城市群、哈长城市群、天山北坡城市群、山西中部城市群、滇中城市群、黔中城市群、兰西城市群、呼包鄂榆城市群、宁夏沿黄城市群)和非城市群地区。鉴于长江中游城市群和成渝城市群与全国三大城市群的能级存在一定的差距,本研究把长江中游城市群和成渝城市群归为II类城市群而不是Ⅰ类城市群。)。随着中国高等教育规模的不断扩大,培养的人才数量不断增多,2000年全国人才总量约为1503万人,2010年快速增至约4976万人,2020年已经达到了约1.05亿人。
2.3 研究方法
(1)泰尔指数及其分解。本研究首先运用泰尔指数(Theil index, T)来测度县级尺度下中国高学历人才密度和人才占比的总体不均衡程度。然后,根据19个城市群和非城市群将全国的县区划分为20个区域,将人才占比的泰尔指数分解为区域间的差异和区域内的差异。随后,将区域内差异进一步分解,具体计算公式如下:
式中:
(2)多元线性回归模型。本研究在地级尺度上,基于2000年、2010年和2020年3期人口普查数据,分别采用经典的多元线性回归模型,以人才密度和人才占比为因变量,识别影响人才密度与人才占比的因素。计算公式如下:
式中:被解释变量
同时,为了考察城市群与非城市群人才密度与人才占比的影响因素,针对全国19个城市群中211个地级行政单元及非城市群中79个地级行政单元分别开展回归分析。考虑到模型中可能存在异方差问题,本研究在回归时采用稳健标准误。
3 人才的空间分布格局
3.1 人才密度与人才占比的空间分布格局
基于“高学历人才密度”与“高学历人才占6岁及以上人口的比例”两项指标,以2010年的数据为基准,将全国所有的县区依次分为“低水平”“较低水平”“一般水平”“较高水平”和“高水平”②(② 采用自然断点法进行划分并对断点数值进行四舍五入取整。根据人才密度的高低把所有县区分为五类:低水平集聚(人才密度<1人/km2)、较低水平集聚(人才密度为(1~5)人/km2)、一般水平集聚(人才密度为(5~65)人/km2)、较高水平集聚(人才密度为(65~1150)人/km2)和高水平集聚(人才密度>1150人/km2)。根据人才占比的大小把所有县区分为五类:低人才占比(人才占比<2.5%)、较低人才占比(人才占比为2.5%~6.0%)、一般人才占比(人才占比为6.0%~10.0%)、较高人才占比(人才占比为10.0%~20.0%)和高人才占比(人才占比>20.0%)。)五类,以此刻画人才的空间分布格局。图1展示了2000—2020年中国高学历人才密度与人才占比的空间差异。总体而言,中国高学历人才的空间分布具有以下几个特征:①人才密度分布与人口密度的空间分布规律一致,20年间中国的高学历人才呈现稳定的“东南密集,西北稀疏”的空间分布格局,且东南半壁的人才密度增长速度远高于西北半壁,其中又以城市群的中心城市人才密度增长速度最快。2020年,胡焕庸线西北半壁的人才密度平均值约为1人/km2,东南半壁的人才密度平均值约为23人/km2,东南半壁人才密度大约是西北半壁的23倍。②在胡焕庸线东南半壁,人才密度呈现典型的核心-边缘空间格局,由国家级城市群的核心区域向外围区域逐步降低。除了拉萨和少数几个资源型地区,胡焕庸线西北半壁非城市群地区的人才密度处于很低的水平。2020年,人才密度排名前10位的县区均为中国特大城市的主城区,人才密度排名后10位的县区皆位于青藏高原与南疆地区。③人才占比呈现出鲜明的等级分异特征,高值区呈点状分散分布,大多位于直辖市、省会城市、计划单列市和部分资源型地区。2000年全国绝大多数县区的人才占比水平很低,只有零星几个县区属于高人才占比地区。在其后的20年间,高人才占比地区和较高人才占比地区数量迅速增加。2020年,人才占比排名前10位的县区大多位于直辖市、省会城市、计划单列市和部分资源型地区。此类地区集聚了大量机关事业单位、高等院校和高新技术企业,排名后10位的县区是东部沿海地区欠发达的人口大县和位于“三区三州”的深度贫困地区。
图1
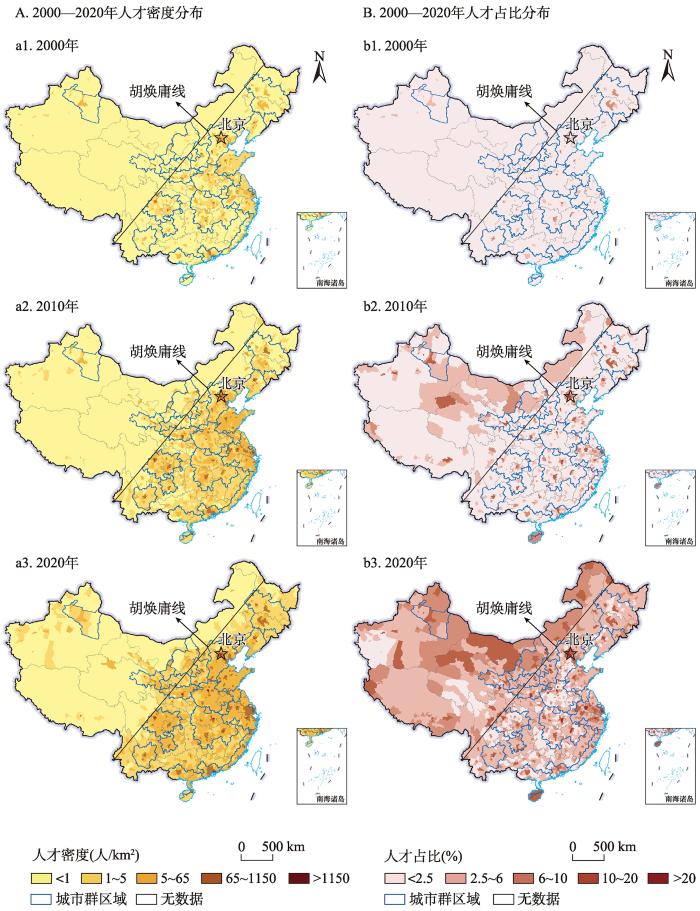
图1
2000—2020年中国高学历人才的空间分布格局
注:该图基于自然资源部地图技术审查中心标准地图(审图号:GS(2020)4630号)绘制,底图边界无修改。
Fig. 1
Spatial distribution of highly educated talent in China, 2000-2020
3.2 人才密度变化率的空间差异
分别计算2000—2010年和2010—2020年两个时期各县区人才密度的变化率③(③ 某县区2000—2010年的人才密度变化率等于该县区2010年的人才密度减去2000年的人才密度,再除以该县区2000年的人才密度,最后乘以100%。)。以2010—2020年为基准,将所有县区分为“密度减少”“基本稳定”“缓慢增长”“中速增长”和“高速增长”五类县区④(④ 采用标准差分类法把所有县区分为五类,并对断点数值进行四舍五入取整:密度减少(密度变化率<0)、基本稳定(密度变化率为0%~2%)、缓慢增长(密度变化率为2%~5%)、中速增长(密度变化率为5%~10%)和高速增长(密度变化率>10%)。)(图2,见第2833页)。总体而言,20年间全国人才密度增速减缓,绝大部分地区的人才密度从增长类型转变为基本稳定类型。2000—2010年和2010—2020年两个时间段的人才密度增长存在明显的空间差异:①2000—2010年,人才密度高速增长的县区主要集中在西藏自治区和四川省西部,零星分布在甘肃、宁夏、云南和内蒙古等西部省份和广东、福建和浙江等东部省份的欠发达地区。该类县区2000年的人才密度处在较低的水平,10年间的增长幅度较大。人才密度中速增长的县区连片分布在内蒙古、青海、云南和海南等省份,零星分布在山西、陕西、河南和贵州等中西部省份以及广东、福建、浙江和山东等沿海省份。绝大多数地区的人才密度增长缓慢,需要注意的是,部分发达的县区(如江苏省南京市的玄武区和湖南省长沙市的芙蓉区)10年间的人才密度基本稳定。仅有13个县区的人才密度在10年间有所下降,包括位于东北和西北人才流失严重的偏远地区(如漠河市和和田县)和面临资源枯竭问题或处于产业转型阵痛期的地区(如鹤壁市山城区)。②2010—2020年,人才密度基本稳定的县区数量大幅增加,占全国县区总量的70%。人才密度增长的县区数量大幅减少,缓慢增长的县区大多位于西藏、新疆、贵州、甘肃和宁夏等西部省份,经济发展水平普遍较低,但也有少量缓慢增长的县区位于经济发达的大城市(如北京市和广州市)。仅有10个县区是人才密度快速增长的地区,包括新疆的和田县、托克逊县、民丰县和青海的循化撒拉族自治县等。人才密度下降的县区数量有所增加,既包括了人才流失严重的偏远地区,也包括了人才承载能力相对较弱的老工业基地。
图2
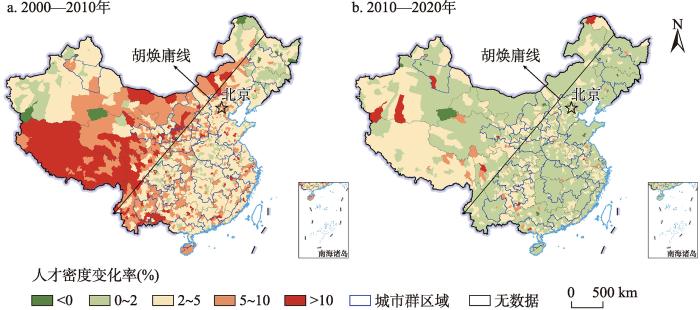
图2
2000—2010年和2010—2020年中国高学历人才密度变化的空间差异格局
注:该图基于自然资源部地图技术审查中心标准地图(审图号:GS(2020)4630号)绘制,底图边界无修改。
Fig. 2
Spatial variation of the density of highly educated talent in China, 2000-2010 and 2010-2020
3.3 人才占比变化率的空间差异
分别计算2000—2010年和2010—2020年两个时期各县区人才占比的相对增速⑤(⑤ 某县区2000—2010年的人才占比的相对增速等于该县区2010年人才占比与2000年人才占比的差,除以全国2010年人才占比与2000年人才占比的差。)。以2010—2020年为基准,将所有县区分为“占比降低”“基本稳定”“缓慢增长”“中速增长”和“高速增长”五类县区⑥(⑥ 采用标准差分类法,把所有县区分为五类,并对断点数值进行四舍五入取整:占比降低(占比相对增速<0)、基本稳定(占比相对增速为0~0.5)、缓慢增长(占比相对增速为0.5~1)、中速增长(占比相对增速为1~2)和高速增长(占比相对增速>2)。)(图3)。人才占比增速以胡焕庸线为界,呈现出不同的特征。胡焕庸线东南半壁呈现出以城市群中心城市主城区为人才占比增长高地、城市群外围地区和非城市群地区人才占比增长缓慢或停滞的特征,西北半壁呈现出人才占比增长高地沿边疆地区连片分布的特征。2000—2020年全国人才占比平均增速提升,长三角、京津冀和中原等少数几个城市群地区和胡焕庸线西北半壁区域的人才占比增速普遍提升,东南半壁其余城市群地区的人才占比增速有所减缓。具体而言,在东南半壁区域,2000—2010年,人才占比中高速增长的县区主要位于城市群中心城市主城区及其周边地区,并零星分布于省内经济增长较快的地级市;人才占比基本稳定的地区位于广大的城市群外围地区和非城市群地区。2010—2020年,长三角、京津冀和中原等少数几个城市群的人才占比中高速增长的县区数量有所增多,连绵化的特征更为显著;其余城市群及非城市群地区人才占比高速增长、中速增长的县区数量有所减少,这类县区多为区域性中心城市。缓慢增长的县区大幅增加,其中有约63%缓慢增长的县区由上一时期的基本稳定型转变而来。综合来看,中心城市的人才占比增速减缓,人才趋于分散,区域分布均衡性有所增强。
图3
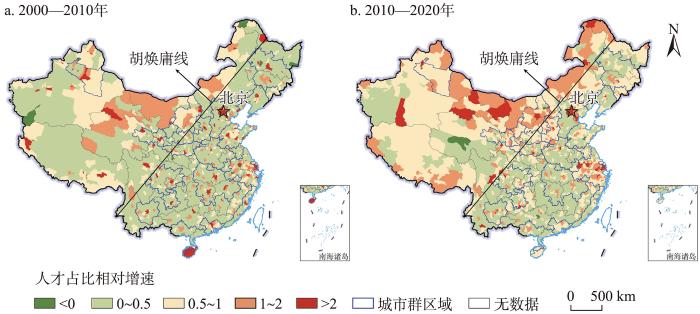
图3
2000—2010年和2010—2020年中国高学历人才占比变化的空间差异格局
注:该图基于自然资源部地图技术审查中心标准地图(审图号:GS(2020)4630号)绘制,底图边界无修改。
Fig. 3
Spatial variation of the share of highly educated talent in China, 2000-2010 and 2010-2020
在西北半壁区域,2000—2010年,中高速增长县区主要位于兰州、西宁、乌鲁木齐和拉萨等区域中心城市,以及资源型地区和边境重要口岸地区,人才增长基本稳定型县区主要位于新疆西部与南部、青藏高原地区和甘肃、宁夏两省,约占西北半壁县区总数的69%。2010—2020年,人才占比中高速增长县区数量大幅增加,沿边疆地区连片分布的特征进一步凸显,人才占比基本稳定型县区数量大幅减少,仅剩新疆西南部、青海南部和横断山区等少数地区。西北半壁人才占比增长速度较快,主要原因在于大部分地区的劳动力外流,导致人口规模增长缓慢甚至出现了负增长,而高等教育的普及和人才的流入使当地人才规模增速高于人口规模增速。例如:2010—2020年,西北半壁有173个(占41%)县区人才规模呈现正增长的同时,人口规模出现负增长;有157个(占37%)县区人才规模增速高于全国平均水平,且人口规模增速低于全国平均水平。
3.4 人才密度与人才占比的地区不均衡水平
采用泰尔指数测量2000—2020年中国高学历人才密度与人才占比的区域差异水平。2000年、2010年和2020年的高学历人才密度的泰尔指数分别为3.51、2.97和2.55,高学历人才占比的泰尔指数分别为0.98、0.58和0.33,两者的泰尔系数在20年间逐步下降,表明人才的空间分布日趋均衡。一方面,20年间中国高等教育的普及使得相对欠发达地区劳动力的素质大幅提升。另一方面,相对欠发达地区的低学历劳动力大规模向发达地区流动,导致2010—2020年人才增加且人口减少的县区数量大幅增加。
进一步将全国的县区划分为20个区域(包括19个城市群⑦(⑦ 依据国家“十四五规划”对城市群的定位进行分类:“优化提升”为I类,“发展壮大”为II类,“培育发展”为III类。同时,考虑到定位为“优化提升”的第一档城市群中,成渝城市群和长江中游城市群的发展水平和全国三大城市群的差距较大,故将这两个城市群归入II类。)和非城市群地区),对3个时期人才占比的泰尔指数进行分解。表1展示了3个时期的区域间总体差异、区域内县区间总体差异以及特定城市群区域内县区间的差异,以及其对总体差异的贡献。结果表明:①全国人才占比的区域间总体差异、区域内县区间总体差异以及城市群与非城市群区域内县区间总体差异均逐年递减,人才占比的不均衡程度有所降低。②城市群区域内县区间的差异对总差异的贡献率长期稳定在77%与80%之间,非城市群区域内县区间的差异的贡献率仅占12%~16%。③中国三大城市群中,珠三角城市群内县区间的差异的贡献率很小,仅占2%~3%,京津冀城市群和长三角城市群内县区间的差异贡献率在19个城市群中位列前两位,说明京津冀和长三角两大城市群内县区间的人才占比差异很大,而珠三角城市群内县区间的人才占比差异很小。④长江中游和成渝两大城市群内的县区间差异的贡献分别为9%~10%和6%~7%,仅次于京津冀和长三角两大城市群。⑤除了辽中南城市群和哈长城市群,所有III类城市群区域内县区间的差异贡献率均在2%以下,原因可能是该类城市群仍然处于培育阶段,其内部各县区的人才占比均处于较低的水平,空间差异很小。
表1 高学历人才占比区域差异的泰尔指数及其分解
Tab. 1
| 差异分解 | 2000年县区间 | 2010年县区间 | 2020年县区间 | ||||||
|---|---|---|---|---|---|---|---|---|---|
| 泰尔系数 | 贡献率(%) | 泰尔系数 | 贡献率(%) | 泰尔系数 | 贡献率(%) | ||||
| 城市群与非城市群间差异 | 0.136 | 14 | 0.097 | 17 | 0.058 | 17 | |||
| 城市群与非城市群内差异 | 0.847 | 86 | 0.487 | 83 | 0.275 | 83 | |||
| 非城市群区域内县区间差异 | 0.058 | 16 | 0.036 | 15 | 0.022 | 12 | |||
| 城市群区域内县区间差异 | 0.789 | 80 | 0.451 | 77 | 0.253 | 77 | |||
| Ⅰ类 | 珠三角城市群 | 0.020 | 2 | 0.014 | 2 | 0.009 | 3 | ||
| 长三角城市群 | 0.116 | 12 | 0.066 | 11 | 0.037 | 11 | |||
| 京津冀城市群 | 0.150 | 15 | 0.090 | 15 | 0.051 | 15 | |||
| 合计 | 0.286 | 29 | 0.170 | 29 | 0.097 | 29 | |||
| Ⅱ类 | 长江中游城市群 | 0.101 | 10 | 0.055 | 9 | 0.032 | 10 | ||
| 成渝城市群 | 0.068 | 7 | 0.035 | 6 | 0.020 | 6 | |||
| 山东半岛城市群 | 0.051 | 5 | 0.031 | 5 | 0.017 | 5 | |||
| 中原城市群 | 0.046 | 5 | 0.028 | 5 | 0.021 | 6 | |||
| 北部湾城市群 | 0.015 | 2 | 0.009 | 2 | 0.006 | 2 | |||
| 关中平原城市群 | 0.045 | 5 | 0.019 | 3 | 0.010 | 3 | |||
| 海峡西岸城市群 | 0.024 | 2 | 0.017 | 3 | 0.010 | 3 | |||
| 合计 | 0.349 | 36 | 0.194 | 33 | 0.117 | 35 | |||
| Ⅲ类 | 辽中南城市群 | 0.039 | 4 | 0.022 | 4 | 0.010 | 3 | ||
| 哈长城市群 | 0.049 | 5 | 0.029 | 5 | 0.011 | 3 | |||
| 天山北坡城市群 | 0.003 | 0 | 0.002 | 0 | 0.001 | 0 | |||
| 晋中城市群 | 0.015 | 2 | 0.008 | 1 | 0.004 | 1 | |||
| 滇中城市群 | 0.014 | 1 | 0.007 | 1 | 0.004 | 1 | |||
| 黔中城市群 | 0.011 | 1 | 0.007 | 1 | 0.004 | 1 | |||
| 兰西城市群 | 0.011 | 1 | 0.006 | 1 | 0.003 | 1 | |||
| 合计 | 0.153 | 16 | 0.087 | 15 | 0.039 | 12 | |||
4 人才密度与人才占比的影响因素
4.1 变量选取
构建2000年、2010年和2020年人才密度与人才占比影响因素的多元线性回归模型。模型自变量与因变量的基本统计信息如表2所示。本文选取人才密度与人才占比两个指标作为因变量,从人力资本存量和人口素质两个方面考虑,更全面地识别人才空间分布的影响因素。参照既有文献,从以下六个方面来选取自变量:①行政等级。已有研究表明,省会城市、直辖市和计划单列市比其余地级行政单元拥有更多的行政资源,能提供更优质的公共服务和更广阔的职业发展前景,从而具有更强的人口吸引力[17,18]。本文选取该地级行政单元是否为省会城市、直辖市或计划单列市(CITYLEVEL)作为虚拟变量。②经济机会。新古典主义迁移理论阐释了经济机会在人口迁移中起到的重要作用,中国的实证研究也表明不同区域间经济机会的差异是中国人才迁移的主要动因[16⇓-18,27,34]。本文选取职工平均工资(LNWAGE)和失业率(UNEMP)来衡量地区的经济机会。③人才培养规模。已有研究表明,一个地区的高等教育规模与该地区的人才规模有显著的正相关关系[20,35]。本文选取每万人在校高校学生数量(LNUNISTU)来衡量地区的人才培养规模。④科研投入强度。科技越发达的地区人才集聚度越高,本文选取人均科学事业费支出(LNSCIEXP)来衡量地区的科研投入强度[17,18]。⑤公共服务水平。西方国家的研究表明,地区的公共服务水平成为吸引人才越来越重要的因素[9⇓-11]。本文选取每万人医院床位数(LNBED)和中学生师比(STR)来衡量地区的医疗及教育水平。⑥生态环境质量。参照已有研究选取二氧化硫排放量(LNSO2)来衡量环境污染状况[20],选取绿地率(GREEN)来衡量地区绿化程度[17,18]。为提高模型的解释力,在探究人才密度的影响因素时,本文将人口密度(PD)作为控制变量加入模型中。表3展示了2000年、2010年和2020年的人才密度与人才占比影响因素模型的结果。
表2 变量的基本统计信息
Tab. 2
| 变量名 | 变量符号 | 2000年 | 2010年 | 2020年 | |||||
|---|---|---|---|---|---|---|---|---|---|
| 均值 | 标准差 | 均值 | 标准差 | 均值 | 标准差 | ||||
| 人才密度(人/km2) | TALENTD | 0.62 | 1.41 | 1.94 | 1.32 | 2.10 | 1.26 | ||
| 人才占比(%) | TALENTS | 1.10 | 1.27 | 3.30 | 2.80 | 6.69 | 4.05 | ||
| 省会、直辖市或计划单列市(1=是;0=否) | CITYLEVEL | 0.12 | 0.33 | 0.12 | 0.33 | 0.12 | 0.33 | ||
| 职工平均工资(元,对数) | LNWAGE | 9.36 | 0.31 | 10.33 | 0.23 | 11.24 | 0.19 | ||
| 失业率(%) | UNEMP | 1.83 | 1.75 | 1.81 | 1.17 | 2.23 | 1.33 | ||
| 每万人在校高校学生数量(人,对数) | LNUNISTU | 3.59 | 1.48 | 4.21 | 1.47 | 4.93 | 1.12 | ||
| 人均科学事业费支出(元,对数) | LNSCIEXP | 0.93 | 0.88 | 3.78 | 0.95 | 4.99 | 1.15 | ||
| 每万人医院床位数(张,对数) | LNBED | 3.25 | 0.38 | 3.55 | 0.27 | 3.99 | 0.22 | ||
| 中学生师比 | STR | 18.84 | 2.87 | 14.70 | 3.26 | 12.04 | 2.15 | ||
| 二氧化硫排放量(t/km2,对数) | LNSO2 | 0.92 | 1.50 | 1.20 | 1.34 | -0.80 | 1.13 | ||
| 绿地率(%) | GREEN | 29.58 | 10.03 | 38.28 | 7.84 | 41.99 | 4.06 | ||
| 人口密度(人/ km2) | PD | 5.53 | 0.99 | 5.60 | 1.01 | 5.61 | 1.07 | ||
表3 人才密度与人才占比影响因素的估计结果
Tab. 3
| 人才密度 | 人才占比 | ||||||
|---|---|---|---|---|---|---|---|
| 变量 | 2000年 | 2010年 | 2020年 | 2000年 | 2010年 | 2020年 | |
| CITYLEVEL | 0.77***(10.07) | 0.71***(9.88) | 0.53***(8.45) | 2.12***(9.17) | 4.48***(10.26) | 5.69***(9.69) | |
| LNWAGE | 0.23**(2.41) | 0.44***(4.30) | 0.73***(7.63) | 0.44***(3.72) | 1.85***(4.03) | 6.48***(5.95) | |
| UNEMP | 0.04***(2.82) | 0.06***(3.10) | 0.06***(4.74) | 0.08**(2.52) | 0.51***(4.31) | 0.57***(4.79) | |
| LNUNISTU | 0.12***(5.32) | 0.07***(3.69) | 0.09***(4.01) | 0.08***(3.39) | 0.11(1.53) | 0.40***(2.95) | |
| LNSCIEXP | -0.01(-0.24) | 0.16***(5.31) | 0.08***(5.08) | 0.10(0.98) | 0.39***(3.01) | 0.31***(3.17) | |
| LNBED | 0.84***(9.85) | 0.53***(5.75) | 0.12(1.42) | 0.69***(5.02) | 0.97***(2.96) | 0.79(1.55) | |
| STR | -0.02**(-2.29) | -0.02***(-3.40) | -0.06***(-8.30) | 0.01(0.57) | -0.04*(-1.95) | -0.41***(-8.22) | |
| LNSO2 | 0.07***(3.43) | 0.01(0.39) | 0.06***(4.03) | 0.04*(1.72) | -0.02(-0.30) | 0.02(0.17) | |
| GREEN | 0.01***(5.90) | 0.01*(1.95) | 0.01**(1.97) | 0.01***(3.18) | 0.01*(1.66) | 0.05**(2.17) | |
| PD | 1.00***(30.49) | 0.97***(34.11) | 0.92***(45.92) | — | — | — | |
| 常数 | -10.39***(-10.76) | -10.87***(-10.15) | -12.22***(-10.68) | -6.40***(-5.49) | -22.53***(-5.19) | -72.07***(-5.74) | |
| 观测数 | 290 | 290 | 290 | 290 | 290 | 290 | |
| 调整R2 | 0.951 | 0.959 | 0.968 | 0.797 | 0.829 | 0.828 | |
注:括号内为采用稳健标准误的t值;*p<0.1,**p<0.05,***p<0.01。
4.2 影响因素分析
4.2.1 行政等级一直是人才密度和占比的重要影响因素
4.2.2 高工资水平对人才的吸引作用越来越强,失业率对人才不存在挤出效应
职工平均工资在3个时期与人才密度和人才占比一直存在显著的正相关关系,且系数随着时间的推移均呈增长趋势,说明较高的工资水平能吸引更多的人才迁入,且这种吸引力随着时间推移不断增强。前人研究表明,由于产业结构调整、社会转型和新冠疫情冲击的叠加,地区间平均工资水平的差异对全国人口(以低学历劳动力为主)迁移格局的影响在2010—2020年有所减弱[37]。地区平均工资水平对高学历人才与低学历劳动力两类群体的影响呈相反的趋势,其原因可能有二:一是发达地区在近十年的产业结构升级导致不同学历劳动力薪资待遇迅速拉大,发达地区与欠发达地区之间面向高学历人才的岗位工资差别较大,面向低学历劳动力的岗位工资差别较小;二是随着高校扩招,发达地区的就业市场竞争愈发激烈,低学历劳动力受到高学历人才的就业挤压,削弱了低学历劳动力流向高工资水平地区的意愿。没有证据表明,降低失业率能够提高人才密度与人才占比,失业率对人才不存在挤出效应。这可能是因为人才既可从事学历要求较低的工作,也能胜任学历要求较高的工作,在本地劳动力市场具有较强的竞争力,因此对失业率的敏感度较低,而人才密度与占比高的地区往往由于劳动力的大量集聚,就业竞争激烈且失业率较高⑧(⑧ 2000年,北京、上海和广州的失业率分别是3.86%(位列全国所有城市的第29名)、7.24%(第6名)、6.30%(第11名);2010年,北京、上海和广州的失业率分别是6.07%(第3名)、6.14%(第2名)、4.49%(第13名);2020年,北京、上海和广州的失业率分别是6.05%(第9名)、3.88%(第27名)、4.53%(第16名)。)。
4.2.3 扩大人才培养规模一直推动人才的空间集聚,但对人才占比的作用先降后升
每万人在校高校学生数量与人才密度一直存在显著的正相关关系,与人才占比的正相关关系在2000年和2020年显著但在2010年不显著。一方面,高校为本地劳动力市场供应了大量的毕业生;另一方面,高校及相关产业为高学历人才提供了大量工作岗位。因此,扩大高校人才培养规模是提升人才密度与人才占比的重要手段。由于发达地区同时吸引人才与人口流入,人才培养规模对人才占比的影响有所波动。
4.2.4 科研投入强度对人才密度和占比的影响先升后降
人均科学事业费支出与人才密度和人才占比的正相关关系,在2010年后开始显著,但2020年的系数小于2010年。这反映了科研投入强度对人才的吸引作用先升后降。科研投入的增加,能提高人才待遇,为人才提供高质量的研究设备与充足的研究经费,从而能留住本地人才与吸引外来人才。
4.2.5 医疗和教育公共服务水平对人才密度和占比存在一定的影响
每万人医院床位数与人才密度和人才占比在2000年和2010年均存在显著的正相关关系,但在2020年变得不显著。可能的原因是,部分人口流失严重的地区(如鹤岗和雅安)人才吸引力较弱,但由于青壮年劳动人口的大量流失导致每万人床位数的上升。相反,部分人口增长快和人才密度高的地区(如深圳)存在人均医疗卫生资源相对不足的问题。中学生师比与人才密度一直存在显著的负相关关系,与人才占比的负相关关系在2010年后变得显著,说明人才越来越重视定居地的基础教育服务水平。
4.2.6 空气污染对人才的驱逐效应不显著,提升地区绿化水平一直推动人才的集聚
没有证据表明,二氧化硫排放量增加会降低人才密度和占比。相反,单位土地面积二氧化硫排放量与人才密度在2000年和2020年均存在显著的正相关关系,这可能是因为二氧化硫排放量反映了地区的城镇化水平、工业发达程度和汽车保有量,二氧化硫排放量大的地区往往是人才密度和人才占比高的地方。绿地率与人才密度、人才占比一直存在显著的正相关关系,表明良好的绿化水平对人才有一定的吸引力。
4.3 城市群与非城市群的对比分析
本研究进一步把全国290个地级行政单元分为城市群和非城市群两个组别,并分别估计人才密度、人才占比与模型自变量之间的关系(表4和表5)。相较于非城市群组别,城市群组别的地区行政等级对人才密度和人才占比的影响更大,这可能是因为城市群中的高行政等级城市集中了区域最优质的教育、医疗和文化公共资源,以及拥有更多的政策支持,对人才的吸引力很强。在经济机会方面,工资水平与城市群地区的人才密度和占比一直存在显著的正相关关系,与非城市群地区的人才密度和占比也存在显著的正相关关系,仅在2000年与非城市群地区的人才密度之间的关系不显著。工资水平对人才的吸引作用在城市群和非城市群地区均越来越强,而失业率在两类地区对人才均不存在挤出效应。在人才培养规模方面,每万人在校高校学生数与人才密度在城市群与非城市群地区均存在显著的正相关关系,而与人才占比的关系在两类地区变化不一致。科研投入强度对人才密度与人才占比的影响在城市群与非城市群地区均先升后降,可能是因为本研究仅用人均科学事业费支出测度科研投入强度水平,而创新氛围、平台建设和科研保障等也是人才考虑的因素。在公共服务水平方面,医疗服务水平(每万人医院床位数)对人才密度的影响在城市群与非城市群地区均逐渐下降,而对人才占比的影响在两类地区均先升后降;教育服务水平(中学生师比)对人才密度与人才占比的影响在城市群与非城市群地区均逐渐上升。在生态环境质量方面,空气污染(二氧化硫排放量)仅在2010年对非城市群地区的人才有驱逐效应,地区绿化水平(绿化率)对人才密度与人才占比的正向影响在两类地区均在2000年显著,在城市群地区绿化水平对人才占比的影响在2020年也显著。总的来说,在影响人才密度与占比的因素中,经济机会、科研投入强度和公共服务水平在城市群地区和非城市群地区有一致的影响,行政等级、人才培养规模和生态环境质量在两类地区有不一致的影响。
表4 城市群与非城市群地区人才密度影响因素的回归结果
Tab. 4
| 2000年 | 2010年 | 2020年 | ||||||
|---|---|---|---|---|---|---|---|---|
| 变量 | 城市群 | 非城市群 | 城市群 | 非城市群 | 城市群 | 非城市群 | ||
| CITYLEVEL | 0.74***(8.66) | 0.65***(4.06) | 0.73***(9.66) | -0.08(-0.50) | 0.50***(7.95) | 0.14(1.49) | ||
| LNWAGE | 0.27**(2.39) | 0.25(1.49) | 0.42***(3.35) | 0.58***(3.35) | 0.82***(7.02) | 0.42**(2.25) | ||
| UNEMP | 0.04**(2.34) | 0.05*(1.84) | 0.07**(2.43) | 0.04(1.19) | 0.07***(5.05) | 0.02(0.53) | ||
| LNUNISTU | 0.15***(4.52) | 0.08***(3.25) | 0.07***(2.84) | 0.10***(4.61) | 0.10***(3.63) | 0.07*(1.97) | ||
| LNSCIEXP | 0.01(0.22) | -0.03(-0.60) | 0.16***(4.31) | 0.12**(2.49) | 0.08***(4.54) | 0.08*(1.86) | ||
| LNBED | 0.71***(6.70) | 1.05***(9.08) | 0.45***(4.35) | 0.72***(3.96) | 0.07(0.66) | 0.27*(1.77) | ||
| STR | -0.02*(-1.92) | 0.01(0.09) | -0.03***(-2.93) | -0.02**(-2.03) | -0.06***(-7.50) | -0.05***(-3.28) | ||
| LNSO2 | 0.07***(2.74) | 0.04(1.66) | 0.02(0.87) | -0.05*(-1.71) | 0.06***(4.27) | 0.05*(1.74) | ||
| GREEN | 0.01***(4.63) | 0.01***(3.25) | 0.00(1.20) | 0.00(0.52) | 0.00(1.55) | 0.01(1.02) | ||
| PD | 0.96***(22.12) | 0.98***(19.71) | 0.93***(25.01) | 0.95***(21.11) | 0.90***(39.22) | 0.88***(23.64) | ||
| 常数 | -10.15***(-8.96) | -11.56***(-7.04) | -10.03***(-7.80) | -12.90***(-7.52) | -12.92***(-9.27) | -9.33***(-4.14) | ||
| 观测数 | 211 | 79 | 211 | 79 | 211 | 79 | ||
| 调整R2 | 0.939 | 0.913 | 0.947 | 0.946 | 0.964 | 0.938 | ||
注:括号内为采用稳健标准误的t值;*p<0.1,**p<0.05,***p<0.01。
表5 城市群与非城市群地区人才占比影响因素的回归结果
Tab. 5
| 2000年 | 2010年 | 2020年 | ||||||
|---|---|---|---|---|---|---|---|---|
| 变量 | 城市群 | 非城市群 | 城市群 | 非城市群 | 城市群 | 非城市群 | ||
| CITYLEVEL | 2.00***(8.62) | 0.61***(4.42) | 4.23***(8.98) | 1.08*(1.78) | 5.27***(8.24) | 2.17***(3.09) | ||
| LNWAGE | 0.42***(3.17) | 0.37**(2.23) | 1.78***(3.13) | 1.76***(3.33) | 7.47***(5.83) | 3.23***(2.90) | ||
| UNEMP | 0.06(1.49) | 0.05**(2.07) | 0.63***(3.81) | 0.16*(1.70) | 0.60***(4.37) | 0.19(1.03) | ||
| LNUNISTU | 0.12***(3.40) | 0.03(1.12) | 0.09(0.98) | 0.19**(2.63) | 0.46***(2.97) | 0.23(1.05) | ||
| LNSCIEXP | 0.17(1.23) | -0.04(-0.94) | 0.40**(2.39) | 0.26**(2.02) | 0.32***(2.70) | 0.22(0.86) | ||
| LNBED | 0.81***(4.45) | 0.52***(5.59) | 1.18***(3.04) | 1.37***(3.38) | 0.86(1.42) | 1.41(1.54) | ||
| STR | 0.00(0.15) | -0.00(-0.12) | -0.06*(-1.93) | -0.02(-0.96) | -0.45***(-7.65) | -0.35***(-4.01) | ||
| LNSO2 | -0.01(-0.19) | 0.02(1.31) | -0.08(-0.87) | -0.18**(-2.30) | -0.04(-0.20) | 0.06(0.36) | ||
| GREEN | 0.01**(2.22) | 0.01**(2.57) | 0.01(1.09) | 0.00(0.38) | 0.06**(2.26) | 0.00(0.07) | ||
| 常数 | -6.63***(-4.74) | -4.82***(-3.03) | -22.19***(-4.06) | -22.32***(-4.16) | -83.52***(-5.61) | -34.91**(-2.63) | ||
| 观测数 | 211 | 79 | 211 | 79 | 211 | 79 | ||
| 调整R2 | 0.804 | 0.680 | 0.836 | 0.739 | 0.859 | 0.431 | ||
注:括号内为采用稳健标准误的t值;*p<0.1,**p<0.05,***p<0.01。
5 结论与讨论
5.1 结论
本研究基于县级和地级尺度的第五、第六和第七次全国人口普查数据,揭示了中国高学历人才空间分布特征及其区域差异,运用泰尔指数及其分解方法分析高学历人才空间分布的不均衡水平,并采用多元线性回归模型识别影响人才密度与人才占比的主要因素。主要研究发现如下:
(1)2000—2020年中国的高学历人才空间分布呈现“东南密集,西北稀疏”的不均衡分布格局,且东南半壁的人才密度增长速度远高于西北半壁,其中又以城市群的中心城市人才密度增长速度最快。在胡焕庸线东南半壁,人才密度呈现典型的核心-边缘空间格局,由国家级城市群的核心区域向外围区域逐步降低。20年间全国人才密度增速放缓,绝大部分地区的人才密度从增长转变为基本稳定。
(2)人才占比呈现出鲜明的等级分异特征,高值区呈点状分散分布,大多位于城市群中心城市和部分资源型地区。20年间高人才占比地区和较高人才占比地区数量迅速增多。人才占比增速以胡焕庸线为界,呈现出不同特征。胡焕庸线东南半壁呈现以城市群中心城市主城区为人才占比增长高地、城市群外围地区和非城市群地区人才占比增长缓慢或停滞的特征,西北半壁呈现人才占比增长高地沿边疆地区连片分布的特征。20年间全国人才占比平均增速提升,长三角、京津冀和中原等少数几个城市群地区和胡焕庸线西北半壁区域的人才占比增速普遍提升,东南半壁其余城市群地区的人才占比增速有所减缓。
(3)2000—2020年人才密度与人才占比的地区差异逐步减少,人口素质日趋均衡。城市群内县区间的人才占比差异对总差异的贡献度最大。就19个城市群而言,京津冀、长三角、长江中游和成渝城市群内的县区间差异对总差异的贡献度较大,除了辽中南和哈长城市群,培育发展中的城市群内的县区间差异的贡献度较小。
(4)回归模型结果表明,行政等级一直是人才密度和占比的重要影响因素。高工资水平对人才的吸引作用越来越强,失业率对人才不存在挤出效应。扩大人才培养规模一直推动人才的空间集聚,但对人才占比的作用先降后升。科研投入强度对人才密度和占比的影响先升后降。医疗和教育公共服务水平对人才密度和占比存在一定的影响。空气污染对人才的驱逐效应不显著,提升地区绿化水平一直推动人才的集聚。
(5)在影响人才密度与占比的因素中,经济机会、科研投入强度和公共服务水平在城市群地区和非城市群地区有一致的影响,行政等级、人才培养规模和生态环境质量在两类地区有不一致的影响。
5.2 讨论
人才是衡量一个国家综合国力的重要指标。推动人口红利向人才红利转变,能够有效缓解人口老龄化、出生率下降和劳动力短缺对社会经济发展带来的冲击。在中国进入全面建设社会主义现代化国家,向第二个百年奋斗目标进军的新时代背景下,深入分析人才的空间格局及其影响因素,将有助于政府制定更科学更合理的人才政策,为社会经济的高质量发展提供支撑。中国的城市群地区(尤其是国家级城市群的核心区)由于其城市行政等级、经济机会和公共服务水平等优于非城市群地区,吸引了大量的人才集聚,一方面能促进城市群地区的创新水平与区域活力,另一方面也导致非城市群地区的人才缺失。人才空间分布不均衡的格局在未来一段时期内将仍然存在,国家和各级政府应当制定合理的人才政策来优化人才空间分布格局。针对人才集聚的区域,应当完善人才评价机制与人才激励机制,更大程度地发挥人才效能,促进人才创新。针对人才稀疏的区域,应当加强本地人才培养机制,扩大本地高等教育规模与增大科研投入,推行人才薪资激励、税收减免与住房保障等福利政策,留住本地人才与吸引人才回流。
经济机会与行政等级是当前影响中国高学历人才空间分布的主要因素,各地政府应当制定薪资激励政策来吸引人才。同时,也不能忽略各地的人才培养与科研投入,扩大高等教育规模并提升其质量,通过政企联动的方式加大对高校与科研机构的科研投入,使各地拥有充足的人才储备。完善的公共服务与良好的环境质量也是吸引人才的因素,尤其随着时间的推移,人才对这方面的因素将会越来越关注,各地政府应当制定合理的人才落户、医疗保障与住房保障等各方面政策,增加公共绿地与减少污染排放,努力建设宜居宜业的人才友好型城市。
本研究仍有以下几点不足之处:①由于无法获取本科及以上人口更详细的教育结构数据,本研究对高学历人才的界定仍为拥有本科及以上学历的人,这一标准可能随着中国高等教育的发展与普及略显不足,未来的研究可以考虑将高学历人才的标准定为研究生及以上学历的人。②由于数据受限,本研究在探究影响高学历人才密度与占比的因素时可能存在遗漏变量,例如产业结构、事业平台等方面的因素没有被考虑,未来的研究可以进一步考虑其他因素的影响作用。③本研究对人才群体的研究只考虑了以学历标准定义的人才,未来的研究可以考虑更多的标准(如职业、产业等)来定义人才,并分析不同类型人才的空间分布特征及其影响因素。④本研究基于三期的人口普查横截面数据研究中国高学历人才空间分布格局及其影响因素。未来的研究可结合2005年和2015年的1%人口抽样调查数据开展研究,从而更精细地展示2000—2020年中国高学历人才分布格局的变化趋势,并运用面板数据分析方法,更准确地估计各种影响因素与人才密度或人才占比之间的关系。
致谢
真诚感谢二位匿名评审专家在论文评审中所付出的时间和精力,评审专家对本文分析尺度的确定、影响因子变量的选择、研究方法的完善、研究结论的梳理等方面提出了客观、有建设性的修改意见,使本文获益匪浅。
参考文献
Do colleges and universities increase their region's human capital?
What attracts human capital? Understanding the skill composition of interregional job matches in Germany
Migration and social mobility: South East England as an escalator region
"This paper uses data from the OPCS [Office of Population Censuses and Surveys] Longitudinal Study and the National Health Service Central Register to examine the contention that the South East region of England acts as a kind of 'upward social class escalator' within the British urban and regional system. To establish that this is so it is shown firstly, that the South East attracts to itself through inter-regional migration a more than proportional share of the potentially upwardly mobile young adults; secondly, that it promotes these young people along with its own young adults at rates which are higher than elsewhere in the country; and finally, that a significant proportion of those who achieve these higher levels of status and pay then 'step off' the escalator. They do this by migrating away from the South East at later stages of their working lives and at or near to retirement." (SUMMARY IN FRE AND GER)excerpt
A model of labor migration and urban unemployment in less developed countries
On the role of amenities in models of migration and regional development
"The role of location-specific amenities in human migration decisions, and subsequently regional development, is explored. A framework is developed which motivates a new assessment of existing alternative models of regional development, indicating the need for additional modeling efforts which focus upon amenities as critical elements in such analyses. The approach hinges upon the notion that amenity values are capitalized into wages, rents, or other local prices. This process of capitalization enables researchers to explore the implicit value that society places upon amenities, which can then be used in assessing future regional-development trends in a more comprehensive manner."excerpt
Examining the role of economic opportunity and amenities in explaining population redistribution
A reexamination of migration, economic opportunity, and the quality of life
DOI:10.1111/jors.1976.16.issue-1 URL [本文引用: 1]
Migration and climate
Urban resurgence and the consumer city
Cities make it easier for humans to interact, and one of the main advantages of dense, urban areas is that they facilitate social interactions. This paper provides evidence for the US suggesting that the resurgence of big cities in the 1990s is due, in part, to the increased demand for these interactions and due to the reduction in big city crime, which had made it difficult for urban residents to enjoy these social amenities. However, while density is correlated with consumer amenities, we show that it is not correlated with social capital and that there is no evidence that sprawl has hurt civic engagement.
Consumer city
Amenities drive urban growth
Bohemia and economic geography
基于人才流动的城市网络关系构建
DOI:10.11821/dlyj201701013
[本文引用: 1]

以高端归国人才为对象,通过构建“归国人才三角”概念框架,设计基于高端移动性人才的城市关系构建方法,对人才迁移驱动的城市网络构建进行了初步探讨。研究认为:① 借助“行动者空间移动带来的空间动力”这一视角,运用高端归国人才在城市间的移动模拟城市间关系,可为构建城市网络提供一条新路径。② 基于人才流动的城市网络构建,有助于破解城市关系矩阵数据挖掘与案例城市选取的难题,是知识经济时代城市网络研究的新方向。③ “归国人才三角”概念框架将人才流动与城市网络两方面研究融为一体,既可以通过人才流动探讨城市创新空间组织特征,也可以通过城市网络方法分析人才流动网络,对城市网络研究和人才战略实施都具有一定参考价值。
Triangle model of Chinese returnees: A tentative method for city networks based on talent flows
As one of the important contents of urban geography, regional urban spatial organization is turning from the traditional city system research to the city networks research. There are two methods to construct city networks. One is using the relational data including the goods flow, capital flow, information flow, population flow among the city to construct city networks; the other one is building models to simulate the relationship between the city, such as interlocking network model and the gravity model. Inspired by the view of the "a spatial dynamic that changes whenever actors move in space" proposed by Menzel, this paper attempts to construct the city networks by using returnees' movement between cities. First, this paper discusses the theoretical relationship between talent mobility and city network. Relational economic geography uses the idea of "based on construction of individual relationship " into network analysis, evolutionary economic geography puts forward the thought of "dynamic proximity", and the research of early uses mobility of talents of high technology to measure the relationship between cities. These had laid a theoretical foundation for the construction of the city network based on the flow of talents movement. Then, we establish the conceptual framework of "triangle model of Chinese returnees". The returnees have the fellow villager's relationship resources in their native places, the classmates' relationship resources in overseas cities and the coworkers' relationship resources in the work city, and these are used in the analysis framework. By integrating the migration data of the returnees, we establish the cities' connections based on the flow of talent, and design a method to calculate the city connectivity. Finally, we select 6 high-end returnees of an innovative team in China to carry out a case analysis. Through the mining of the returnees' city resumes, we successfully construct the city network composed of six talents. As a result, it is suggested that: (1) city innovation network should be examined at national scale under global perspective, and the returnees are good carriers in such researches; (2) the "triangular model" reflects Chinese characteristics, which can explain the formation mechanism of city innovation network better; (3) the returnees team in Beta Pharma Co., Ltd is a typical case that it successfully facilitates inter-city innovation cooperation; and the "triangular model" framework provides a brand-new perspective and analytical method to further research on city innovation network. It should be noted that this paper focuses on theory construction and method exploration, and it needs to use a great quantity returnees' data to carry out systematic research on urban network in the next step, in order to make a greater contribution to urban network theory and the strategy of talents creative practice.
创新人才集聚的理论探索: 全球人才流动的城市选择视角
DOI:10.13249/j.cnki.sgs.2021.10.012
[本文引用: 1]
人文?经济地理学非常重视地理事物的区位规律研究,经典区位论已从产业区位转向城市区位,直至人类社会进步核心动力的创新活动区位。人是创新的主体,创新人才区位研究是地理学、区域科学与经济学研究热点与难点之一。为此,系统梳理创新人才的多尺度区位选择及其空间集聚文献,辨析创新人才流动、区位选择与城市(群)可持续发展的关联逻辑,构建城市群创新人才区位选择与空间集聚分析框架,尝试解析创新人才区位选择及其空间集聚机理,进而提出分工深化与人才异质性背景下城市群创新人才集聚的研究展望。
Theoretical exploration of innovative talent agglomeration: From the perspective of city selection of global talent flow
The human-economic geography attaches great importance to the study of the location law of geographical things, and the classical location theory has shifted from industrial location to urban location, and finally to the location of innovation activities. However, People are the main body of innovation, and the research on the location of innovative talents is one of the hotspots and difficulties in the field of geography, regional science and economics, the efficiency of the flow of innovative talents and the degree of their spatial agglomeration have become important indicators to measure the global competitiveness of a country or region. To this end, this study systematically sorts out the multi-scale location selection of innovative talents and their spatial agglomeration literature in urban agglomeration, summarizes the classification of innovative talents and the theoretical targets of their heterogeneous location selection, explores the flow of global talents and full picture of urban agglomeration, and analyses the logic related to the flow of innovative talents, location selection and sustainable development of urban agglomerations, and builds an exploratory framework for the location selection and spatial agglomeration analysis of innovative talents in urban agglomerations. It reveals the influence mechanism of the location selection of innovative talents and their spatial agglomeration, and then puts forward the research prospect of innovative talents aggregation in urban agglomeration under the background of deepening division of labor and heterogeneity of talents and attempts to provide reference for China's talents policy practice.
中国高学历人才的空间演化特征及驱动因素
DOI:10.11821/dlxb202102006
[本文引用: 5]
人才是推动地区创新发展的核心动力,也是未来城市竞争的关键。基于第六次全国人口普查和2015年全国1%人口抽样调查数据,运用集聚度、基尼系数等空间统计分析以及负二项回归模型方法,对2010—2015年中国城市高学历人才的空间演化特征及驱动因素展开研究。结果发现:① 人才呈现出高度集中且不平衡的空间分布格局,但不平衡的趋势有所缓解,分布方向为“东北—西南”走向。人才分布的空间溢出效应显著,城市群是人才集聚的高地。② 经济机会是影响中国高学历人才集聚的主导力量,其中工资是核心驱动因素,地区的发展水平、产业结构同样产生显著影响。③ 控制经济机会的影响后,以教育和医疗等基础公共服务、交通可达性和城市消费设施为核心的地方品质变量在高学历人才的空间集聚过程中发挥重要作用。④ 城市群与非城市群人才驱动因素存在显著差异:经济机会是城市群和非城市群人才集聚的主要驱动力;教育、消费、交通以及自然环境等地方品质变量对城市群人才集聚的影响更为显著。本研究为城市和区域人才政策和区域发展政策的制定提供借鉴与参考。
Spatial evolution characteristics and driving forces of Chinese highly educated talents
Talents are the core driving force for regional innovation and development, and they are also the key to urban competition in the future. Based on the data of the sixth population census and the national 1% population sampling survey in 2015, this paper uses the concentration index (CI), Gini index (GI) and several related spatial analysis methods to examine the spatial patterns of highly educated talents across China and the drivers behind these patterns from 2010 to 2015. The results are as follows: (1) Talents show highly concentrated and unbalanced spatial distribution patterns at the city level over the five years, but the trend of concentration and imbalance has gradually eased. Results from standard deviation ellipse (SDE) indicate that the distribution direction of highly educated people is "NE-SW". Furthermore, there is a significant spatial spillover effect in the distribution of talents, with three major urban agglomerations of China as the highlands. (2) Economic opportunities are the dominant drivers for the distribution of highly educated talents in China. Among them, wages are the core driver, and gross GDP and industrial structure of each city also exert a significant impact. (3) After controlling the impacts of economic opportunities, local quality variables represented by basic public services (e.g., education and medical care), transportation accessibility and urban consumption facilities play an important role in the distribution of highly educated talents. (4) There are significant differences between the driving factors for talents in urban agglomerations and non-urban agglomerations: economic opportunities are the main driving force for the distribution of talents in both urban agglomerations and non-urban agglomerations, while local qualities including education, consumption, transportation and natural environment have a more significant impact on the distribution of talents in urban agglomerations. This study provides references for the formulation of urban and regional talent policies and regional development policies.
中国高技能劳动力与一般劳动力的空间分布格局及其影响因素
DOI:10.11821/dlyj020180391
[本文引用: 11]
基于2000和2010年全国人口普查分县数据和地级行政单元数据,采用不均衡指数和空间自相关分析等方法,刻画中国高技能劳动力和一般劳动力的空间分布格局及其变化,并采用空间滞后模型,识别高技能劳动力与一般劳动力空间分布的决定因素及其变化。结果表明:① 两类劳动力总体的空间特征均为东南密集,西北稀疏;② 2000—2010年,高技能劳动力在空间分布上呈集中化的趋势,而一般劳动力呈分散化的趋势;③ 十年间高技能劳动力集聚区虹吸作用加强,其分布越发集中于沿海特大城市群,而一般劳动力集聚区回波作用加强,其分布越发均衡;④ 空间回归分析结果表明,职工平均工资、是否直辖市或省会、每万人在校高校学生、是否沿海城市、常住人口数和空间溢出效应在十年中一直都是决定高技能劳动力和一般劳动力空间分布的主要因素,而失业率、中学生师比、二氧化硫排放量和绿地率在2010年也成为影响两类劳动力空间分布的主要因素。对比两类劳动力的模型结果可得,高技能劳动力的空间分布受行政因素、高校因素和地区生活舒适度的影响更大,而一般劳动力的空间分布受劳动力市场因素的影响更大。
The spatial pattern and determinants of skilled laborers and less-skilled laborers in China: Evidence from 2000 and 2010 censuses
Based on 2000 and 2010 county-level and city-level National Demographic Census data, we applied inequality index and spatial auto-correlation analysis to specify the spatial patterns of China's high-skilled and general labor force and its variation during the decade. We also use the SLM model to further analyze the main factors that contribute to the spatial patterns and the changes of them. The results are as follows: (1) The density of high-skilled labors and general laborers was high in southeastern China and low in northwestern regions. (2) From 2000 to 2010, the high-skilled labors had been accumulating spatially while the normal labors had been dispersing. (3) The siphon effects of the high-skilled-labor clusters, which were more inclined to accumulate in coastal metropolitan area compared with 10 years ago, also enhanced during the decade. On the contrary, the echo effect of general labor clusters strengthened and attained the uniform distribution. (4) Results of spatial regression analysis showed that the level of wages, urban administrative level, the number of ten thousand college students, the coastal cities, population and spatial spillover effects in the ten years were the main factors determining the spatial distribution of high-skilled and general labor force, while the unemployment rate, high school teacher ratio, concentration of sulfur dioxide and afforestation in 2010 became the main factors influencing the two types of labor distribution. Comparing the two types of labor model, we found that the spatial distribution of the high-skilled labors was more influenced by government forces, while the spatial distribution of general laborers was influenced by market forces.
2000-2015年中国高学历人才分布格局及其影响机制
DOI:10.13249/j.cnki.sgs.2020.11.007
[本文引用: 10]
基于2000年、2010年中国人口普查分地级及以上行政区数据和2015年中国各省份1%人口抽样调查数据,采用变异系数、泰尔系数、基尼系数测度中国高学历人才比重分布的空间不均衡程度,并采用面板数据Tobit随机效应模型,识别影响高学历人才比重空间分布的主要因素。结果表明:① 中国的人才比重分布表现出极大的不均衡性,人才比重的高低与城市等级密切相关,主要表现在直辖市、省会城市、计划单列市等行政区吸引了大量人才,而普通地级城市人才比重相对较低;② 10 a间人才比重的变异系数、基尼指数和泰尔指数均有所下降,表明人才比重分布的空间不均衡程度有所下降;③ 平均工资水平、生活成本、城市等级、每万人高校在校学生数、每万人医院卫生院床位数、人均科学事业、教育事业经费与人才比重呈正相关,中学生师比、万人互联网用户数与人才比重呈负相关,失业率、单位面积二氧化硫排放量、绿地率对人才比重没有影响。
Spatial pattern and determinants of highly educated talents in China, 2000-2015
Based on the data from the 2000 and 2010 China censuses by prefecture level and above, and the 2015 1% population sample survey data of Chinese provinces, this article studies the spatial pattern evolution of the distribution of highly educated talents and its influence mechanism in China. The coefficient of variation, Theil coefficient and Gini coefficient are used to measure the spatial imbalance of the highly educated talents proportion. The panel data Tobit model is used to identify the main factors affecting the spatial distribution of the proportion of the highly educated talents. The results show that: 1) The distribution of the highly educated talents proportion in China shows a great imbalance, closely related to the city level, which is highlighted in administrative regions such as municipality, provincial capitals, and city specifically designated in the state plan, to which a large number of talents are attracted, while the talents proportion in ordinary prefecture-level cities is relatively low; 2) In the past 15 years, the coefficient of variation, Gini coefficient and Theil coefficient of the talents proportion have all declined, indicating that the spatial imbalance of the talents proportion has decreased; 3) Average wage level, cost of living, city hierarchy, students enrollment of regular institutions of higher education per 10 000 people, the number of hospital beds per 10 000 people, expenditure for education per capita, expenditure for science and technology per capita are positively correlated with talents proportion; The ratio of middle school students to teachers and the number of internet users per 10 000 people are negatively correlated with talents proportion; Unemployment rate, green rate, sulfur dioxide emissions per unit area have no significant impact on the talents proportion.
中国顶尖学术型人才空间分布特征及其流动趋势: 以中国科学院院士为例
DOI:10.11821/dlyj020180304
[本文引用: 1]
院士作为国家高端的科研领军人才,在创新发展、人才培养,科研引领,国家重大战略和核心技术突破方面挥着重要作用。以中国科学院755名院士为例,运用核密度分析与流动指数等空间分析方法,系统分析了中国顶尖学术型人才的空间分布特征及求学、就业与工作地变更三种空间流动规律。结果表明:① 院士出生地或籍贯集聚分布在经济条件良好、文化底蕴深厚的东部沿海地区;学历取得地主要集中在北京、上海与江苏等985、211高校聚集省区;初次工作地点在不同时代表现各异;最终工作地呈现向北京、上海等特大城市聚集的特征。② 求学(出生地—大学)流动由东部多个省份向北京、上海等国家中心城市近距离流动。毕业首次就业流动空间聚集程度小,且流向随院士所处时代的不同而变化。③ 46.23%的院士有工作地变更流动趋势。变更一次的院士其流动呈现“孔雀东南飞”的特点,具有明显的向东指向性和空间聚集性;变更两次及两次以上的院士,除最后一次流动外无明显空间指向性。④ 流动指数分析表明,北京与上海作为经济发达区既是强流入中心也是强流出中心,双向流动量大;而西藏、海南、澳门、内蒙古及广西等省份流动指数为0,属于附属型省份。
The spatial distribution and flow trends of Chinese top academic talents: Based on the case study of academicians of Chinese Academy of Sciences
Academicians, as national high-end research leaders, play an important role in innovative development, talent training, scientific research guidance, national major strategies and core technology breakthroughs. Based on the survey of 755 academicians of the Chinese Academy of Sciences (CAS), the spatial analysis methods such as nuclear density analysis and mobility index are used in this paper to systematically analyze the characteristics of spatial distribution and three flow patterns of study, employment and changing workplaces of China's top academic talents. The results indicate that: (1) The birthplaces or native places of the academicians are mainly located in the eastern coastal regions with good economic conditions and profound cultural heritages; The academic qualifications of the academicians are mainly obtained in regions such as Beijing, Shanghai and Jiangsu Province, where top universities (also known as 985 and 211 universities) are located. The first workplaces of the academicians present different manifestations in different periods. The final workplaces are mainly distributed in megacities such as Beijing and Shanghai. (2) The flow of education (birthplace-university) moves from some provinces in the east to the regional center cities, such as Beijing and Shanghai. After graduation, the employment flow shows the characteristics of a large number of destinations which vary with different periods of different academicians, and the degree of spatial aggregation is small. (3) Some 46.23% of the academicians have a tendency of changing their workplaces. The flow of academicians who changed their workplaces one time presented the agglomeration characteristics of “peacocks fly to southeast”, which comes from a long narrative poem with the same name in ancient China, this article uses it to describe the phenomenon that many China's top academic talents moves to the southeast coastal zones, with obvious spatial orientation; the academicians who changed their workplaces two or more times have no apparent spatial aggregation feature except for the last flow by the cause of changing workplace. (4) The analysis of flow index shows that Beijing and Shanghai, as rapidly developed economic zones, are both strong inflow and strong outflow centers with large two-way flow; while Tibet, Hainan, Macao, Inner Mongolia, and Guangxi provincial-level regions have a zero mobility index, and they are subordinate provinces.
2005-2015年中国高校科研人才的时空变化及影响因素分析
DOI:10.13249/j.cnki.sgs.2019.08.001
[本文引用: 4]
基于2005~2015年全国统计年鉴数据,采用统计地图法和空间自相关分析,分析中国高校科研人才的时空分布特征(不包括港澳台数据),并采用面板负二项回归模型,识别高校科研人才空间分布的决定因素。研究结果表明:①中国的高校科研人才分布表现出较强的空间不均衡性,总体趋势为东南密集,西北稀疏,科研人才高度集中在北京、天津、上海;②高校科研人才分布具有一定的空间集聚特征,其热点地区为北京、天津、上海和江苏等沿海省市,冷点地区集中分布在广大的西部地区和黑龙江省。2005~2015年,高级职称人才的空间集聚程度有所减弱,而中初级职称科研人才的空间集聚程度有所加强;③人才政策、高等教育规模和层次、公共服务水平和信息化水平是所有高校科研人才空间分布的主要影响因素。从职称差异的角度来看,薪酬和失业率等经济因素仅对初级职称科研人才的分布有影响,医疗、文化公共服务水平和人才政策仅对中高级职称科研人才的分布有影响,高等教育的规模与层次对各种职称人才的分布均有影响;从地区差异的角度来看,西部地区高校科研人才受到经济因素影响更为明显,而中东部高校科研人才受到公共服务水平影响的更为明显。
Spatio-temporal change of facaulty members of higher education institute and its influential factors in China in 2005-2015
Based on the national statistical yearbook data from 2005 to 2015, this article studies the spatial pattern evolvement of the distribution of scientific research talents in China (limited to data, the study area not includes Hong Kong, Macao and Taiwan) and its influence mechanism by applying panel negative binomial regression and spatial auto-correlation analysis. The result shows that: 1)The distribution of scientific research talents in China showed great imbalance. Generally speaking, talents agglomerate in the southeast but sparse in the northwest. Scientific research talents are mainly agglomerate in Beijing, Tianjin and Shanghai; 2) The distribution of scientific research talents has some spatial agglomeration characteristics. Hot spots are the eastern coastal areas, especially Beijing, Tianjin, Shanghai and Jiangsu while the cold point area is concentrated in the western region and Heilongjiang Province. The area of cold points has decreased from 2005 to 2015; 3) Talent policy, the development of universities and the level of public service are the main factors that determines the overall spatial distribution of scientific research talents, but no evidence support that other factors have significant influence. With the increase of professional qualification, the influence of the economic factors on the scientific research talent gets weaker, but the influence of public service level gets stronger. On the other hand, from the perspective of regional differences, compared with the western regions, the scientific research talents working in middle and eastern universities are more likely to be affected by the public service.
科研人才集聚对中国区域创新产出的影响
The relationship between geographical concentration of researchers and regional innovation in China
High-level talent flow and its influence on regional unbalanced development in China
人力资本的空间迁移模式与影响因素分析: 以南京市高校毕业生为例
DOI:10.13249/j.cnki.sgs.2021.06.005
[本文引用: 1]
知识经济时代人才是决定区域经济竞争力的重要资源,各地政府发起的人才争夺战日益白热化,中央政府也一再强调应当引导合理、公正、畅通、有序的人才社会性流动。基于南京市高校《毕业生就业质量报告》和一手问卷调查数据,进行毕业生择校迁移与择业迁移模式并采用多项逻辑斯蒂回归模型探究其影响因素研究。研究表明:① 南京市高校毕业生中近84%来自东部和中部地区,而择业迁移进一步向东集聚。② 毕业生整体迁移路径呈“东西非对称U型”格局,长三角城市群构成毕业生流动的核心区域;就业地经济发展水平明显高于生源地且往往与生源地邻近。③ 个体的教育背景、家庭和社会网络和对就业机会的评估都会显著影响毕业生的流动类型选择。
Migration pattern of human capital and its influential factors: A case study of university graduates in Nanjing city
In the era of knowledge economy, talent are acknowledged as a key driver for innovation, and thereby determine the vitality and competitiveness of regional economy. The competition of attracting talent initiated by some second-tier cities is increasingly heating up. The central government has repeatedly stressed the importance of reasonable, fair, smooth and orderly mobility of talent to facilitate economic transformation. Against this background, based on the “Graduate Employment Quality Report” and first-hand questionnaire survey data of university graduates from Nanjing, this study adopted chord diagram and map visualization to depict the previous and subsequent migration patterns of university graduates. Furthermore, multinominal logistic regressions were employed to explore the factors underlying graduates’ migration choice. The results show that the the number of people flowing into Nanjing for higher education decreases with the increase in distance. Nearly 84% of the graduates originally come from the eastern and central regions. After graduation, their subsequent migration shows further concentration to the east. Using a measurement of regional circulation, the overall migration path of graduates presents an “east-west asymmetric U-shaped” pattern, with the Yangtze River Delta region constituting the core area for graduates to flow to. The economic development level of the destination of graduates’ subsequent migration is obviously higher than that of their domicile, and the destination is often in close proximity to their domicile. At the individual level, the rank of the university, discipline, social netweok, and graduates’ evaluation on job opportunities all have significant influence on graduates’ migration decisions.
“人才争夺战”背景下人才流动的空间特征及影响因素: 以中国“一流大学”毕业生为例
DOI:10.11821/dlyj020200437
[本文引用: 2]
自2017年以来,“人才争夺战”如火如荼,城市步入以人才为核心要素的高维竞争阶段。作为人才争夺战的主要目标和人力资本的重要承载者,本文聚焦中国“一流大学”毕业生,基于2018年《毕业生就业质量报告》,运用Cartogram地图呈现了毕业生的空间流动特征,并梳理政府人才政策文件构建了人才政策评价指标体系,运用有向迁移模型剖析毕业生流动的影响因素。结果表明:① 就学地存在粘滞性,但区域差异显著,毕业生向一线城市集聚。② 城市吸引力水平分异明显,部分城市通过发布人才政策以补充地方经济、舒适性吸引力的不足。③ 经济维度要素与城市舒适性均能有效吸引毕业生流入,较高房价收入比会引发“挤出效应”。人才政策中,落户政策对毕业生流入起激励作用。
Migration of human capital in the context of vying for talent competition: A case study of China's "first-class" university graduates
Human capital is the key driver of urban innovation and development. In 2017, the "vying for talent" competition was initiated by some second-tier cities, since then cities have been competing each other fiercely for recruiting and retaining talent. This paper focuses on China′s "first-class" university graduates, who are regarded as the main target of the "vying for talent" competition and an important carrier of human capital. Based on 2018 Graduate Employment Reports, this paper demonstrates the spatial mobility of graduates using Cartogram. In addition, an evaluation system for assessing talent policy is constructed through analyses of the talent policies issued by different cities. With a directional migration model, the determinants of graduate mobility are explored. The results reveal that there are significant regional disparities in retention rates, with the geographical patterns of the Y-shaped low-value areas in the northeastern, northwestern, and central regions, and the U-shaped high-value areas covering east coast to southwest. Graduates have been accumulating spatially, and the T-shaped cluster along east coast and the Yangtze River Economic Belt has formed. The spatial patterns of "neighborhood interaction" and "long-distance unidirectional flow" are presented between the city of university and the city of employment. Moreover, the differences in city attractiveness are remarkable. First-tier cities are preferred by graduates, even though limited talent policies have been implemented there. Some second-tier cities have issued talent policies to make up for the lack of attractiveness in economy and amenities. The findings suggest that economic factors, such as income level and technological innovation, as well as amenities including natural and cultural environment, educational resources, and public transportation are positively associated with the volume of graduates inflow. It has been found that a higher ratio of house price to income has squeezed out university graduates. With regard to talent policies, only relaxed hukou policy has a strong effect on attracting graduates, whereas the effects of housing and employment policies are relatively limited. However, it needs to be noted that talent policies may take a longer time to show effects, which requires follow-up investigation. In addition, heterogeneity at the individual level in terms of place of origin, major, etc. should be explored in the future studies.
高学历人才逆向梯次迁移现象及机制研究: 以北上广深应聘至武汉的中小学教师为例
DOI:10.11821/dlyj020220344
[本文引用: 1]
本文聚焦于高学历人才“逆向梯次迁移”现象,基于武汉市中小学教师招聘考试数据,运用二元Logistic回归模型分析正规就业驱动下北上广深至武汉的高学历人才逆向梯次迁移,结合粘性理论解释其机制。结果表明: ① 正规就业导向下,高学历人才逆向梯次迁移已成为人才迁移的重要趋势之一,以武汉为目的地的跨省城际迁移中近1/4呈现逆向梯次迁移意愿,非应届生占比高于应届生。② “逆向梯次迁移”受粘性因素、个人因素和城市因素影响。粘性因素即“户籍地粘性”与“就学地粘性”起到关键作用;包括“年龄”“毕业学校级别”“学历级别”和“户籍地所在城市级别”在内的个人因素和城市因素也存在影响。③ 与西方受宗教、种族、家庭和个人价值等因素影响不同,基于乡缘、学缘关系产生的户籍地、就学地粘性更深刻作用于中国的高学历人才择业迁移选择,引发逆向梯次迁移现象。
Research on trend and mechanism of highly educated population migrating down to urban hierarchy: Taking the candidates from Beijing, Shanghai, Guangzhou, and Shenzhen for the primary and middle school teachers in Wuhan as an example
This study focuses on the trend and mechanism of highly educated population migrating down to urban hierarchy. Based on the recruitment data of Wuhan's primary and middle school teachers, we analyse the downward migration trend of candidates from first-tier cities (Beijing, Shanghai, Guangzhou, and Shenzhen) to the second-tier city (Wuhan), and explain its mechanism by drawing on the theory of stickiness. The results of binary logistic regression indicate that moving down the urban hierarchy has become one of the significant migration trends of the highly educated population driven by formal employment. In our case, nearly a quarter of inter-provincial migration samples show a willingness to move down the urban hierarchy, characterized by a higher proportion of non-fresh graduates than fresh graduates. For first-tier cities, Beijing has the highest proportion of highly educated population migrating down the urban hierarchy, followed by Shenzhen, Shanghai, and Guangzhou. Meanwhile, Beijing has the highest proportion of fresh graduates while Shenzhen has the highest proportion of non-fresh graduates in this downward migration. This downward trend is deeply influenced by the stickiness of place, the individual factors and the urban factors. The highly educated population is back to Wuhan (the capital city of Hubei) from first-tier cities. Additional factors including age, education background, and the city level of hukou place also have certain effects on the downward tendency. In particular, young people or graduates from "Double-First Class" universities are more likely to move down the urban hierarchy. Furthermore, unlike the return migration in the West, which is influenced by religion, race, family, and personal values, both the stickiness of the place of hukou based on regional affiliation and the stickiness of the place of study based on educational affiliation profoundly affect the choice of job-choosing migration of highly educated population in China, leading to the migration down the urban hierarchy. This study demonstrates the dynamic mechanism of the trend of highly educated talents moving down the urban hierarchy in depth, which provides both a theoretical and an empirical basis for policy-making for highly educated population migration.
设计创意人才的空间集聚及其影响机理研究: 基于城市舒适性视角
DOI:10.13249/j.cnki.sgs.2021.09.004
[本文引用: 1]
从城市舒适性理论出发,系统梳理了创意人才及其空间集聚过程的相关文献,构建了驱动中国设计创意人才空间集聚的城市舒适性指标体系,通过大数据方法从国内设计师社交平台站酷网获取设计创意人才的属性数据,运用地理集中指数、区位熵、负二项回归方法,深入剖析了中国设计创意人才的空间集聚特征与机理。研究表明:① 中国设计创意人才及其创作在空间上呈现出显著的集聚现象,以北京为主的一线城市最为集中,但杭州、长沙、武汉、郑州这些新兴城市也表现良好,甚至超过部分一线城市;② 城市舒适性理论在解释中国设计创意人才空间集聚时具有很强的解释力,其中文化环境、教育环境和自然环境是影响设计创意人才空间集聚的核心因素;③ 证实了西方创意阶层理论的部分结论,发现文化基础设施、文化遗产、文化旅游、高素质人力资本、温暖的气候与良好的空气质量是提升城市对创意人才吸引力的重要因子,同时发现科研投入对设计创意人才集聚具有明显挤出效应,并且西方学者普遍强调的生活环境舒适性因子对设计创意人才影响有限。为深入理解创意人才的空间过程及其影响机理提供了详实的实证案例,为地方政府改善城市创意环境提供了参考依据。
Spatial agglomeration of design creative talents and its driving factors: Based on the perspective of urban amenities
Creative talents are the new dynamics to urban and regional economic development. However, limited attention was paid to the spatial agglomeration mechanism and driving factors of creative talents. Based on the theory of urban amenities, the paper establishes an index system of urban amenities to the spatial agglomeration of creative talents in design sectors in China. An extensive dataset with over 3 million designers registered in the online platform zcool.com was adopted as the sample for this study. It aims to examine the spatiality of China’s creative talents and its association with urban amenities for cultural production. Using the quantitative methods such as location quotient, geographic concentration index, and the negative binomial regression method, we investigate the characteristics and mechanism of the spatial concentration of Chinese creative designers. The results suggest that: First, the distribution of creative designers shows a significant spatial agglomeration. First-tier cities like Beijing are the most dominated, but emerging cities such as Hangzhou, Changsha, Wuhan, and Zhengzhou are also well-performed, even better than some first-tier cities. Second, amenity-based approach has a strong explanatory power in explaining the agglomeration of Chinese design creative talents. The cultural environment, educational environment, and natural environment are the core factors that affect the agglomeration of design creative talents. Third, this study echoes with some conclusions of the creative class theory. Cultural infrastructures, cultural heritages, cultural tourism, high-quality human capital, warm climate, and good air quality were essential to enhance the city’s attractiveness to creative talents. Simultaneously, it is found that scientific research investment has a significant crowding-out effect on the accumulation of creative talents. The amenity factors of the living environment that were emphasized by Western scholars have a limited impact on agglomeration of creative talents. In conclusion, this research adopted a more inclusive urban amenity theory, and proved that urban amenities matter in the process of concertation of creative designers. It also provides a reference for local governments to promote their brain gain policy for creative talents.
中国创新型人才集聚的时空格局演变与影响机理
Spatio-temporal patterns evolution and impact mechanism of the agglomeration of creative talents in China
Modelling skilled and less-skilled interregional migrations in China, 2000-2005
Previous analysis and modelling of interregional migration in China have treated migrants as a homogenous group. The flow of skilled migration is the focus of recent research. However, the skilled and less‐skilled migrations have not been systematically analysed and compared in terms of their determinants. Previous modelling of interregional migration in China does not take network autocorrelation into consideration. This paper attempts to fill this research gap by modelling skilled and less‐skilled migrations in China using the eigenvector spatially filtered method. It is found that both skilled and less‐skilled migrants tend to move away from the interior to the coastal region. Results from the eigenvector spatially filtered negative binomial regression model show that, compared with the migration of less‐skilled people, the migration of skilled people is less influenced by the friction of distance, the regional unemployment rate, and the concentration of foreign investment but is more affected by the regional wage disparity. With respect to the effect of amenities, climatic amenities exert a strong influence on skilled migration but have positive effect on less‐skilled migration at origin and no effect at destination. Quality medical services are influential for the migration of less‐skilled people to destinations but no effect on skilled people. Copyright © 2016 John Wiley & Sons, Ltd.
Spatial patterns and determinants of skilled internal migration in China, 2000-2005
This paper examines the spatial patterns and determinants of China's interprovincial skilled migration by using data from 2005 one per cent population sample survey. While the coastal region benefits from the influx of skilled labour, the rest of China suffers from severe brain drain. Estimates from zero‐inflated negative binomial gravity models indicate that employment opportunities, especially interregional wage differentials, play a dominant role in attracting skilled labour, and that the impact of amenities on skilled migration turns out to be small and less clear. Findings suggest that China's skilled people prioritize their career prospects over the quality of life in the migration decision‐making process.
Modelling skilled and less-skilled internal migrations in China, 2010-2015: Application of an eigenvector spatial filtering hurdle gravity approach
In consideration of the issue of network autocorrelation and zero‐inflated migration data, the study constructs an eigenvector spatial filtering (ESF) hurdle gravity model (ESF HGM) to examine the determinants of China's skilled and less‐skilled internal migrations between 2010 and 2015. In our case, the ESF technique effectively reduces network autocorrelation bias, while the hurdle approach enhances the model prediction on the probability of zeros. Results from the ESF HGM have illustrated significant differences in the determinants between skilled and less‐skilled migrations. It is found that the gravity factors (population sizes at origins and destinations; migration distance), regional industrial structure, unemployment rate, and education level are more related to the migration of less‐skilled people. However, the migration of skilled people is more affected by the wage disparity, natural comforts, and medical services of a region. Our results have also highlighted the differences in some factors (employment rate; education level at origins) between the probability of having migration and the migration volume.
中国人才流动的地域模式及空间分布格局研究
DOI:10.13249/j.cnki.sgs.2018.12.005
[本文引用: 1]
依据教育部直属高校2015届本科毕业生生源与就业数据,采用指标评价与冷热点分析方法,分析升读大学与本科就业两个流动阶段的人才流动地域模式及省域空间分布格局。研究表明:① 人才流动具有明显的本地空间粘滞性特征,地域模式包括“本地-跃迁”型、“本地-半依附”型和“本地-依附”型。② 省际层面形成沿东南沿海与长江沿岸分布的“弓形”格局,显示了优势区域的整体粘滞性对人才高地形成的意义。研究指出,把握关键节点、依托城市群来发挥粘滞作用有助于城市推进引智工作。
Spatial pattern and the resulting characteristics of talent flows in China
By looking into the enrollment and employment data of graduates from universities directly administered by China Ministry of Education and with the method of index evaluation and hot-cold spot analysis, this article analyzed the graduates’ regional flowing patterns of two flowing stages of enrolled in the university and employed after graduation, and the resulting spatial distribution at the provincial level. The study found that the flow of talent from the university to study in different stages, can more clearly reveal the characteristics of the geographical space for talents. The local spatial viscosity in different regions dominates the flow of talent, and geopolitical and income factors in subsequent plays a role of regional adjustment. In the two stages, the flow of talent has significant spatial viscous characteristics. The geographical pattern of the flow includes “local-leapfrog” mode, “local-semi adherent” mode and “local-adherent” mode. Under the influence of different factors, the enrollment stage is dominated by “local-(semi) adherent” mode due to the adherence to the geo-social relations, while the employment stage is dominated by “local-leapfrog” type, which is adhered to the multiple possibilities of regional employment opportunities and benefits. From the perspective of the provincial pattern formed by talent flow, however, the spatial distribution of talents at the level of provincial level is more flat, while the phase of employment flow is more polarized in the longitudinal distribution. The “arch” pattern along the southeastern coast and the Yangtze River is characterized in both two stages, and the Yangtze River Delta region belongs to the hot spot of talent. However, because of the lack of provincial integration and linkage, the centralization of talent is not significant enough in the central and western regions, which highlight the important effect of the dominant area’s viscosity in the formation of the high ground of talent. It is suggested that different cities should bring into full play the role of local glutinosity to enhance the work of introducing university intelligence, from the two stages of talent generation and with the help of the strength of the urban agglomeration.
高级科学人才集聚成长的时空格局演化及其驱动机制: 基于中国科学院院士的典型分析
DOI:10.11820/dlkxjz.2013.07.015
[本文引用: 1]
以中国科学院1192 名院士为典型群体, 运用基尼系数、集中化指数和空间自相关识别和剖析了高级科学人才成长的时空规律及其演化机制。结果表明:① 中科院院士国内籍贯或出生地、国内最高学历(位)获取地和国内长期工作地, 在东中西3 大地带均呈现出较强的不平衡性;② 自20 世纪50 年代以来, 中科院院士在上述3 地的大部分省域表现出地理空间上显著的正的空间自相关性, 其国内籍贯或出生地、国内最高学历(位)获取地和国内长期工作地均呈现出集聚逐渐弱化的空间演化态势;③ 中科院院士在上述3 地带的HH集聚省域数量随年代推进分别呈现出先增后减、变化不大和逐渐增加态势, 主要分布于中国东部沿海省域及其邻近省域;④ 从20 世纪50 年代至今, 中科院院士在上述3 地带时空格局演化跃迁较多的是类型Ⅳ(省域本身及其邻居均保持了相同水平), 近半省域表现出了空间上的连续稳定性, 而类型Ⅰ、Ⅱ和Ⅲ在数量上也有所差异, 且存在部分省域跃迁明显的现象;⑤自然环境、经济基础、政治环境和文化教育的差异和变化不同程度的影响着中科院院士的总体空间分布和时空格局演化。
Evolution of temporal and spatial pattern and driving mechanisms of agglomerative growth of senior science talents: A case study of academicians of CAS
Taking 1192 academicians of Chinese Academy of Sciences (CAS) as a case study, temporal and spatial pattern and evolution mechanism of the development of senior science talents are identified and analyzed by using regional Gini coefficient, centralization index and ESDA method. The results show that: (1) At the provincial level, the locations where the academicians of CAS were native or born, acquired his or her highest education (degree), and had long-term work experiences, showed a strong imbalance among the eastern, central and western China. (2) Most of the locations of the three categories have shown significant and positive geospatial autocorrelation since the 1950s. In terms of agglomerative growth, during the four time periods from 1950 to 2010, including 1950s, 1980s, 1990s and the first beginning of the 21st century, the locations of native and birth places presented a spatial trend of gradual increase followed by gradual decrease, while the locations of both highest education (degree) and long-term work experience presented a spatial trend of gradual decrease. (3) HH concentrated locations of the three categories are mainly distributed in the eastern and coastal regions and their neighboring provinces, and the number of three types of locations presented the trends of increase followed by decrease, little change, and gradual increase, respectively. (4) Most provinces among the type IV locations of the three categories with transitions in the evolution of temporal and spatial patterns are the ones that maintain the same level within themselves and with the neighboring provinces during the four periods from 1950 to 2010, and nearly half of provinces presented continuous stability. Type I, II and Ⅲ provinces varied in numbers and some of the provinces had significant transitional phenomenon. (5) Differences and changes of natural resources, economic conditions, political and cultural environment, and educational atmosphere all more or less have influences on the overall spatial distribution and the evolution of temporal and spatial pattern of academicians of CAS.
The influence of income, lifestyle, and green spaces on interregional migration: Policy implications for China
Interregional migration has become an important driver shaping the economic landscape in China. By using 2010 Chinese census data, this study investigates the determinants of interregional migration and their implications for regional growth, estimated using principal component analysis, and a negative binomial regression model. In particular, it measures the roles of region size, income and lifestyle, green spaces, and employment opportunities in the origin and destination regions, and distance between the two regions. In addition to confirming the continuing influence of economic indicators as well as distance (owing to high moving costs), the findings presented herein add to the policy debate by encouraging regional policymakers to consider the effects of income, lifestyle, and green spaces. A strategy based on cheap labour is no longer encouraging growth in China, while many regions are suffering from environmental degradation. To address these shortcomings, an amenities‐based growth strategy concerning income, lifestyle, and green spaces for regional development is discussed, and policy implications are suggested. Copyright © 2015 John Wiley & Sons, Ltd.
高级人才空间流动因素分析及建立反区域筛选机制的意义
DOI:10.13249/j.cnki.sgs.2009.06.779
[本文引用: 3]
区域人才筛选是人力资源市场化配置中的马太效应,其空间表现为受区域之间经济梯度力的作用,高级人才从小城市向大城市或从落后地区向发达地区的逆向流动。对440份调查问卷的分析表明,强势地区对高级人才筛选力量十分强大,这种流动在人才年龄段上表现为双峰特征,与家庭状况密切相关,但与距离基本无关。由于区域人才筛选严重影响区域和谐发展,影响民族团结、社会安定及人口质量,必须致力于建立一种反区域人才筛选机制,将弱势区域的经济开发与人才开发有机结合起来;对弱势地区高级人才建立地区年功序列制度;稳定弱势地区初次就业的高校毕业生并为企业吸引高级人才提供制度支持。
Analyses of factors of high-level talents′ migration and significance of establishing anti-selection mechanisms among regions
Regional selection of talents is a kind of Matthew effect in the condition of market disposing human resources, which shows as talents’migration shifting from developing regions to developed regions.The analyses of 440 questionnaires show that the selective power from developed regions or large cities is very strong.From the angle of regional shift, among the 147 migrants, the horizontal migration (the West to the West, the Middle to the Middle, the East to the East) makes up 36%, the converse migration (the West to the Middle or the East, the Middle to the East) makes up 52.4%, while the direct migration (the East to the Middle or the West, the Middle to the West) makes up only 11.6%.From the angle of urban shift, the horizontal shift (between same level cities) makes up 67.3%, the converse migration (low level cities to high level cities) makes up 25.5%, while the direct migration (high level cities to low level cities) makes up only 7.5%.Among the 293 persons who haven’t migraten, the subjective desire of converse migration is even stronger.Those who hope to migrate to the East make up 83.5%, while those who hope to migrate to the West and the Middle in all make up only 16.7%.From the angle of cities, among the 293 persons, those who hope to migrate to metropolises and large cities in all make up 81.2%, while those who hope to migrate to medium-sized and small cities in all make up only 18.8%.The analyses also show that the migrant talents distribute in two peak age groups, one is between 25 to 30 years old, another is 45 to 50, that the migration is closely related to talents’families, but unrelated to moving distance.As regional selection of talents seriously affects poor regions, it is important to establish a kind of anti-selection mechanisms among regions.This kind of mechanisms is the important foundation of regional harmonious development, the important condition of the unity of various nationalities, the important avenues to improve the quality of population of poor districts.To establish the anti-selection mechanisms, the central government should combine talents development with economic development of poor districts, should establish a kind of award system according to work years in poor districts, should stabilize those graduating students who obtain their initial employment in poor districts by taking effective steps, should supply a powerful economic support for poor districts to draw high-level talents, and should create favorable conditions for poor districts’talents.It is important to realize that this kind of mechanisms is not planned measures which restrict the flow of trained personnel.On the contrary, even the economic measures, the policies should be based on market to realize rational distribution of high-level talents.
粤港澳大湾区人才集聚的演化格局及影响因素
DOI:10.11821/dlyj020200575
[本文引用: 2]
知识经济时代人才是建设粤港澳大湾区世界级城市群的重要生产要素。本研究采用2005年、2010年和2015年广东省人口普查和1%抽样调查数据,以及香港和澳门对应口径的统计数据,以县市为基本单元,提出从受教育程度和职业技能两个口径测度人才集聚水平,系统解析粤港大湾区高学历与高技能人才集聚的演化格局及影响因素。结果表明:① 粤港澳大湾区作为中国经济高度发达地区,人才集聚优势高度集中在香港、澳门,内地珠三角城市群的人才集聚水平低于京津冀城市群和长三角城市群。② 2005—2015年,粤港澳大湾区高学历人才集聚持续均衡化,而高技能人才集聚优势仍然体现在香港、澳门,内地因为发展教育提升的高学历人力资本尚未完全有效转化为高技能人力资本。③ 香港人才集聚水平处于绝对领先,澳门、广州、珠海和深圳次之,而外围县市相对处于人才洼地,特别是制造业发达的佛山、东莞人才集聚水平相对偏低。④ 面板模型表明,服务业对高技能人才集聚的拉动效应强于高学历人才,而制造业的拉动作用并不突出。高等教育对高技能人才集聚的带动作用要弱于高学历人才。高薪资待遇有利于促进高学历人才集聚,但对高技能人才集聚的促进作用有限。新时期,亟需推动粤港澳三地管理制度衔接、产业转型升级和优质高等教育建设,推动粤港澳大湾区建设国际创新中心。
Talents concentration in the Guangdong-Hong Kong-Macao Greater Bay Area, China: Evolution pattern and driving factors
In the era of knowledge economy, talents concentration plays a key role in the development of a world-class urban agglomeration of Guangdong-Hong Kong-Macao Greater Bay Area (GHM). Based on the population census of Guangdong Province in 2010, the 1% population sampling survey in 2005 and 2015, and employment statistics in Hong Kong and Macao, this study measures the level of talents concentration from two perspectives of educational attainment and occupation on the county scale, and analyzes the evolution pattern and motivations of talents concentration in the GHM. The results show that: (1) GHM is one of the highly developed economic areas in China, and there is the absolute advantage of talents concentration in Hong Kong and Macao, while the level of talents concentration in the Pearl River Delta urban agglomeration is lower than that in the Beijing-Tianjin-Hebei and Yangtze River Delta urban agglomerations. (2) From 2005 to 2015, the spatial distribution of highly-educated talents in the GHM tends to be balanced, and there is also the advantage of the concentration of highly-skilled talents in Hong Kong and Macao. The increasing human capital defined by educational attainment in the mainland, which is caused by the expansion of college enrollment in China, has not been fully and effectively transformed into the advantage of human capital defined by occupation. (3) The level of talents concentration in Hong Kong plays an absolute leading role, followed by Macao, Guangzhou, Zhuhai and Shenzhen, while the counties and cities on the periphery of GHM have a low level of talents concentration. In particular, although Foshan and Dongguan have some developed manufacturing industries, their talents concentration level is relatively low. (4) The panel model shows that the service industry has a greater promoting impact on the concentration of highly-skilled workers than that of highly-educated labors, and manufacturing industry does not influence the talents concentration. Higher education plays a less important role in promoting the agglomeration of highly-skilled workers than that of highly-educated labors. High salary helps promote the concentration of highly-educated workers, while it does not boost the concentration of highly-skilled labors. In the new era, it is urgent to promote the cohesion of management systems in Guangdong, Hong Kong and Macao, the industrial transformation and upgrading, and the establishment of high-quality higher education, ultimately, building GHM into an international innovation center.
基于“七普”的“胡焕庸线”两侧人口集疏新态势及影响因素
DOI:10.11821/dlxb202212006
[本文引用: 1]
随着新型城镇化建设的推进,“胡焕庸线”两侧人口发展出现了新态势。本文基于第七次人口普查数据,依据地级尺度划定的“准胡焕庸线”,分析2010—2020年“胡焕庸线”两侧人口集疏模式的新特征,并探讨影响因素。研究表明:① “胡焕庸线”依然稳定,2020年东南半壁与西北半壁的人口比为93.5∶6.5;② 西北半壁人口份额仍然微增,但是增幅较之前明显下降; ③ 2010—2020年西北半壁人口集中化指数由降转增,西北半壁和东南半壁的人口分布集中化程度均有所提升;④ 东南半壁人口集疏分化不断强化,2010—2020年人口负增长区的面积占比已达54.22%,超过人口正增长区;西北半壁人口集疏的马太效应特征愈发明显,人口负增长区占比也已升至26.15%;⑤ 省会首府人口增长优势愈发突出,且西北半壁比东南半壁更为明显;⑥ 经济发展水平、城区人口规模等级、行政区划等级等因素与区域人口变动显著相关;西北半壁行政区划等级对人口增长的影响效应尤为突出。综合来看,西北半壁已经出现与东南半壁相似的人口集疏过程,人口集疏模式已突破了“胡焕庸线”。中国即将迎来人口总量拐点,人口城镇化进程逐步减速,密切关注“胡焕庸线”两侧人口发展的新特征,对推动全国各区域协调发展具有重要的战略意义。
The novel pattern and driving factors of population spatial distribution on both sides of the "Hu Line" based on seventh census in China
The "Hu Line" is a geographical line connecting Heihe City and Tengchong City in China. It is densely populated on the southeast side of the "Hu Line" but sparsely populated on the northwest side. Since the implementation of New-type Urbanization strategy in 2014, the spatial pattern of population distribution on both sides of the "Hu Line" has changed a lot. We put forward the "Quasi-Hu Line" based on the boundaries of prefecture-level administrative divisions. According to the seventh population census data in 2020, this study focuses on the new characteristics of population spatial patterns and population growth patterns on both sides of the "Quasi Hu Line" from 2010 to 2020. We analyze the driving factors combined with the development of New-type Urbanization. The main conclusions are as follows: (1) The human-land relationship reflected by the "Hu Line" was still stable, and the overall distributions of densely populated and sparsely populated areas were also steady. In 2020, the population ratio of the southeast side to the northwest side was 93.5∶6.5. (2) The population share of the northwest side still increased slightly, but the increment was significantly lower than that before 2010. (3) The centralization index of the population on the northwest side turned from decline to increase after 2010, which indicated the concentration of spatial population distribution in the northwest half was similar to that in the southeast half. (4) The spatial differentiation of population growth on the southeast side has been strengthened. The negative population growth area accounted for 54.22% of the southeast side from 2010 to 2020, exceeding the positive population growth area. The population growth on the northwest side had also changed from the "relative balance" model to the "Matthew effect" model, with the negative population growth area accounting for 26.14% of the northwest side. (5) The relative population growth advantage of provincial capitals was becoming much more prominent. The spatial polarization process of population growth slowing down or negative growth was formed in the surrounding areas of provincial capitals. In addition, such a process on the northwest side was more significant than on the southeast side. (6) The driving factors, including the level of economic development, the scale of urban population size, and the level of administrative divisions, significantly impacted population growth. For the northwest side, the level of administrative divisions had a particularly significant impact on population growth, while the impact of urban agglomerations was not noticeable. In general, the northwest side had begun to present similar population spatial distribution patterns and driving factors with the southeast side. In the context of population migration and urbanization, the novel patterns of spatial population distribution reflected a kind of "breakthrough" of the "Hu Line". With China's total population turning to decline and urbanization entering the mid-late stages, more attention should be paid to the regional differences and coordination of demographical structures on both sides of the "Hu Line".
2000-2020年中国省际人口迁移格局的演化特征及影响因素
DOI:10.11821/dlxb202212007
[本文引用: 2]
准确认识和把握21世纪前20年中国人口迁移的地理格局和影响因素,是推动新型城镇化建设及区域均衡发展的关键科学问题。借助特征向量空间滤波泊松伪最大似然估计(ESF PPML)引力模型,基于第六次和第七次全国人口普查数据、2005年和2015年全国1%人口抽样调查数据,研究了2000—2020年中国省际人口迁移的时空演化特征及影响因素。主要结论为:① 2000—2020年间人口迁移格局总体稳定,具有较强的不平衡性和网络溢出效应,大量人口从中部、西部、东北地区迁移至东部地区;② 人口迁移格局稳中有变,不平衡程度和空间集聚程度逐渐减弱,人口迁移和人口分布显现出南北分异趋势,东北地区人口迁出强度不断增强; ③ 传统引力模型因素(人口规模、地理距离)、地区社会经济发展因素(工资差异、科技教育投入占比、医疗水平)、社会网络因素、环境舒适度(PM<sub>2.5</sub>浓度)以及生活成本(住宅价格占比)共同影响人口迁移格局;④ 区域经济差异对省际人口迁移的影响作用逐步弱化,人口迁移逐渐转变为对工资收入、高质量公共服务、环境舒适度等多因素考虑的决策过程,生活成本逐渐对人口迁移产生显著影响。
Spatiotemporal patterns and determinants of interprovincial migration in China between 2000 and 2020
Understanding the geographical pattern and driving factors of China's population migration in the first 20 years of the 21st century has become a pivotal issue in promoting the construction of the new-type urbanization and interaction development between regions during the 14th Five-Year Plan period (2021-2025). Supported by the data of the sixth and seventh national population censuses and 2005 and 2015 national 1% population sample surveys, this paper aims to investigate the spatiotemporal evolution characteristics and influencing factors of interprovincial migration in China from 2000 to 2020. Relevant population geospatial analysis and the eigenvector spatial filtering Poisson pseudo-maximum likelihood estimation (ESF PPML) gravity model are employed. The following conclusions are drawn: (1) China's population migration patterns were generally stable from 2000 to 2020, where notable imbalance and network spillover effects were also detected. A large number of migrants from central, western and northeast parts of China tended to move to the eastern region. (2) The overall migration patterns between 2000 and 2020 revealed several changing characteristics. The degree of imbalance and spatial agglomeration of migration patterns gradually weakened. Yet, a north-south differentiation emerged. It is also found that the out-migration trend of the northeast region increased with the elaspe of time. (3) The ESF PPML model indicated that gravity factors (population scale, geographical distance), regional socio-economic factors (wage disparity, proportion of investment in science and technology and education, medical care), social network factors, environmental comfort (PM2.5 concentration) and living costs (proportion of housing price) drove the interprovincial migration pattern between 2000 and 2020. (4) The influence of regional economic differences on interprovincial migration reflected a weakening trend. The pattern of population migration gradually turned into the decision-making of diversified demands for the economy, public services and urban amenities, while the living cost factor represented by housing price had played a gradually significant part. The conclusion of this paper provides policy references for the construction of the new-type urbanization and coordinated development between regions during the 14th Five-Year Plan period in China.
江苏省流动人口城-镇-乡分布的时空分异与影响因素
DOI:10.11821/dlxb202212008
[本文引用: 1]
以江苏省为研究区,探索了2010—2020年间流动人口在城、镇和乡(即城区、镇区和乡村3类地域类型)分布的时空分异和影响因素。研究发现:① 江苏省城和镇流动人口占常住人口的比例普遍增加,但镇的增幅明显高于城,乡的流动人口占比却在近一半的市县出现减少。② 江苏省流动人口苏南—苏中—苏北分布的梯度格局尚未发生根本性改变,苏南仍是吸引流动人口的高地,但苏中和苏北的镇对省内流动人口的吸引显著增强。③ 苏南一些乡和苏中、苏北一些镇流动人口占比有明显提升,体现了乡镇对流动人口的集聚能力。④ 模型结果显示,政府社会投入的增加有利于增强城、镇、乡对流动人口的吸引力;城镇居民恩格尔系数在城和镇对两类流动人口占比的影响有所不同;产业的影响因城、镇和乡的不同而分异:工业在城、镇、乡均为正向影响;产业结构的高级化在城镇仅对省内流动人口占比具有正向作用;农林牧渔业在乡为负向影响。
Spatiotemporal differentiation and influencing factors on floating population distribution in city-town-rural areas of Jiangsu province
Based on the data of the sixth and seventh national censuses (Jiangsu province), this paper seeks to explore the spatiotemporal differentiation and influencing mechanism of the distribution of floating population in cities (districts), towns, and rural areas from 2010 to 2020. The findings show that: (1) The floating-permanent population ratio in cities and towns in Jiangsu generally increased from 2010 to 2020, but the rate of increase in towns was significantly higher than that in cities; the floating-permanent population ratio decreased in nearly half of the units in rural areas. (2) The gradient pattern (south Jiangsu - central Jiangsu - north Jiangsu) of the distribution of the floating population remained stable. South Jiangsu is still a highland for attracting the floating population, but towns in central and north Jiangsu have become attractive to the floating population in the province. There are also differences in the distribution of the intra- and inter-floating population in cities, towns, and rural areas. (3) The share of the floating population in parts of rural areas in south Jiangsu and some towns in central and north Jiangsu increased significantly, reflecting the agglomeration capacity of the towns and rural areas for the floating population. (4) The results of the models show that the increase in government social investments is important to enhancing the attractiveness of cities, towns, and rural areas to the floating population; the Engel coefficient of urban residents has different effects on intra- and inter-floating population in cities and towns; the impacts of industry in cities, towns and rural areas are positive; the upgrading of the economic structure only has a positive effect on the ratio of intra-floating population in cities and towns; the effect of the farming industry is negative in rural areas.
2000-2020年中国人口分布格局演变及影响因素
DOI:10.11821/dlxb202202008
[本文引用: 1]
基于第五、六、七次全国人口普查数据,本文分析了2000—2020年中国人口分布的空间格局、集散态势和影响因素。结果表明,中国人口分布依然保持东密西疏的基本格局,胡焕庸线两侧的自然地理环境差异性决定了这一格局的长期稳定性;人口空间集中化趋势在21世纪初的10年内主要发生在东南半壁,但在2010—2020年间成为各区域的共同特征。省会城市的人口集聚能力持续增强,2010—2020年的优势更加凸显,但这种行政力量主导的首位度提升效应将随着全省发展阶段的演进而逐渐弱化。人口变动的区域分化明显:沿海城市群的空间连绵化逐渐形成了强吸引力、高承载力的沿海人口增长带,东北地区几乎转向全面的人口收缩,中部各省依托省会展开的人口竞争依然激烈,川渝黔地区普遍实现了人口的止降回增,西北地区则面临人口收缩风险。此外,区域人口增长的驱动因素逐渐从经济要素主导转为经济要素和舒适性要素并重,各地区舒适性的差异可能将成为影响未来人口空间格局变化的重要因素。
China's changing population distribution and influencing factors: Insights from the 2020 census data
Using data of the latest three decennial censuses, this paper systematically analyzes the overall spatial pattern, changing trends, and influence mechanisms of China's population distribution since 2000. The study reveals that the general population distribution pattern of "dense east and sparse west" in China has not changed, which is determined by the differences in natural geographic environments on the two sides of Hu Line. In the first decade of the century, population concentration was mainly found in the southeastern area, but it has been observed in all regions in the recent decade. Provincial capitals have become the winners of population competition and the advantages of population growth of provincial capitals have been further strengthened in the recent decade compared with 2000-2010. However, the administrative power-led effects of the increasing dominance of provincial capitals will gradually weaken with the development of their provinces. The regional differentiation of population changes is also apparent: coastal region gradually forms a dense belt of population and towns with solid population attraction based on the development of urban agglomerations; the northeast region almost turns to a complete population shrinking status; central provinces still compete fiercely for population based on their capitals; the population of Sichuan, Chongqing, and Guizhou has stopped the decline and returned to growth; and the northwest region faces the risk of population loss. In addition, this paper finds that the driving factors of regional population growth have gradually changed from economic factors to both economic and amenity factors, and the difference of amenities among regions may become an important factor for future changes in China's population geography.
基于城乡人口变动视角的中国城镇化地域类型时空演变
DOI:10.11821/dlxb202212005
[本文引用: 1]
城镇化是城镇和乡村人口变动共同作用的结果。本文从城乡人口变动的视角提出了城镇化地域类型的划分方法,基于历次全国人口普查数据,考察了中国城镇化地域类型的时空演变及其影响因素。研究发现中国的城镇化于1990年后进入快速阶段且当前仍在加速,但城镇化的实现路径存在较强的时空动态性:① 随着人口自然增长减缓和乡城迁移扩张,全国城镇化地域类型由城乡扩张型转变为城镇吸引型,乡村人口减少对城镇化的贡献持续增强;② 城镇吸引型是各地最主要的城镇化地域类型,但2010年以来大量地区因乡村人口加速外流而转变为乡村流失型,城乡扩张型地域的空间范围大幅收缩至西藏、上海等地,而城乡收缩型地域在东北地区的非省会城市大范围扩张;③ 经济性因素仍是当前中国城镇化的核心驱动因素,经济增长带动乡村人口外迁,工业化长期有利于城乡协调共进,而公共服务等社会性因素的作用仍然有限;④ 新型城镇化和乡村振兴的政策效应还有待发掘,西部城市群、中小城市的吸引力以及乡村地区的人口发展等问题仍需更多的研究关注。本文最后对中国城镇化的趋势性、动力机制和未来研究重点展开了讨论。
Urban-rural population change and the regional types evolution of China's urbanization
Urbanization is the outcome of population dynamics in both urban and rural areas, which has a profound influence on urban-rural development. This paper puts forward a method to identify regional types of urbanization from the perspective of urban-rural population change. Using this method and based on the census data, this paper analyzes the spatial pattern and influencing factors of China's urbanization. The results show that China has entered an era of rapid urbanization since 1990. Urbanization rates have risen in almost all regions, but with varied pathways over time and across regions. With the decline of natural population growth and the expansion of rural-urban migration, the process of urbanization depends more and more on rural population loss, leading to the transformation of urbanization regional type from "urban-rural growth" to "urban growth" in the country. Although the "urban growth" is the most common regional type of urbanization at both provincial and prefecture levels, the transformation of urbanization regional type from "urban growth" to "rural loss" has been witnessed in a large number of regions in the past decade. Besides, regions with the "urban-rural growth" type have shrunk to places such as Tibet and Shanghai while regions with the "urban-rural loss" type have expanded in non-provincial capital cities in Northeast China. At present, China's urbanization regional type is still driven by economic development: rural population declines faster in areas with rapid economic growth, leading to the "rural loss" urbanization; rapidly industrialized regions have undergone faster urban population growth and slower rural population loss than their counterparts; while the effect of social factors such as public services on urbanization regional type is limited. In addition, the impact of new urbanization strategy and rural revitalization strategy is not yet clear, given the limited attractiveness of urban agglomerations of the western region as well as small and medium-sized cities and the prevalence of rural population loss.
