

1 引言
黄河流域在全国经济社会发展和生态环境安全等方面具有重大意义,但面临着严峻的生态环境约束[1]。根据《2021年中国生态环境统计年报》,位于黄河流域的内蒙古、山东、山西等省区,在工业二氧化硫、工业颗粒物等污染物排放量方面位居全国前列,根据生态环境部公布的2022年重点城市空气质量排名,排名后20位的城市有15个城市位于沿黄省区,反映了以“高污染、高耗能、高排放”为主要特征的发展方式导致黄河流域面临严峻的生态环境问题,限制了黄河流域高质量发展[2]。2022年工业和信息化部、国家发改委等部门联合印发《关于深入推进黄河流域工业绿色发展的指导意见》,旨在增强工业绿色发展活力,推进黄河流域生产生活方式绿色转型。绿色全要素生产率(Green Total Factor Productivity,GTFP)将经济发展效益和资源环境效益有机结合,既符合现实的经济生产过程又体现了绿色发展理念,较为科学地表征高质量发展水平。在生态绿色发展约束下,如何提升黄河流域GTFP对促进全流域高质量发展和绿色转型具有重要的理论和实践意义[3]。
关于黄河流域绿色高质量发展的实现路径,学术界围绕着经济结构与产业转型升级,生态治理与体制机制改革,创新发展与协调发展等方面进行了有益探索[4⇓⇓-7],其中,流域内产业高质量发展既是提升GTFP的重要因素,也是黄河流域高质量发展的关键途径[8,9]。相关理论研究显示,产业集聚所产生的规模经济效应能够通过技术扩散和降低污染治理成本两种途径提高GTFP,此外,实现资源要素的循环利用也是产业集聚有效降低环境污染的重要途径[10,11]。在高质量发展背景下,“传统的制造业经济”逐渐向“服务业经济”转变[12],服务业在国民经济中的占比逐渐超过制造业,服务业对高质量发展的影响逐渐受到学者们的关注[13],其中,具有知识密集、节能减排、集聚分布、产业融合度高等特征的生产性服务业作为制造业配套产业和服务业重要组成部分,有助于形成“研发-生产-储运-营销”等上下游环节一体化的现代服务业集群[14],逐步成为促进产业由生产制造型向生产服务型转变,进而提高绿色生产效率成为实现高质量增长的新动能[15]。相关实证研究也指出生产性服务业集聚有助于推动黄河流域高质量发展[16]。在此基础上,研究生产性服务业集聚对黄河流域GTFP的影响与空间溢出效应,对于落实绿色发展理念,制定区域产业政策,进而提升GTFP及实现经济高质量发展具有重要价值。
2 文献综述
全要素生产率(Total Factor Productivity,TFP)将资本和劳动等投入要素约束纳入到分析框架中,是衡量地区GDP的综合产出效率、反映经济增长绩效的重要指标[17]。绿色全要素生产率(GTFP)的概念衍生于传统全要素生产率(TFP),在分析框架中同时纳入了生产效率和环境污染,包含多种投入、期望产出和非期望产出等方面,可以有效反映经济发展质量[18]。现有研究中关于GTFP的测算方法,通常采用索罗余值法、随机前沿分析、DEA模型等方法进行测度[19],在研究中国内外学者充分考虑到DEA法(Data Envelopment Analysis)具有排除要素不同量纲,有效处理多投入、多产出等优点,广泛利用DEA法及其优化模型(SBM-DEA)法对GTFP进行测度[20]。关于GTFP的影响因素方面,相关研究围绕产业结构、环境规制、数字经济、制造业集聚等角度进行探讨[21,22]。自“服务业集聚”概念提出后,生产性服务业集聚对GTFP的影响研究也受到了相关学者的关注,并在以下三个方面取得了一定的进展。
一是生产性服务业集聚对GTFP期望产出的影响。GTFP的期望产出体现在城市经济增长与经济绩效提升,关于生产性服务业集聚能否促进城市经济发展,学术界存在两种不同观点,其中一部分研究指出生产性服务业集聚能够吸引人才和先进生产要素,是培育经济发展新动能的重要因素[23],同时也可以基于生产性服务业与制造业的分工,人才、基础设施和技术共享等相关途径减少生产者的生产运营成本,促进制造业经济效率的提升[24]。生产性服务业集聚也能够充分发挥竞争和规模经济效应并优化中间环节,提升经济效率[25]。信息和通信服务等生产性服务业集聚有助于拓宽渠道、改进流程,突破知识获取的时空障碍,实现知识共享并提升生产效率[26]。另一部分研究认为生产性服务业集聚对经济效率的提升受到产业属性、人力资本、经济发展阶段、地理特征等差异的影响,从而造成生产性服务业集聚对经济效率的促进作用不尽相同[27,28]。
二是生产性服务业集聚对GTFP非期望产出的影响。GTFP的非期望产出体现在污染物的排放等方面,相关研究对生产性服务业能否减轻污染物排放、提高城市环境质量存在争议[29],部分学者指出,生产性服务业集聚敦促生产者增加对新产品和新技术的资金投入,而且有助于推动低碳环保技术的应用,实现城市污染物的减排[30]。生产性服务业集聚所产生的规模经济效应、竞争效应将推动产业融合互补从而促进资源的集约高效利用[31]。也有研究指出生产性服务业若出现过度集聚则可能造成城市土地资源的过度开发,增加城市环境治理的负担,甚至将增加周围城市的碳排放[32]。还有学者认为,生产性服务业集聚对城市环境的作用效应具有倒“U”型曲线特征,当生产性服务业合理布局时将充分发挥集聚效应,抑制非期望产出的增加,提升GTFP,当生产性服务业集聚超过阈值时发挥拥堵效应,可能阻碍城市环境质量的提升[33]。
三是生产性服务业集聚对GTFP的空间溢出效应。在生产性服务业集聚对GTFP影响的研究中,空间溢出效应受到了相关学者的重点关注[34]。相关研究认为生产性服务业集聚可以通过建立竞争与学习机制的形式提高生产效率,也将加强区域内分工与协作机制,促进城市间的知识交流与创新合作,完善区域创新网络并推动城市间技术溢出,进而提高区域内城市的GTFP[35]。不同产业类型和不同集聚外部性视角下生产性服务业集聚对邻近城市的影响具有相异特征,其中高端生产性服务业集聚相较于低端生产性服务业对邻近城市的作用更加明显,生产性服务业多样化集聚相较于专业化集聚空间溢出效应更加明显[36]。还有研究表明集聚的空间溢出边界可能会随着地理距离的增大而减小[37]。
此外,学术界还围绕着黄河流域服务业和GTFP等方面开展了一定研究[38],具体表现在:一方面,围绕黄河流域GTFP的测算及影响因素展开探讨,相关学者在研究中通常采用DEM-GML和DEA-SBM等模型对黄河流域GTFP进行测算,并从环境规制、产业结构、FDI等角度探讨黄河流域GTFP的影响因素[3,39]。另一方面,围绕服务业集聚对黄河流域发展质量的影响展开探讨,例如李本庆等从理论和实证的角度证实了生产性服务业集聚有利于提升黄河流域高质量发展水平[16];张娜等通过实证研究发现服务业集聚能够提升黄河流域绿色经济效率[40];张双悦等也指出生产性服务业的发展是实现黄河流域高质量发展的重要途径[9,41]。
综合来看,已有研究进行了一定的理论和实证探索,但从空间溢出角度探讨黄河流域生产性服务业集聚对GTFP的影响研究相对较少。同时,也缺乏考虑不同类型生产性服务业对GTFP的空间溢出效应和生产性服务业集聚的空间溢出距离边界。基于此,本研究以黄河流域作为研究样本,在测算考虑“非期望产出”的GTFP基础上,构建SDM模型实证检验了生产性服务业集聚对GTFP的提升作用,并综合考虑生产性服务业集聚的空间溢出效应和空间溢出的地理边界,以及不同类型生产性服务业集聚的空间溢出效应,以期为推动黄河流域绿色转型,因地制宜制定和实施相关产业政策,进而加快经济高质量发展提供参考。
3 理论机制
3.1 生产性服务业集聚效应
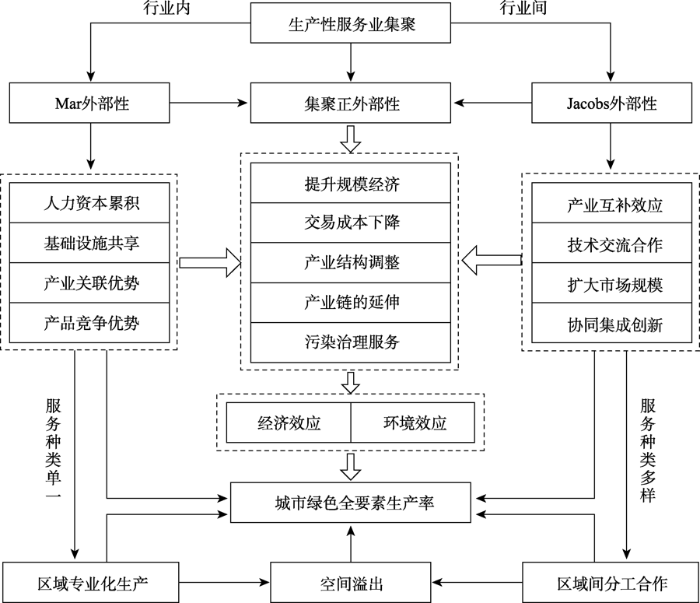
产业空间集聚能够通过共享、匹配和知识溢出等相关途径促进城市技术创新并提高生产效率[42]。生产性服务业集聚通常指提供生产性服务的相关行业在区域或城市内聚集,随着社会专业化分工的演化,生产性服务业集聚凭借知识密集、节能减排、集聚分布、产业融合度高等特点逐渐形成规模化的产业部门[43]。生产性服务业影响GTFP主要通过集聚所产生的外部性视角,主要包括两种类型的外部性,一是Mar外部性,即专业化集聚,Mar外部性理论强调单一或同类行业内的集聚演变成紧密生产链,更有利于先进的技术手段和管理经验在行业内溢出,形成“劳动力池”效应和“产业关联”效应。二是Jacobs外部性,即多样化集聚,强调不同类型的行业集聚能够充分发挥不同行业知识溢出,形成“产业互补效应”,更有助于提升技术水平和生产效率。
根据生产性服务业集聚的外部性视角,生产性服务业专业化集聚强调同一行业内部主要具有共享基础设施、减少中间投入、学习技术经验等集聚正外部性[44]。城市内部可以通过生产成本优势、基础设施共享优势和劳动技术专业化优势等最大程度地发挥城市内各企业和各行业的比较优势,增加新方法和新理念等高等要素在企业各种生产环节的应用,提高产业链和价值链的地位。多样化集聚强调不同行业间的知识交流与技术合作有利于企业扩大市场规模,激发协同创新与集成创新[45]。生产性服务业多样化集聚水平高的城市可以形成不同产业间网络化关系,有利于相关企业获得多样化的技术和人才要素,提高生产效率,也将为制造业企业提供多样化的污染治理服务,降低GTFP中非期望产出的增长[46]。若生产性服务业的集聚水平跨越门槛值,则会出现集聚的拥堵效应起到支配地位的情况,集聚所产生的规模效应会造成负向影响,并占用大量社会资源,增加城市生态治理成本,不利于区域GTFP的发展[47]。
3.2 生产性服务业集聚空间溢出效应
生产性服务业通常为制造业提供相关服务,因此考虑到成本问题通常会趋近于所服务的制造业进行选址,但由于城市内和城市间信息通信技术和交通等基础设施的发展为生产性服务的相关企业提供了更广阔的布局选择,将导致部分企业并未选择在其所服务的制造业外围进行布局,形成了跨区域分布的地理格局[48]。在此格局背景下生产性服务业通过“本地化”和“区际化”服务实现了对本地和邻地的影响。此外,生产性服务业所供应的部分相关产品也具备难以保存的特点,通常基于信息交换的方式实现对制造业的服务。这种服务型信息分为显性和隐性两种类型,其中显性信息可以通过信息技术和通讯手段进行远距离传播,但是隐性信息需要基于潜移默化的接触获取,难以实现大范围的传输,因此生产性服务业的空间效应一定程度上依赖于地理距离的远近[49]。
生产性服务业集聚对邻近地区GTFP也可能产生负向溢出效应,当相邻城市间经济发展要素存在竞争关系时,发展水平相对较高的城市可能形成“虹吸效应”吸引周边城市的资本、资源等要素向本地汇聚,因此,生产性服务业集聚对邻近城市的影响可能同时产生正向与负向的空间溢出效应,形成“向心力”与“离心力”。不同集聚外部性视角下生产性服务业的空间溢出效应也存在一定的差异,生产性服务业Mar外部性以单一或同类行业集中分布为主,企业所服务的制造业范围相对较小,导致其基于本地优势制造业企业提供服务,对邻近城市的影响带动作用不突出。生产性服务业多样化集聚(Jacobs外部性)基于不同类型的行业集聚发展,多元化的生产性服务业集聚会带来不同领域的知识经验、管理手段、人才等要素集聚,因此所提供的服务范围并不仅仅局限在本地优势行业,对邻近城市的影响作用相对较强[50](图1)。
图1
4 黄河流域城市绿色全要素生产率测算与时空格局分析
4.1 城市绿色全要素生产率(GTFP)的测算
研究参考既有文献并根据数据的可获取性,测算黄河流域绿色全要素生产率(表1)[37]。其中,投入要素包括资本、劳动力、能源和土地要素,“期望产出”以地级市GDP来衡量,“非期望产出”包括工业污染排放等方面,涉及多投入多产出,因此借鉴相关学者的研究,采用在DEA框架下的超效率SBM模型测算黄河流域2004—2019年GTFP[51]。对于能源投入变量的选取,一方面电力数据相对准确,已有研究通常选取用电量作为能源消费的指标[21];另一方面电力需求的GDP弹性值比较接近总能源需求,同时考虑到地级市能源数据的可获得性,本文选择用电量数据表征能源投入。研究以黄河流域为研究区,考虑到四川省现已划入长江经济带、内蒙古的蒙东(呼伦贝尔市、兴安盟、通辽市、赤峰市)属于东北地区,并基于数据的可获得性,将青海、甘肃、陕西、宁夏、内蒙古(除东四盟)、山西、河南和山东8个省(区)纳入研究范围。相关数据主要来自于历年各省(区)统计年鉴和《中国城市统计年鉴》。
表1 GTFP测算体系
Tab. 1
| 目标层 | 准则层 | 指标层 | 单位 | 数据说明 |
|---|---|---|---|---|
| 投入 | 资本投入 | 全社会固定资产投资 | 万元 | 确定2003年基期固定资产存量, |
| 能源投入 | 全年用电量 | 万kW | ||
| 劳动力投入 | 单位从业人员 | 万人 | ||
| 土地投入 | 城市建设用地面积 | km2 | ||
| 期望产出 | 经济产出 | 地区生产总值 | 万元 | 各年GDP 按照价格指数以 2003年为基期平减 |
| 非期望产出 | 环境产出 | 工业废水排放量 | 万t | |
| 工业二氧化硫排放量 | t | |||
| 工业烟尘粉尘排放量 | t |
4.2 黄河流域城市绿色全要素生产率(GTFP)时空格局研究方法
4.3 黄河流域城市绿色全要素生产率(GTFP)发展的动态特征
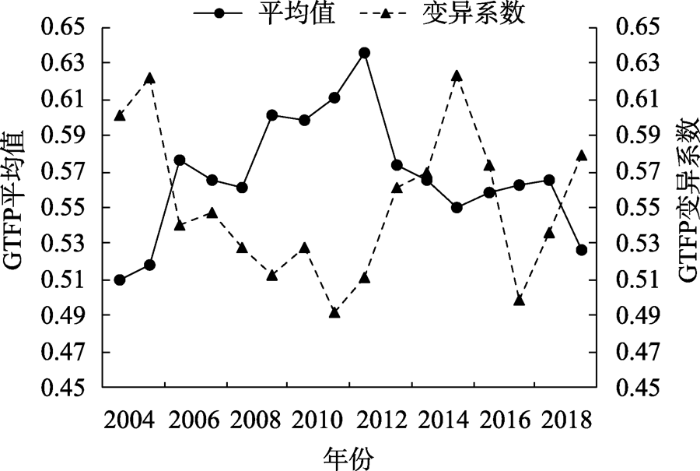
为探讨黄河流域GTFP发展的动态特点,借鉴相关研究刻画出黄河流域GTFP的核密度曲线(图2)和平均值、变异系数演变趋势(图3)。由图2可知,黄河流域GTFP的核密度曲线在研究期内波峰并无显著变宽和变窄,但曲线呈现出先上升后下降再上升的“N”型演变过程。核密度曲线显示黄河流域GTFP呈现出“两极分化”的特征,低效率值的城市数量较多而高效率值的城市数量较少,说明黄河流域大部分地市仍依赖于资源要素的规模化投入,实现绿色转型发展具有关键性和紧迫性。由图3可知,GTFP的年均值表现为先上升再下降后波动上升的演变过程,其中2004—2012年为黄河流域GTFP的上升阶段,效率均值由2004年的0.510增长至2012年的0.635,增加了24.5%,2012—2015年为黄河流域GTFP的下降阶段,效率均值从2012年0.635减少为2015年0.555,减少了13.38%,2015年之后年均GTFP波动上升,2019年略有下降,反映了黄河流域绿色转型发展具有一定的艰巨性和复杂性。变异系数表现为先减少后波动增长的“W”型趋势,其中2004—2012年黄河流域GTFP的区域差异逐渐减小,变异系数由0.601下降至0.511,减少了17.61%,2012—2019年黄河流域GTFP的区域差异呈波动上升趋势,变异系数由0.511上升至0.578,增加13.31%,反映出黄河流域城市GTFP由“效率提高差距减小”向“效率降低差距增大”演进,俱乐部收敛特征不断凸显。
图2
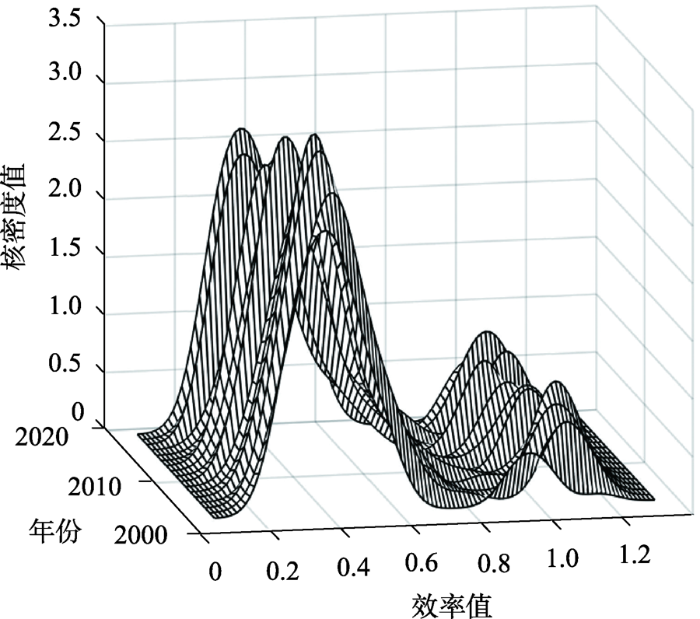
图3
4.4 黄河流域城市绿色全要素生产率(GTFP)发展的空间格局特征
根据四位数划分,将GTFP值划分为低效率(0~25.0%)、中低效率(25.1%~50.0%)、中高效率(50.1%~75.0%)、高效率(75.1%~100%)四种类型,构建马尔科夫概率演变矩阵并绘制类型演变空间分布图考察黄河流域GTFP的空间演进特征。
根据表2,黄河流域GTFP的类型转移演化存在以下特点:① 位于对角线上的概率数值普遍大于非对角线上的概率数值,且对角线两侧的的概率值大于非对角线两侧的概率值,表明黄河流域GTFP类别不变的几率大于发生转移的几率,具有增长惯性和路径依赖特征,相邻类型之间发生转移的概率较大,跨类型的转移概率较低。② 低效率、中低效率、中高效率、高效率地区对角线上元素概率均值分别为0.841、0.754、0.689和0.816,其中低效率区和高效率区保持不变的可能性最高,概率值分别为0.841和0.816,表明黄河流域GTFP存在高低各自集聚的“俱乐部趋同”情况,存在较强的内生演化特征,高效率区对低效率区正向溢出作用有限。③ 与GTFP的低效率区紧邻的城市,GTFP类型向下转移概率增大,与GTFP的高效率区邻近的城市,GTFP类型向上转移概率增大,例如当邻域为低效率时,2004—2012年和2012—2019年向下转移的概率均值分别为0.116和0.165,向上转移的概率均值分别为0.046和0.037,当邻域为高效率时,2004—2012年和2012—2019年向下转移的概率均值分别为0.028和0.048,向上转移的概率均值分别为0.047和0.201,表明黄河流域GTFP的发展受到邻近地区城市GTFP发展的影响。
表2 黄河流域GTFP马尔科夫概率演变矩阵
Tab. 2
| 相邻类型 | 本市类型 | 2004—2012年 | 2012—2019年 | 2004—2019年 | |||||||||||
|---|---|---|---|---|---|---|---|---|---|---|---|---|---|---|---|
| 1 | 2 | 3 | 4 | 1 | 2 | 3 | 4 | 1 | 2 | 3 | 4 | ||||
| 1 | 1 | 0.942 | 0.029 | 0.014 | 0.014 | 0.901 | 0.077 | 0.000 | 0.022 | 0.919 | 0.056 | 0.006 | 0.019 | ||
| 2 | 0.092 | 0.722 | 0.167 | 0.018 | 0.242 | 0.758 | 0.000 | 0.000 | 0.149 | 0.736 | 0.103 | 0.012 | |||
| 3 | 0.000 | 0.307 | 0.653 | 0.039 | 0.125 | 0.250 | 0.500 | 0.125 | 0.029 | 0.294 | 0.618 | 0.059 | |||
| 4 | 0.100 | 0.100 | 0.100 | 0.700 | 0.125 | 0.125 | 0.125 | 0.625 | 0.111 | 0.111 | 0.111 | 0.667 | |||
| 2 | 1 | 0.821 | 0.179 | 0.000 | 0.000 | 0.963 | 0.037 | 0.000 | 0.000 | 0.879 | 0.121 | 0.000 | 0.000 | ||
| 2 | 0.164 | 0.673 | 0.163 | 0.000 | 0.050 | 0.700 | 0.200 | 0.050 | 0.116 | 0.684 | 0.179 | 0.021 | |||
| 3 | 0.000 | 0.225 | 0.725 | 0.050 | 0.000 | 0.243 | 0.568 | 0.189 | 0.000 | 0.234 | 0.649 | 0.117 | |||
| 4 | 0.000 | 0.000 | 0.000 | 1.000 | 0.000 | 0.000 | 0.241 | 0.759 | 0.000 | 0.000 | 0.149 | 0.851 | |||
| 3 | 1 | 0.853 | 0.147 | 0.000 | 0.000 | 0.944 | 0.056 | 0.000 | 0.000 | 0.885 | 0.115 | 0.000 | 0.000 | ||
| 2 | 0.118 | 0.764 | 0.118 | 0.000 | 0.038 | 0.846 | 0.116 | 0.000 | 0.070 | 0.814 | 0.116 | 0.000 | |||
| 3 | 0.000 | 0.117 | 0.765 | 0.117 | 0.023 | 0.091 | 0.727 | 0.159 | 0.011 | 0.103 | 0.747 | 0.138 | |||
| 4 | 0.000 | 0.000 | 0.103 | 0.897 | 0.000 | 0.000 | 0.182 | 0.818 | 0.000 | 0.000 | 0.136 | 0.864 | |||
| 4 | 1 | 0.937 | 0.000 | 0.063 | 0.000 | 0.250 | 0.500 | 0.250 | 0.000 | 0.800 | 0.100 | 0.100 | 0.000 | ||
| 2 | 0.000 | 0.846 | 0.154 | 0.000 | 0.000 | 0.724 | 0.276 | 0.000 | 0.000 | 0.782 | 0.218 | 0.000 | |||
| 3 | 0.000 | 0.087 | 0.848 | 0.065 | 0.000 | 0.120 | 0.700 | 0.180 | 0.000 | 0.104 | 0.771 | 0.125 | |||
| 4 | 0.000 | 0.000 | 0.083 | 0.917 | 0.000 | 0.000 | 0.172 | 0.828 | 0.000 | 0.000 | 0.123 | 0.877 | |||
注:1为低效率;2为中低效率;3为中高效率;4为高效率。
根据图4,黄河流域GTFP的发展水平表现为“东西高、南北高、中部低”的空间格局特征,山东省的高效率区数量最多,其次为河南省、陕西省和甘肃省,山西省的高效率区数量最少,其中山东省位于全国东部沿海地区,近年来实施新旧动能转换、生态山东等战略,在政策和区位的双重优势驱动下,实现经济发展集约型模式的同时,通过先进的技术优势在资源能源利用效率和工业结构优化方面取得了较大的进步,促进了投入要素配置不断转型升级,GTFP显著高于流域内其他地区;而山西省独特的资源禀赋特征致使其产业结构偏重且单一,经济发展仍以“高产出、高污染、高耗能”的重工业为主,造成发展的不可持续性并降低环境效益,GTFP显著低于流域内其他地区。
图4
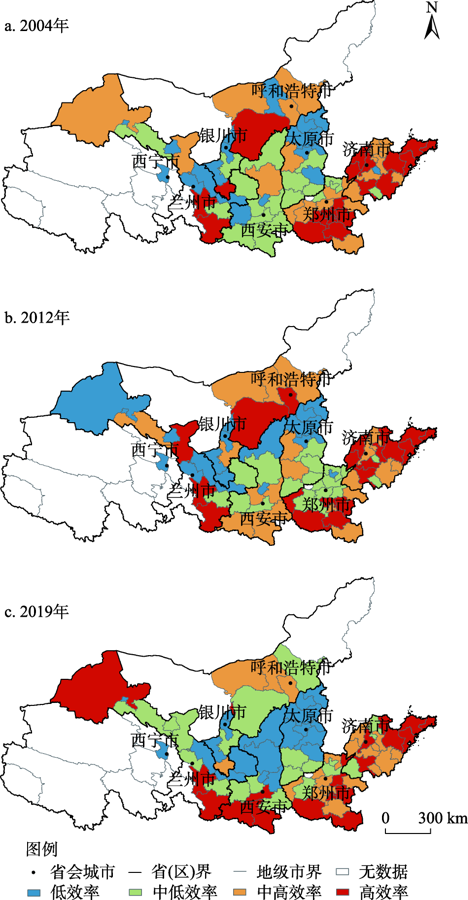
图4
2004—2019年黄河流域GTFP发展类型空间分布
Fig. 4
Spatial distribution of GTFP development types in the Yellow River Basin from 2004 to 2019
根据图5,在GTFP类型转移趋势方面,2004—2012年未发生转移的地级市有47个,占总地级市的59.5%,表现出相对稳定性特征,共有32个地级市发生了转移,占总地级市的40.5%,其中向上转移的地级市有18个,主要分布在黄河流域南部的渭南、商洛、安康等市,以及黄河流域西部的武威、张掖等市,这些地市人口稀少、生态环境基础较好,2004年后在国家中西部产业转移示范区政策推动下,经济社会发展水平显著提升;向下转移的地级市有14个,主要分布在黄河流域中部的延安、榆林、平顶山等市,以资源型城市为主,且位于城市群和都市圈的外围区域,受“虹吸效应”影响显著,工业结构转型升级动能有限,可能抑制了GTFP的发展。2012—2019年黄河流域GTFP发展类型保持不变的地级市有35个,占总地级市的44.3%,仍具有相对稳定性特征,但与2004—2012年相比,向上转移和向下转移的地级市分别增长至20个和24个,其中向下转移的地级市数量增幅较大,反映出黄河流域部分地区粗放式的发展模式未发生根本性改变,仍面临着资源与环境的约束,未来需进一步贯彻绿色可持续发展理念,增强环保意识并更新经营管理理念,引导产业生态化发展进程,推进GTFP越过拐点,进入高质量发展模式。
图5
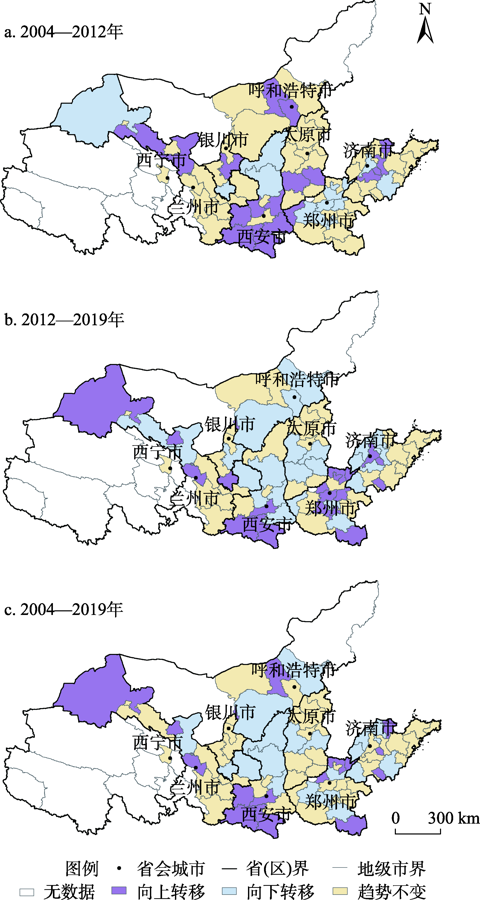
图5
2004—2019年黄河流域GTFP类型转移空间分布
Fig. 5
Spatial distribution of GTFP type shift in the Yellow River Basin from 2004 to 2019
5 生产性服务业集聚对黄河流域GTFP的影响
5.1 计量模型与变量说明
本文构建空间杜宾模型(SDM)研究生产性服务业集聚对GTFP空间溢出效应[55],模型设定如下:
式中:
式中:
模型的被解释变量为GTFP,核心解释变量充分考虑到集聚外部性视角下生产性服务业集聚对黄河流域GTFP的影响,并结合前文的理论分析,选取生产性服务业专业化集聚(Mar)和多样化集聚(Jac)为核心解释变量。依据国家统计局发布的《生产性服务业统计分类(2019)》并结合已有研究,选取信息传输、计算机服务和软件业,金融业,科学研究、技术服务与地质勘查业,租赁和商务服务业,交通运输、仓储与邮政业,批发和零售业作为生产性服务业的代表[56],计算公式为:
式中:
表3 模型主要变量
Tab. 3
| 变量类型 | 变量 | 符号 | 变量说明 |
|---|---|---|---|
| 被解释变量 | 城市绿色全要素生产率 | GTFP | |
| 核心解释变量 | Mar外部性 | Mar | 生产性服务业专业化集聚 |
| Jacobs外部性 | Jac | 生产性服务业多样化集聚 | |
| 政府干预程度 | gov | 财政支出占GDP的比例 | |
| 控制变量 | 人力资本水平 | hum | 每万人在校大学生人数 |
| 基础设施建设 | faci | 人均城市道路面积 | |
| 市场化水平 | mark | 私营和个体从业人员占从业人员比例 | |
| 信息化水平 | inf | 国际互联网用户数 |
5.2 空间自相关检验
表4结果显示两种矩阵下黄河流域GTFP的Moran's I值在0.086~0.380范围内,均通过了1%的显著性水平检验,反映出黄河流域GTFP具备明显的空间正相关性,呈现出“高高-低低”集聚特点,适合采用空间计量方法进行分析。
表4 黄河流域GTFP Moran's I指数结果
Tab. 4
| 年份 | 地理距离矩阵 | 经济距离矩阵 | |||
|---|---|---|---|---|---|
| Moran's I | P值 | Moran's I | P值 | ||
| 2005 | 0.112 | 0.000 | 0.282 | 0.000 | |
| 2007 | 0.112 | 0.000 | 0.302 | 0.000 | |
| 2009 | 0.134 | 0.000 | 0.380 | 0.000 | |
| 2011 | 0.101 | 0.000 | 0.312 | 0.000 | |
| 2013 | 0.077 | 0.000 | 0.229 | 0.000 | |
| 2015 | 0.111 | 0.000 | 0.310 | 0.000 | |
| 2017 | 0.137 | 0.000 | 0.367 | 0.000 | |
| 2019 | 0.086 | 0.000 | 0.236 | 0.000 | |
5.3 基准回归结果
表5 空间计量模型选择检验
Tab. 5
| 检验 | 地理距离矩阵 | 经济距离矩阵 |
|---|---|---|
| LM test no spatial lag | 26.580*** | 182.579*** |
| robust LM test no spatial lag | 7.807*** | 214.200*** |
| LM test no spatial error | 33.487*** | 64.067*** |
| robust LM test no spatial error | 14.713*** | 95.689*** |
| LR_Spatial lag | 7.07** | 31.67*** |
| LR_Spatial error | 8.13*** | 32.53*** |
| Wald_Spatial lag | 7.05*** | 30.28*** |
| Wald_Spatial error | 7.96*** | 32.64*** |
| Hausman检验 | 9.72*** | 10.23*** |
注:**表示P<0.05,***表示P<0.01。
表6 基准回归结果
Tab. 6
| 变量 | OLS | SAR | SEM | SDM | SAR | SEM | SDM |
|---|---|---|---|---|---|---|---|
| 地理距离矩阵 | 经济距离矩阵 | ||||||
| lnMar | 0.1068*** | 0.1073*** | 0.1065*** | 0.1106*** | 0.1098*** | 0.1036*** | 0.1142*** |
| (3.35) | (3.43) | (3.39) | (3.51) | (3.50) | (3.29) | (3.67) | |
| lnJac | 0.0404*** | 0.0382*** | 0.0377*** | 0.0357*** | 0.0376*** | 0.0362*** | 0.0369*** |
| (3.13) | (3.02) | (2.91) | (2.71) | (2.97) | (2.81) | (2.85) | |
| 控制变量 | 是 | 是 | 是 | 是 | 是 | 是 | 是 |
| w×lnMar | -0.0704 | 0.1648* | |||||
| (-0.27) | (1.77) | ||||||
| w×lnJac | 0.0514 | 0.0588** | |||||
| (0.73) | (2.31) | ||||||
| _cons | -1.4928*** | -0.8859*** | -2.0405*** | -1.0682*** | -1.3685*** | -2.2288*** | |
| (-9.40) | (-4.73) | (-3.39) | (-6.02) | (-8.00) | (-5.92) | ||
| 0.5061*** | 0.4170*** | 0.2507*** | 0.2357*** | ||||
| (5.99) | (4.28) | (5.15) | (4.68) | ||||
| 0.4521*** | 0.1988*** | ||||||
| (4.90) | (3.76) | ||||||
| LogL | -341.072 | -345.614 | -335.659 | -342.829 | -348.582 | -327.873 | |
| N | 1264 | 1264 | 1264 | 1264 | 1264 | 1264 | 1264 |
| R2 | 0.132 | 0.231 | 0.189 | 0.337 | 0.268 | 0.204 | 0.265 |
注:*表示P<0.10,**表示P<0.05,***表示P<0.01。
在地理和经济距离两种空间权重矩阵下,各模型的空间系数ρ和λ均通过了显著检验,反映出黄河流域GTFP具有显著的正向空间相关性,GTFP的提升相对依赖于具备相同空间分布特征的城市的GTFP提升。空间回归系数ρ虽然显著为正,但数值较小,溢出效应有限,反映出GTFP的空间溢出具有时滞性和衰减性。生产性服务业的专业化和多样化集聚的回归系数均显著为正,说明二者均能够有效促进黄河流域GTFP提升,其中生产性服务业专业化集聚通过促进相关企业间的交流互动,有助于交流示范效应与竞争合作效应的发挥,减少交易与信息搜索等中间环节的成本,推动知识以及技术手段在相关行业内的溢出,还可以通过交通、人才、政策等要素的共享,降低制造业企业的生产费用并减少资源浪费的情况,更高效地利用土地和劳动力资源,减少了资源环境投入,从而提高GTFP;而生产性服务业的多样化集聚有助于形成网络化产业格局,并推动知识技术交流和商业技术合作,促进了不同类型产业间的融合发展,进而对GTFP的提升发挥了积极作用。
进一步根据偏微分方程对不同矩阵下的模型结果进行分解(表7),生产性服务业专业化集聚的直接效应显著为正,说明专业化集聚有助于形成生产环节专业化,促使生产行业发挥竞争优势,进而促进GTFP提高;其间接效应显著为正反映出生产性服务业专业化集聚可以通过规模经济、竞争效应、人力资本共享等途径推动知识、技术手段和信息在行业内和城市间的共享和扩散,进而对邻近城市产生提升作用。生产性服务业多样化集聚的直接效应和间接效应的回归结果表明生产性服务业多样化集聚有助于本地和邻地GTFP的提升,可能是因为生产性服务业多样化发展能够为区域产业发展提供多样化的生产服务环境,减少了工业企业的生产成本和搜寻成本,促进行业间异质性知识的传播,推动区域生产效率提高和产业升级。此外,生产性服务业专业化集聚的直接效应和间接效应的回归系数值均大于多样化集聚,可能是因为制造业在黄河流域的发展中仍占据主导地位,而黄河流域生产性服务业的发展若未实现同本地的产业发展、城市规模及工业化水平匹配,片面发展多样化的生产性服务业可能会导致资源浪费和要素扭曲,在一定程度上将抑制生产性服务业多样化集聚效应的发挥。
表7 直接效应和间接效应
Tab. 7
| 变量 | 地理距离矩阵 | 经济距离矩阵 | ||||
|---|---|---|---|---|---|---|
| 直接效应 | 间接效应 | 总效应 | 直接效应 | 间接效应 | 总效应 | |
| lnMar | 0.1083*** | 0.0305** | 0.1387*** | 0.1200*** | 0.2571** | 0.3771*** |
| (3.42) | (2.13) | (2.59) | (3.73) | (2.15) | (2.94) | |
| lnJac | 0.0354*** | 0.2921*** | 0.3275*** | 0.0375*** | 0.0887*** | 0.1262*** |
| (2.83) | (3.08) | (3.49) | (3.05) | (2.75) | (3.63) | |
| lnopen | 0.0289** | 0.0202 | 0.0491 | 0.0347*** | 0.0312 | 0.0659* |
| (2.04) | (0.14) | (0.32) | (2.79) | (0.84) | (1.70) | |
| lnhum | -0.0468 | -0.0006 | -0.0474 | -0.0358 | 0.322*** | 0.2857*** |
| (-1.59) | (-0.00) | (-0.19) | (-1.43) | (3.30) | (2.71) | |
| lnfaci | -0.0143 | 0.2042 | 0.1899 | -0.0239 | 0.0222 | -0.0017 |
| (-0.68) | (1.58) | (1.51) | (-1.16) | (0.39) | (-0.03) | |
| lnmark | 0.0267 | -0.3057* | -0.2791 | 0.0317* | -0.0946 | -0.0629 |
| (1.41) | (-1.77) | (-1.58) | (1.65) | (-1.44) | (-0.92) | |
| lninf | 0.0118 | 0.186 | 0.1975 | -0.0009 | -0.1284** | -0.1285** |
| (0.57) | (1.42) | (1.51) | (-0.00) | (-2.01) | (-1.99) | |
注:*表示P<0.10,**表示P<0.05,***表示P<0.01。
5.4 空间边界分析
虽然信息通讯技术的发展促进了城市间企业的交流,但生产性服务业集聚为相关制造业所提供的服务依然存在距离成本,随着空间距离增加,制造业企业获取相关服务的边际成本将递增,从而导致空间溢出效应存在地理边界。为了保证每个城市均存在一个地理邻接的城市,设定300 km为空间权重矩阵的初始距离阈值,每期递增100 km,至1000 km范围结束,并记录间接效应系数,探究空间溢出的地理边界(表8)。根据表8,两种生产性服务业集聚的空间溢出效应的地理边界均呈现出距离衰减趋势,其中生产性服务业专业化集聚的间接效应系数在300~400 km范围内为正值,400 km范围之外的回归系数不显著,而生产性服务业多样化集聚的间接效应系数在300~400 km,600~700 km范围内显著为正,超过700 km范围后间接效应系数不再显著。由此可以发现,本地生产性服务企业主要为本地企业提供相关服务,对邻近区域的影响存在距离障碍。此外,相关企业对本地市场情况较为了解,而提供跨区域的服务可能出现信息不对称等问题,也增加了搜寻成本和交易成本,从而导致企业经营面临风险,因此生产性服务业集聚的空间溢出范围具有地理边界。不同于生产性服务业专业化集聚,生产性服务业多样化集聚的空间溢出边界更远,可能是因为生产性服务业专业化集聚以单一和同类服务为主,因此存在服务半径较小、结构较单一的特点,从而限制了空间溢出的地理距离,而生产性服务业多样化的发展模式以不同类型的生产性服务企业协同发展为主,具有服务半径大、结构多元化的特点,因此服务范围相对较广。
表8 空间溢出边界
Tab. 8
| W300 | W400 | W500 | W600 | W700 | W800 | W900 | W1000 | |
|---|---|---|---|---|---|---|---|---|
| lnMar | 0.0251*** | 0.0241** | -0.0110 | -0.0075 | 0.0293* | 0.0121 | 0.0174 | -0.0947*** |
| (3.66) | (2.14) | (-0.79) | (-0.42) | (1.71) | (0.62) | (0.89) | (-4.11) | |
| lnJac | 0.0117** | 0.0188*** | 0.0068 | 0.0187** | 0.0167** | -0.0027 | 0.0031 | -0.0015 |
| (2.42) | (3.03) | (1.12) | (2.27) | (2.24) | (-0.29) | (0.40) | (-0.17) | |
| 控制变量 | 是 | 是 | 是 | 是 | 是 | 是 | 是 | 是 |
注:*表示P<0.10,**表示P<0.05,***表示P<0.01。
5.5 不同类型生产性服务业集聚的空间溢出效应
考虑到生产性服务业各细分行业的产业特征存在明显的差异,不同类型的行业集聚对GTFP可能产生差异性影响。在依据相关研究的基础上[2],将“信息传输、软件和信息技术服务业”“金融业”与“科学研究和技术服务业”划分为高端生产性服务业,将“批发和零售业”“交通运输、仓储和邮政业”与“租赁和商务服务业”划分为低端生产性服务业,实证分析不同行业类型的空间溢出效应(表9)。根据表9,高端生产性服务业专业化集聚和多样化集聚的间接效应均显著为正,直接效应不显著,可能与该行业的行业特征有关,金融业和技术服务业等行业具有知识技术密集度高、附加值较高、路径依赖作用程度低、辐射带动能力强的特点,专业化集聚和多样化集聚均有助于促进城市间GTFP的发展。低端生产性服务业专业化集聚的直接效应显著为正,原因在于黄河流域仍处于工业化加速发展阶段,低端生产性服务业实现专业化发展有助于地区生产要素汇集并加强供给能力,扩大竞争优势并提高生产效率。低端生产性服务业多样化集聚的直接效应和间接效应均不显著,原因可能是低端生产性服务业以劳动密集型为主,缺乏较强的创新能力和技术水平,对邻近地区的吸引力相对较弱,导致其服务范围相对狭窄,多样化水平提高可能增加生产成本和交易成本,不利于生产性服务业空间溢出效应的发挥。
表9 不同类型生产性服务业集聚的溢出效应
Tab. 9
| 变量 | 地理距离矩阵 | 经济距离矩阵 | |||||
|---|---|---|---|---|---|---|---|
| 直接效应 | 间接效应 | 总效应 | 直接效应 | 间接效应 | 总效应 | ||
| 高端生产性服务业 | lnMar | -0.0327 | 0.0933*** | 0.0606 | 0.0808*** | -0.3156 | -0.2348 |
| (-0.13) | (2.64) | (0.24) | (2.87) | (-1.09) | (-0.80) | ||
| lnJac | -0.0128 | 0.0444*** | 0.0316 | 0.0365* | -0.3354 | -0.2988 | |
| (-0.59) | (3.21) | (0.87) | (1.67) | (-1.36) | (-1.19) | ||
| 控制变量 | 是 | 是 | 是 | 是 | 是 | 是 | |
| 低端生产性服务业 | lnMar | 0.0933 | 0.0979*** | 0.1912* | 0.0905*** | 0.1086 | 0.1992* |
| (0.90) | (2.77) | (1.78) | (3.25) | (1.12) | (1.91) | ||
| lnJac | 0.0027 | 0.0097*** | 0.0124 | 0.0492** | -0.0018 | 0.0474 | |
| (0.04) | (2.45) | (1.10) | (2.27) | (-0.02) | (0.57) | ||
| 控制变量 | 是 | 是 | 是 | 是 | 是 | 是 | |
注:*表示P<0.10,**表示P<0.05,***表示P<0.01。
6 结论与讨论
6.1 主要结论
研究在理论分析生产性服务业影响GTFP的基础上,以2004—2019年黄河流域城市面板数据作为研究样本,分析黄河流域GTFP的时空格局特征,构建面板SDM模型实证检验生产性服务业集聚对GTFP的影响及空间溢出效应,主要得出以下结论:
(3)生产性服务业专业化集聚和多样化集聚具有显著的空间溢出效应,且空间溢出存在衰减边界,由于服务半径和服务结构存在差异,导致多样化集聚的空间溢出范围大于专业化集聚。低端生产性服务业专业化集聚更有利于促进本地的GTFP的提升,而高端生产性服务业多样化集聚对邻近城市的溢出效应更为明显,这与国内部分学者关于全国、长江经济带的研究存在一定的差异[27,62],相关研究认为生产性服务业专业化集聚或多样化集聚存在显著的空间溢出效应,而本文的实证研究表明生产性服务业专业化集聚和多样化集聚均存在显著的空间溢出效应,表明黄河流域生产性服务业集聚的空间溢出边际效应较强,通过发挥生产性服务业对区域产业高质量发展的助推作用,促进黄河流域产业发展与生态环境的良性互动。
6.2 政策启示与讨论
本研究从空间溢出效应视角研究生产性服务业集聚对黄河流域GTFP的影响,既是对产业集聚影响TFP研究的有益补充,也是探讨黄河流域高质量发展影响因素的实证检验,为黄河流域通过生产性服务业集聚提高经济发展质量提供参考。政策建议为:
(1)促进生产性服务业与制造业良性互动,推动制造业高端化、服务化、绿色化、数字化转型。一方面,基于以政府为主导,产业为主体的信息交流平台,通过信息收集、信息分析、信息输出等形式,及时传递产业间所需信息,指导产业间良性互动与信息共享,从而提高生产效率;另一方面,通过整合市场资源,提高市场监管效率,维护公平竞争的市场秩序,降低产业发展中的交易成本,激发企业的创新活力,改善生产性服务质量,实现产业协同发展。并以产业协同发展为支撑,优化调整产业结构,积极培育以信息、大数据、人工智能为核心要素的信息服务产业,促进产业数字化、服务化转型,吸引技术、资本、人才流入,以新兴技术工艺改造煤炭、钢铁、化工、冶炼等传统工业,推动制造业生产过程的低碳化、循环化、高端化、智能化。
(2)立足于区域资源禀赋、产业基础等情况,分类制定实施相关产业政策。通过制定和完善有利于黄河流域生产性服务业人才引进、资金支持等方面的政策,加快流域内各城市群建设产业融合发展平台。上游地区依托当地的资源优势,围绕水电、光伏、风能、养殖、乳制品等行业发展相匹配的服务行业;中游地区优化产业体系,推广能源管理新机制,引导煤炭开采、石油化工、金属冶炼等行业向绿色、技术、智能化方向转变,实现产业生态化和生态产业化紧密连接;下游地区依托交通区位优势和产业体系优势,加快提高电子信息、智能制造、生物医药、新能源新材料等行业在产业体系中所占比例,同时积极发展数字金融、软件和信息服务、高端物流、IT资讯等高端生产性服务业,打造现代化的产业园区。
(3)打破制约生产要素流动的制度障碍,提高生产性服务业空间溢出边界。实证结果表明,生产性服务业集聚的空间溢出效应具有一定的距离限制,应加强交通等基础设施的互联互通,促进商品与要素的市场实现一体化,优化资源要素的空间流动机制,整合科技与人才资源,加强交流与合作,充分借鉴国内外先进模式与经验。优化流域内生产力格局,加大对济南、郑州、西安等区域中心城市在数字信息、智能制造等领域发展的支持力度,有效发挥各中心城市对周边区域的带动作用,促进公共服务等相关发展成果普惠共享。此外,还需进一步打造高水平的对外开放平台,依托交通基础设施条件,建设区域经济走廊,扩大区域内协调分工范围。
然而,由于数据可获取性的限制,在研究中也存在一定的不足,一是以生产性服务业六大门类行业的数据表征生产性服务业,未能从细分行业角度精细划分生产性服务业;二是本研究基于城市产业就业人数数据来测算生产性服务业集聚水平,未能收集到生产性服务业微观企业数据,从微观企业空间分布特征的角度研究区域生产性服务业的空间集聚格局。因此,在未来的研究中,将进一步关注生产性服务业所包含的细分类别,并基于微观企业数据分析生产性服务业集聚的空间格局特征,及其经济和环境效应。
致谢
诚挚感谢匿名评审专家在论文评审中所付出的时间和精力,专家对本文文献综述、研究结论探讨、实证结果分析等方面的修改意见,使本文受益匪浅。
参考文献
黄河流域高质量发展分区分级分类调控策略研究
Regulation strategy of zoning-gradation-classification for high-quality development in the Yellow River Basin
产业集聚专业化、多样化与绿色全要素生产率: 基于生产性服务业集聚的外部性视角
Industrial agglomeration specialization, diversification and green total factor energy productivity: Externality perspective based on agglomeration of producer services
高质量发展背景下黄河流域中下游绿色生产率时空分异研究
Spatial-temporal differention of green productivity in the middle and lower reaches of the Yellower Basin under the background of high-quality development
黄河流域高质量发展: 人地协调与空间协调
High-quality development of the Yellow River Basin from a perspective of economic geography: Man-land and spatial coordination
黄河流域城市群形成发育的空间组织格局与高质量发展
Spatial organization pattern and high-quality development of urban agglomeration in the Yellow River Basin
黄河流域的综合治理与可持续发展
DOI:10.11821/dlxb201912001
[本文引用: 1]

黄河流域与黄河所经地区在国家发展中具有极为重要的战略地位。2019年9月习近平总书记在郑州主持召开黄河流域生态保护和高质量发展座谈会上发表了重要讲话,具有重大战略意义。本文对黄河流域的综合治理与可持续发展形成了初步认识,指出新时代黄河流域全面深刻转型发展的任务仍然艰巨,需转变理念,持续推进能源清洁高效利用,因地制宜重点推进产业发展,不搞粗放式大开发,搞好资源耕地保护等方面应是推进黄河流域综合治理及保障可持续发展的重要举措,认为“黄河经济带”在全国经济层面上不存在,目前不适宜将“黄河三角洲”确定为国家战略。
Development and management tasks of the Yellow River Basin: A preliminary understanding and suggestion
The Yellow River Basin and the areas along the Yellow River play an important strategic role in national development. Xi Jinping, General Secretary of the CPC, delivered an important speech at the symposium on ecological protection and high-quality development of the Yellow River Basin in Zhengzhou, which is of great strategic significance. This paper gives a preliminary understanding of the comprehensive governance and the sustainable development of the Yellow River Basin. It points out that the task of the comprehensive and profound transformation and development of the Yellow River Basin in the new era is still arduous, and change of concept is required. Continuing to promote the clean and efficient use of energy, promoting industrial development in accordance with local conditions, preventing extensive development and protecting cultivated land resources should be regarded as important measures to strengthen the comprehensive management and guarantee the sustainable development of the Yellow River Basin. It is believed that the "Yellow River Economic Belt" does not exist at the national economic level, and it is not appropriate to identify "the Yellow River Delta" as a national strategy.
黄河流域产业发展对生态环境的胁迫诊断与优化路径识别
DOI:10.18402/resci.2020.01.13
[本文引用: 1]
黄河流域是中国区域发展战略格局的重要支撑区以及国土生态安全的关键区域,也是国家重要的能源安全支撑区和粮食安全基地。但受区位条件、自然地理环境和资源禀赋等因素影响,该地区经济基础相对薄弱,以能源重化工为主的单一化产业体系加重了地区生态环境负担。本文在辨析黄河流域生态保护与高质量发展主要限制因素的基础上,分析了地区产业发展对生态环境本底、大气环境、水资源与水环境、生态功能的胁迫特征,总结了地区产业发展与生态环境保护的主要矛盾及需要把握的关系;提出实现黄河流域生态保护与高质量发展目标,必须处理好产业开发布局与流域生态环境安全格局稳定、重点区域产业发展与资源环境承载能力、重点突破与系统统筹的关系。为此,建议该地区应优化产业发展路径,积极推进以绿色循环为核心的新型工业化,提升产业发展层次;以地区资源环境约束促进能源基础原材料产业规模控制和效率提升;以资源环境承载力为基础优化产业空间布局,确定适宜的产业发展空间和生态保护红线,推进重点能源化工基地建设和城市群产业集聚区建设;加强能矿资源开发的生态空间管控与生态修复,实施一批区域性生态环境治理和修复工程。
Environmental stress and optimized path of industrial development in the Yellow River Basin
The Yellow River Basin is a key area for China’s regional development strategy and national ecological security. However, affected by the location, physical environment, and resource endowments, the economic foundation of the region is relatively weak. It has formed an industrial system dominated by energy and heavy chemical industries, which greatly increased the regional ecological burden. The Yellow River Basin is facing the predicaments of weak economic foundation and weak development ability, the pressures of accelerating social and economic development and transformation of development mode, the contradictions between resource use and ecological protection and between industrial development and environmental carrying capacity, and the challenges of deteriorating local living environment. The core contents of ecological environment protection and high-quality development of the Yellow River Basin is to balance the relationship between resource use and environmental protection, the scale of development and the carrying capacity of resources and the environment, and the development of key areas and the protection of the total ecological security to ensure energy security, ecological security, food security, watershed security, and the health of human settlements. We suggest that the region should optimize the industrial development path, actively promote the new industrialization with green industrial development as its core, and improve the level of industrial development and resource and environmental efficiency; optimize the industrial space based on the resource and environmental carrying capacity, determine suitable industrial development space and ecological protection red line, promote the construction of key energy and chemical bases and the construction of industrial clusters in urban agglomerations, implement strict environmental access policies, and improve environmental control standards for industrial development; strengthen spatial control and ecological restoration of energy and mining development projects, and implement a series of regional ecological environment governance and restoration projects.
黄河流域城市群与产业转型发展
Urban agglomeration and industrial transformation and development in the Yellow River Basin
Ecological protection and high-quality development of the Yellow River Basin is one of the major national strategies, in which urban agglomeration and industrial transformation development are the intrinsic requirements and fundamental guarantees. Thus, revealing the path of the river basin scale urban agglomeration development and industrial transformation and upgrading is of great significance to guide the high-quality development of the Yellow River Basin. Therefore, this paper brings together scholars from the Institute of Geographic Sciences and Natural Resources Research, Chinese Academy of Sciences, Research Institute for Eco-civilization, Chinese Academy of Social Sciences, Yellow River Institute of Hydraulic Research, Capital University of Economics and Business, Peking University and Henan University, to discuss key issues on urban agglomeration and industrial transformation development in the Yellow River Basin from the perspectives of ecological protection, resource allocation, dynamic evolution, spatial structure, and integration and regulation. This paper aims to serve the major national stragety of ecological protection and high-quality development of the Yellow River Basin. The core views are as follows, regulating the relationship among water resources, urban agglomeration and industrial development is the key to promoting the coordination of industrial transformation and urban transformation, and the synchronized advances of economic transformation and social transformation;the analysis of the complex coupling and dynamic evolution mechanism of river basin ecological protection and high-quality development is of great significance for achieving high-quality development of the basin; it is an effective way to promote the high-quality development of the basin to reveal the evolution mechanism of typical urban agglomeration and industrial space and to construct the spatial integration target and mode of urban agglomeration and industrial transformation development; under the background of increasing uncertainty of trade caused by globalization and energy revolution, complex relationship between social economy and ecological environment, and the construction of a new development pattern of "dual circulation", the basin urgently needs a more comprehensive integrated regulation mechanism.
黄河流域高质量发展的基本条件与核心策略
DOI:10.18402/resci.2020.03.01
[本文引用: 2]
黄河流域整体处于工业化中期到后期的转型发展和区域经济的起飞发展阶段,大体处于集聚功能大于扩散效应的“虹吸效应”阶段和区内发展的激烈竞争时期。高质量的中/高速经济增长是黄河流域现代化进程和可持续发展的前提。在大致梳理流域(区域)高质量发展的内涵及其理论演变的基础上,本文探讨了黄河流域高质量发展的基本条件及其核心策略。域内高质量发展的基本条件表现为农业发展的多样性和脆弱性,流域经济联系的松散性,经济发展阶段性及其内部差异性的约束,外部投资和产业转移等动力不足的约束等。这决定了流域高质量发展必表现为长期性、多样性、竞争性、协同性甚至区域化的倾向。因此,黄河流域高质量发展需探索“弯道超车”的核心策略:①在智能社会和全球化浪潮中,谋高质量增长,即持续探寻域内适合国家需求和地方特色的新型产业转型发展模式,建构适合各地方的特色化产业集群/产业链,提升综合竞争力;②探寻同质前提下的协同新模式,谋划流域协同和寻求特色化的新型城镇化模式,包括适合各地的人口城镇化策略和城乡统筹模式,尤其是基于土地流转的乡村人口向河谷/川地/盆地、平原、城镇的持续迁移路径,提高劳动生产率,关注水资源和基础设施建设等问题;③实施“中心突破”的体制,寻求中心带动的流域空间重构,推动中心城市和城镇群的健康发展,促进高质量发展。黄河流域高质量发展是一个至少20~30年的长期探索过程。
Basic conditions and core strategies of high-quality development in the Yellow River Basin
The Yellow River Basin as a whole is in the mid- to late stage of industrial transformation and the rapid development stage of the regional economy. It is in general in the “siphon effect” stage where the agglomeration function is stronger than the diffusion effect, and in the period of intense competition in intraregional development. Medium/high-speed economic growth of high-quality is a prerequisite for the modernization and sustainable development of the Yellow River Basin. Based on a general analysis of the connotation and change of theories of high-quality development in the basin (region), this article explores the basic conditions and core strategies of high-quality development in the Yellow River Basin. The basic conditions of high-quality development are the local diversity and vulnerability of agricultural development, the loose nature of the economic links in the river basin, constraints from the stage of economic development and its internal differences, and lack of momentum of external investment and industrial transfer, among others. These particularities determine that the high-quality development of the river basin must manifest itself in a long-term, diverse, competitive, cooperative, and regional orientation. Therefore, the high-quality development of the Yellow River Basin needs to explore a core strategy of “overtaking by curves”: (1) With the development of smart society and globalization, the region should seek high-quality growth, that is, continue to explore new industrialization models in the region that are suitable for national needs and local characteristics, and build localized industrial clusters/chain to enhance comprehensive competitiveness; (2) Explore new models of synergy under the premise of homogeneity, plan river basin coordination and improve coordination mechanisms, and seek a new urbanization model of localization, including localized population urbanization strategy and urban-rural coordination model, especially the continued migration of rural population to river valleys/basins, plains, and towns based on land transfer. Improve labor productivity, paying attention to water resources and infrastructure construction, and so on; (3) Implement the “center breakthrough” system, seek the spatial reconstruction of the drainage basin led by the centers, promote the healthy development of central cities and urban agglomerations, and promote high-quality development. In general, the high-quality development of the Yellow River Basin is a long-term exploration process of at least 20-30 years.
Can industrial agglomeration promote pollution agglomeration? Evidence from China
Does industrial agglomeration facilitate environmental performance: New evidence from urban China?
生产性服务业集聚与区域创新效率的空间效应研究
Research on the spatial effect of producer services agglomeration and regional innovation efficiency
Industrial agglomeration, urban characteristics, and economic growth quality: The case of knowledge-intensive business services
生产性服务业资源配置与制造业产能过剩治理: 机制与检验
Resource allocation of producer services and governance of overcapacity in manufacturing industry: Mechanism and test
Structural change, modernization, total factor productivity, and natural resources sustainability: An assessment with quantile and non-quantile estimators
生产性服务业集聚能否助推黄河流域城市高质量发展?
Can the agglomeration of producer services contribute to the high-quality development of cities in the Yellow River Basin?
The effects of agglomeration externalities on urban green total-factor productivity in China
Development of an SBM-ML model for the measurement of green total factor productivity: The case of pearl river delta urban agglomeration
The impact and mechanisms of the Shanghai pilot free-trade zone on the green total factor productivity of the Yangtze River Delta urban agglomeration
Measuring green total factor productivity of China's agricultural sector: A three-stage SBM-DEA model with non-point source pollution and CO2 emissions
产业转型升级与绿色全要素生产率提升的互动关系: 基于中国116个地级资源型城市的实证研究
DOI:10.31497/zrzyxb.20220113
[本文引用: 2]
促进产业转型升级,提升绿色全要素生产率是推进我国资源型城市高质量发展的关键。但是,产业转型升级能否提升绿色全要素生产率在学术界一直存在争论。以2003— 2018年中国116个地级资源型城市为对象,分析了产业转型升级与绿色全要素生产率提升的演化特征和互动关系。结果表明:(1)56.9%的资源型城市产业转型升级并不理想,处于产业结构高级化和合理化不同步或双低的状态;有57.8%的资源型城市绿色全要素生产率实现了正增长,但仍有一些资源型城市绿色全要素生产率增长缓慢,主要是因为技术效率未得到有效改善。(2)PVAR模型和脉冲响应估计结果表明,资源型城市绿色全要素生产率提升的滞后期对其自身的影响存在负向作用。同时,资源型城市长期的传导路径为绿色全要素生产率提升受到反映产业结构合理化的泰尔指数的负向冲击后,对产业结构高级化产生持续性的积极作用,之后,产业结构高级化不断对自身产生正向冲击作用。(3)通过方差分解预测可知,未来绿色全要素生产率提升、产业结构高级化与合理化仍主要依赖自身发展路径。产业结构高级化对绿色全要素生产率提升的解释力高于产业结构合理化的解释力。随着期数的增加,产业结构高级化与绿色全要素生产率提升的相互解释力逐渐上升。
Interaction mechanism between industrial transformation and upgrading and green total factor productivity improvement: An empirical study based on 116 China's prefecture-level resource-based cities
Advancing industrial transformation and upgrading and improving green total factor productivity are the key to promoting the high-quality development of resource-based cities in China. However, whether industrial transformation and upgrading can improve green total factor productivity has been controversial in academic circles. Focusing on 116 prefecture-level resource-based cities in China from 2003 to 2018, this paper analyzes the evolutionary characteristics and interactive relationship between industrial transformation and upgrading and green total factor productivity improvement. The results are as follows: (1) 56.9% of resource-based cities have implemented unsatisfactory industrial transformation and upgrading, and are in unbalanced state or double-low state between advanced and industrial structure rationalizations; 57.8% of resource-based cities have achieved positive growth in green total factor productivity, but the average annual growth rates of green total factor productivity in some resource-based cities increased slowly due to unimproved technological inefficiency. (2) The estimation results of PVAR model and impulse response show that there exists a time lag in the negative impact of green total factor productivity improvement on itself. At the same time, the long-term impact transmission mechanism is that after receiving the negative impact from the Theil index, an indicator to reflect industrial structure rationalization, the green total factor productivity improvement has a continuous positive effect on the industrial structure advancement. Then industrial structure advancement continuously imposes a positive effect on itself. (3) According to the analysis of variance decomposition forecast, green total factor productivity improvement, as well as industrial structure advancement and rationalization are mainly dependent on their own development paths. It can be seen that the explanatory power of the industrial structure advancement for green total factor productivity improvement is higher than that of the industrial structure rationalization. With the increase of periods, the mutual explanatory powers of both industrial structure advancement and green total factor productivity improvement gradually increase.
The impact of the spatial agglomeration of foreign direct investment on green total factor productivity of Chinese cities
生产性服务业能成为中国经济高质量增长新动能吗?
Can the productive service industry become new momentum for China's economic growth China industrial economics?
Spatial spillover effect of producer services agglomeration on green economic efficiency: empirical research based on spatial econometric model
How does ICT agglomeration affect carbon emissions? The case of Yangtze River Delta urban agglomeration in China
生产性服务业集聚空间效应与城市技术创新: 基于长江经济带108个城市面板数据的实证分析
Spatial effect of producer services agglomeration and urban technological innovation: Empirical analysis based on panel data of 108 cities in the Yangtze River Economic Belt
Land finance, producer services agglomeration, and green total factor productivity
This study explores the effect of land finance (LF) and producer services on green total factor productivity (GTFP) according to spatial and agglomeration economic theories. Then, based on the spatial Durbin model, we employ panel data of 283 Chinese cities at the prefecture level and above from 2003 to 2015 to estimate the effect of LF and producer services agglomeration on GTFP. We find that specialized agglomeration of producer services promotes the GTFP of the city and its neighboring cities. While diversified agglomeration is advantageous to the GTFP in the city, it significantly reduces in neighboring cities. LF not only improves the GTFP of the city and neighboring cities but also weakens the promotion effect of the specialized agglomeration of producer services on the GTFP of the city and surrounding cities. Furthermore, we find that there exists industry and regional heterogeneities of the effect.
Does the agglomeration of producer services and the market entry of enterprises promote carbon reduction? An empirical analysis of the Yangtze River Economic Belt
As the world’s largest carbon emitter, China has been committed to carbon emission reduction and green development. Under the goal of “double carbon”, adjusting the industrial structure and promoting the development of producer services are regarded as effective emission reduction paths. In this paper, from the perspective of market entry of enterprises, we firstly investigate the transmission mechanism between market entry of enterprises and industrial agglomeration and summarize the carbon emission reduction mechanism of producer services. Based on the panel data of 110 prefecture-level cities in China’s Yangtze River Economic Belt (YREB) from 2003 to 2017, we analyze the impact of producer services on carbon emission reduction by using the dynamic spatial panel model. The empirical results show that China’s urban carbon dioxide emissions have noticeable spatial spillover effects and high emission club clustering characteristics and exhibit a noticeable snowball effect and leakage effect in time and space dimensions. The development of the producer services can effectively reduce carbon emission levels, effectively solving the dilemma of “stabilizing growth and promoting emission reduction”. Furthermore, there is an apparent synergistic effect between enterprises’ market entry and industrial agglomeration. The agglomeration of producer services can effectively promote the entry of innovative new enterprises, thus increasing the carbon emission reduction effect. However, due to resource mismatch and isomorphic development, this carbon emission reduction effect has apparent industrial heterogeneity and regional heterogeneity. Finally, this paper makes suggestions for optimizing regional industrial structure, strengthening inter-regional linkage cooperation, and promoting the advanced development of the producer services.
Exploring the effect of producer services agglomeration on China's energy efficiency under environmental constraints
生产性服务业集聚降低碳排放了吗? 对我国地级及以上城市面板数据的空间计量分析
Does the agglomeration of producer services reduce carbon emissions? Spatial econometric analysis of panel data of prefecture-level and above cities in China
Spatial effects of industrial synergistic agglomeration and regional green development efficiency: Evidence from China
长江经济带生产性服务业集聚的创新效应研究
Research on the innovation effect of producer services agglomeration in the Yangtze River Economic Belt
生产性服务业集聚对绿色全要素生产率的空间溢出效应
The spatial spillover effect of producer services agglomeration on green total factor productivity
生产性服务业集聚、城市规模与经济绩效提升: 基于空间计量的实证研究
Producer services agglomeration, city size and urban economic performance: An empirical research based on spatial econometrics
黄河流域服务业高质量发展探析
FDI、环境规制与黄河流域城市绿色全要素生产率
Foreign direct investment, environmental regulation and urban green total factor productivity of the Yellow River Basin
服务业集聚对黄河流域城市绿色经济效率的影响研究
The economic efficiency of the service of the Yellow River city green impact study
黄河流域产业集聚与经济增长: 格局、特征与路径
Industrial agglomeration and economic growth in the Yellow River Basin: Pattern, characteristics and path
传统农区工业企业地理集聚及其用地空间响应: 以河南省曲沟镇铁合金产业为例
Geographical agglomeration of industrial enterprises and spatial response of land use in traditional agricultural areas: An example of ferroalloy industry in Qugou Town, Henan Province
Amenity, firm agglomeration, and local creativity of producer services in Shanghai
Producer services agglomeration and carbon emission reduction: An empirical test based on panel data from China
Although China has a high rate of economic development, it still faces the problems of unstable industrial structure, low industrial level, and large carbon emissions, which pose huge challenges to China’s sustainable development. China is working hard to develop producer services to achieve industrial transformation and reduce carbon emissions. In this context, there is an extremely urgent need to conduct academic research on changes in producer service agglomeration and carbon emissions. Whether the producer service industry has agglomeration characteristics, and whether the producer service industry affects carbon emissions through multiple paths, are issues worthy of attention. Therefore, this paper takes China as the research area, selects the provincial administrative unit as the research sample, and conducts research on these issues by using exploratory spatial data analysis methods and various spatial econometric models under the guidance of the relevant theories of new economic geography. Our research finds that producer services have significant spatial agglomeration characteristics, and they also have significant spatial differentiation patterns. In addition, the agglomeration of producer services can significantly promote the reduction of carbon emissions and can show obvious spillover effects. Finally, in response to the research conclusions of this paper, we also put forward countermeasures and suggestions from the perspective of the common development of producer service industry and manufacturing industry, hoping to promote China’s transformation from industrial economy to service economy, to maximize the use of producer service industry accumulated dividends.
Regional effects of producer services on manufacturing productivity in China
The (strong) interdependence between intermediate producer services' attributes and manufacturing location
A slacks-based measure of efficiency in data envelopment analysis
黄河流域城市生态效率演化特征及门槛效应
DOI:10.13249/j.cnki.sgs.2022.01.007
[本文引用: 1]
基于非期望产出视角测度黄河流域城市生态效率,探讨2003—2017年黄河流域城市生态效率时空演化特征及资源禀赋的门槛效应。结果表明:① 黄河流域城市生态效率呈稳步上升态势,但全域和资源型城市表现出一定梯度效应,有两极分化现象;② 各城市生态效率总体呈东高西低、南高北低格局,并存在显著空间溢出效应,不同类型城市演化存在显著的时空惯性。③ 资源禀赋存在显著门槛效应,资源型城市生产性服务业集聚与生态效率呈“U”型关系,制造业集聚在跨过门槛值后会产生抑制作用,产业协同集聚则始终具有正向作用;非资源型城市资源禀赋会削弱生产性服务业集聚的促进作用,制造业集聚及产业协同集聚的影响跨过门槛值后不显著。
The evolution characteristics and threshold effects of the ecological efficiency in the Yellow River Basin cities
This article studies the urban ecological efficiency of the Yellow River Basin, and discusses the spatial-temporal evolution characteristics of urban ecological efficiency and the threshold effect in the Yellow River Basin from 2003 to 2017 based on the perspective of unexpected output. The results showed that: 1) The ecological efficiency of the Yellow River Basin cities increased steadily, but the whole region and resource-based cities showed a certain gradient effect, with polarization phenomenon. 2) The ecological efficiency of each city is higher in the east and lower in the west, higher in the south and lower in the north, and there is a significant spatial spillover effect. 3) Resource endowment has a significant threshold effect. For resource-based cities, the relationship between producer services agglomeration and ecological efficiency is U-shaped, manufacturing agglomeration will have inhibitory effect after crossing the threshold, and industrial collaborative agglomeration always has a positive effect. For non resource-based cities, resource endowment will weaken the promoting effect of producer services agglomeration, while the influence of manufacturing agglomeration and industrial collaborative agglomeration is not significant after crossing the threshold.
黄河流域绿色发展效率的时空演变特征与影响因素
DOI:10.11821/dlyj020200895
[本文引用: 3]
基于2005—2017年黄河流域61个地级市数据,构建了黄河流域绿色发展效率投入产出指标体系,并运用多种计量方法研究了黄河流域绿色发展效率时空格局特征与驱动因素。结果如下:① 黄河流域绿色发展效率的区域差距不断扩大,研究期限内绿色发展效率呈现出由“高效率小差距”向“低效率大差距”演进,说明黄河流域绿色发展效率的俱乐部收敛特征不断凸显。② 黄河流域绿色发展效率增长主要来源于规模效率的贡献,科学技术尚未发挥重要驱动作用。③ 研究期限内黄河流域绿色发展效率存在较为明显的空间依存关系,绿色发展效率水平相近的地区空间集聚现象显著。④ 黄河流域绿色发展效率空间分异性显著,高效率地区的东西分布、南北分布的地域差异性突出,集中表现在以城市群为载体呈集群式发展。最后采用Tobit回归模型具体分析了产业结构、经济发展、科学技术、政府调控与市场化水平对于黄河流域及上中下游地区绿色发展效率的作用强度与作用效果。
Spatio-temporal evolution track and influencing factors of green development efficiency in Yellow River Basin
Based on the data of 61 prefecture-level cities in the Yellow River Basin from 2005 to 2017, this paper constructed the input-output index system of green development efficiency, and used various spatial econometric models to examine the spatio-temporal pattern characteristics and influencing factors of green development efficiency in the study area. The following conclusions can be drawn as follows. (1) The regional differences of green development efficiency are gradually widening, evolving from “small differences and high efficiency” to “large differences and low efficiency” totally, which indicates that the club convergence characteristics of green development efficiency are obvious. (2) Scale efficiency makes significant contribution to the growth of green development efficiency, showing that large-scale agglomeration and intensive development are still an important guarantee for the improvement of green development efficiency. However, science and technology have not yet played an important driving role in improving the green development efficiency. In the future, improving the level of science and technology in this basin is the key to optimizing and improving the green development efficiency. (3) There is an obvious spatial reliable correlation of green development efficiency within the study period, and the regional spatial agglomeration featured with similar green development efficiency level is significant. (4) The spatial distributions of green development efficiency are obviously diverse, and the regional differences between the east-west distribution and north-south distribution of high-efficiency areas are prominent, which mainly shows a cluster development stimulated with urban agglomeration. and reflects that the green development efficiency of the study basin has a circular cumulative path dependent effect. The influencing factors of green development efficiency in the Yellow River Basin can be attributed to the adjustment effect of industrial structure, the growth effect of economic development, the demonstration effect and spillover effect of science and technology, the government regulation mechanism and market-oriented mechanism. Finally, Tobit regression model is used to analyze the influencing intensity and direction of industrial structure, economic development, science and technology, government regulation and marketization level on green development efficiency in the Yellow River Basin and its subzones.
基于超效率SBM模型的中国城市碳排放绩效时空演变格局及预测
DOI:10.11821/dlxb202006016
[本文引用: 1]
由CO<sub>2</sub>排放所引起的气候变化是当今社会所关注的热点话题,提高碳排放绩效是碳减排的重要途径。目前关于碳排放绩效的研究多从国家尺度和行业尺度进行探讨,由于能源消耗统计数据有限,缺乏城市尺度的研究。基于遥感模拟反演的1992—2013年中国各城市碳排放数据,采用超效率SBM模型对城市碳排放绩效进行测定,构建马尔可夫和空间马尔可夫概率转移矩阵,首次从城市尺度探讨了中国碳排放绩效的时空动态演变特征,并预测其长期演变的趋势。研究表明,中国城市碳排放绩效均值呈现波动中稳定上升的趋势,但整体仍处于较低的水平,未来城市碳排放绩效仍具有较大的提升空间,节能减排潜力大;全国城市碳排放绩效空间格局呈现“南高北低”特征,城市间碳排放绩效水平的差异性显著;空间马尔科夫概率转移矩阵结果显示,中国城市碳排放绩效类型转移具有稳定性,且存在“俱乐部收敛”现象,地理背景在中国城市碳排放绩效类型转移过程中发挥重要作用;从长期演变的趋势预测来看,中国碳排放绩效未来演变较为乐观,碳排放绩效随时间的推移而逐步提升,碳排放绩效分布呈现向高值集中的趋势。因此未来中国应继续加大节能减排力度以提高城市碳排放绩效,实现国家节能减排目标;同时不同地理背景的邻域城市之间应建立完善的经济合作联动机制,以此提升城市碳排放绩效水平并追求经济增长与节能减排之间协调发展,从而实现低碳城市建设和可持续发展。
Spatio-temporal evolution and trend prediction of urban carbon emission performance in China based on super-efficiency SBM model
Climate change caused by CO2 emissions has become an environmental issue globally in recent years, and improving carbon emission performance is an important way to reduce carbon emissions. Although some scholars have discussed the carbon emission performance at the national scale and industry level, literature lacks studies at the city- level due to a limited availability of statistics on energy consumptions. In this study, based on China's city-level remote sensing carbon emissions from 1992 to 2013, we used the super-efficiency SBM model to measure the urban carbon emission performance, and the traditional Markov probability transfer matrix and spatial Markov probability transfer matrix are constructed to explore the spatio-temporal dynamic evolution characteristics of urban carbon emission performance in China for the first time and to predict its long-term evolution trend. The study shows that urban carbon emission performance in China presents a trend of steady increase in the fluctuation, but the overall level is still at a low level, so there is still a great improvement space in urban carbon emission performance, with huge potential for energy conservation and emission reduction. The spatial pattern of national urban carbon emission performance shows the characteristics of "high in the south and low in the north", and there is a significant difference in the level of carbon emission performance between cities. The spatial Markov probabilistic transfer matrix results show that the transfer of carbon emission performance type in Chinese cities is stable, thus it forms the "club convergence" phenomenon, and the geographical background plays an important role in the process of the transfer. From the perspective of long-term trend prediction, the future evolution of urban carbon emission performance in China is relatively optimistic. The carbon emission performance will gradually improve over time, and the distribution of carbon emission performance presents a trend of high concentration. Therefore, in the future, China should continue to strengthen research and development to improve the performance level of urban carbon emissions and achieve the national target of energy conservation and emission reduction. At the same time, neighboring cities with different geographical backgrounds should establish a sound linkage mechanism of economic cooperation to pursue coordinated development between economic growth, energy conservation and emission reduction, so as to realize low-carbon city construction and sustainable development.
基于空间计量模型的城市网络外部性定量测度
DOI:10.11821/dlyj020220732
[本文引用: 1]
在经济全球化、区域一体化的背景下,城市发展动力由内部功能集聚转向外部关系协调,城市间的关联作用愈发重要,成为“城市的第二本质”。通过文献计量分析,发现空间计量模型逐渐成为城市网络外部性定量测度的主要方法之一。从研究设计角度,空间计量模型作为城市网络外部性的定量建模工具,存在至少两方面的问题:城市网络外部性的非对称效应和城市网络的多尺度问题。本文结合城市网络外部性测度与建模,首先阐述如何规范地解读空间计量模型参数及其与网络外部性测度的对应关系;其次基于蒙特卡洛模拟实验论证非对称城市网络外部性和多尺度城市网络外部性的建模方法。研究表明:① 忽视城市网络外部性中潜在的非对称效应会显著降低模型参数估计的准确性,本文开发的非对称空间效应模型(Asymmetric Spatial Econometric Model,ASEM)可以准确识别网络外部性的非对称效应,给出更加准确的参数估计;② 忽略现实存在的多尺度网络效应,只在单一尺度对网络效应建模会造成参数估计失真,而空间多尺度统计模型(Hierarchical Spatial Autoregressive model,HSAR)为多尺度网络外部性建模提供了有效的工具,并且通过合理的模型设定,HSAR能准确区分并识别地理集聚效应和网络外部效应。
Urban network externality modelled through spatial econometric models
In the context of economic globalization and regional integration, urban development forces have shifted from geographical agglomeration to external network coordination. The connectivity among cities or city network is increasingly becoming “the second essence of cities”. With bibliometric analysis of urban network externality studies, we find that spatial econometric models have been increasingly employed to quantify whether, and to what extent, urban network externality matters in the developmental process of cities or regions. This study first investigated the mathematical properties of spatial econometric models and in particular, the correspondence of model parameters and various measures of urban network externality. More importantly, we highlighted two essential issues of classic spatial econometric models when being applied to model urban network externality: the asymmetric effect and scale effect of urban network externality. Then, we developed an asymmetric spatial economic model (ASEM) to capture the asymmetric effect of urban network externality and, a hierarchical spatial autoregressive model (HSAR) to deal with the scale effect of urban network externality. A series of Monte Carlo simulation experiments were conducted to assess the benefits of these two proposed methodologies. We found that: (1) Ignoring the potential asymmetric effects in the urban network will significantly reduce the accuracy of model parameter estimation. On the other hand, the proposed ASEM can accurately identify the asymmetric effects of network externalities and yield more accurate parameter estimation. (2) Ignoring multi-scale network effects in real world data and modeling the network effects at a single scale will cause serious estimation distortion. The HSAR model instead can provide a reliable quantitative method for modeling the externalities of multi-scale networks.
中国城市群城市生产性服务功能与地理距离:网络外部性的视角
DOI:10.11821/dlyj020211066
[本文引用: 1]
以往研究对于距离在网络外部性影响城市功能过程中的作用所知甚少,而且多关注城市网络外部性的正面效应,对城市间竞争以及由此所带来的网络外部性的负效应缺少分析。为了弥补已有研究的不足,本文采用空间的视角,以城市群内的城市生产性服务功能为例,建立一个核心-外围的空间结构来揭示城市生产性服务功能、网络外部性与地理距离之间的关系。研究发现:① 城市生产性服务功能强度随着远离城市群核心城市而上升,互联网渗透率和列车网络中心度会显著地强化这一效应;② 城市生产性服务功能随距离变化的机制在于竞争效应比协同效应对地理距离更加敏感,从而衰减更快,因而靠近核心城市的城市在生产性服务功能上遭受了“集聚阴影”,而远离核心城市的城市在功能上更多的受到了协同作用的支撑。本文结论为推进城市群内的分工协作与一体化发展提供了重要启示。
Urban producer service functions and geographical distance in Chinese city clusters: A perspective from network externalities
Producer service, as one of the important urban functions, reflects the urban ability to serve other cities in the networked urban system. Correspondingly, the urban producer service functions can be influenced by the relationships, particularly distance between these cities. Previous research paid little attention to the role which distance between cities plays in network externalities, and focused more on the positive effects of network externalities stemming from synergy, which derives from cooperation between cities, while neglecting the negative ones caused by intercity market competition. To further explore the relationship between urban functions, geographical distance and network externalities, this paper builds a theoretical city-cluster model with core-periphery spatial structure. This model hypothesizes that the impact of network externalities on the producer service functions depends on the trade-off between synergy effect and competition effect, which are closely related to the spatial relationships, or distances, between cities. Employing data of 12 city clusters in China from 2013 to 2016, and applying the employment ratio of the producer service sector to the manufacturing sector to measure the intensity of urban producer service functions, we examine the effects of geographical distance on urban producer service functions. The results reveal that: (1) the intensity of urban producer service functions increases with distance from the core city. In addition, internet penetration rate and transportation network centrality significantly reinforce this effect. (2) The mechanism is based on the difference in sensitivity to geographical distance between the competition effect and synergy effect. Seemingly, the competition effect decays more quickly with distance than the synergy effect. Thus producer service functions of the cities which are close to the core city tend to suffer the "agglomeration shadow" effect resulted from competition, while producer service functions of the cities which are further away tend to benefit from the synergy effect. The findings of this paper demonstrate that in the context of urban networks, geographical distance (urban location) still plays an essential role in the regional labor division. It also provides important insights for the promotion of the urban functional specialization and regional integration within city clusters. Cities near the core city could choose to actively undertake complementary functions of the core city; conversely, carrying out synergetic functions with the core city is a better choice for cities far away from the core city.
技术创新对黄河流域城市绿色发展的影响研究
DOI:10.13249/j.cnki.sgs.2021.08.002
[本文引用: 1]
创新是推动黄河流域高质量发展的重要途径之一。利用2006—2018年黄河流域79个地级以上城市的面板数据,首先构建指标体系对各城市技术创新及绿色发展水平进行分析,其次通过面板计量模型深入探究技术创新对城市绿色发展的作用机理。研究表明:① 2006—2018年,黄河流域城市技术创新与绿色发展水平均得到明显提升,但空间差异显著,总体呈“下游>中游>上游”阶梯式递减特征。② 黄河流域城市技术创新对绿色发展总体上没有显著影响,但在加入技术创新的二次项后,两者之间呈现显著的“U”型非线性关系,即技术创新先抑制后促进城市绿色发展,这也验证了技术的“回弹效应”假说;③ 技术创新对黄河流域城市绿色发展的影响可以通过直接效应和间接效应共同体现,但这两种效应正好相反,即一个城市技术创新能力的提升对该城市绿色发展存在显著的“U”型(先抑制后促进)关系,但对邻近城市的作用呈现倒“U”型相反的关系。根据研究结论,从技术创新对城市绿色发展的直接效应和间接效应2个方面提出了相应的政策建议。
Impact of technological innovation on urban green development in the Yellow River Basin
Innovation is one of the important ways to promote the high-quality development of the Yellow River Basin. Using the panel data of 79 cities above prefecture level in the Yellow River Basin from 2006 to 2018, this article first constructs an index system to analyze the level of technological innovation and green development of each city, and then deeply explores the mechanism of technological innovation on regional green development through panel econometric model. The results are as follows: 1) From 2006 to 2018, the level of urban technological innovation and green development in the Yellow River Basin has been greatly improved, but the spatial difference is significant, and the overall trend is “downstream > midstream > upstream”. 2) On the whole, technological innovation has no influence on urban green development in the Yellow River Basin, but after adding the quadratic term of technological innovation, there is a obvious positive “U-shaped” nonlinear relationship between them, which also shows the existence of “rebound effect”. 3) The impact of technological innovation on urban green development in the Yellow River basin can be reflected by both direct and indirect effects, but the two effects are just the opposite. That is to say, the promotion of a city’s technological innovation level has a significant “U-shaped” relationship with the urban green development, but it has an inverted “U-shaped” relationship with its neighboring cities. According to the research conclusions, this article puts forward the corresponding policy implications from the direct and indirect effects of urban technological innovation on green development. First of all, it is particularly important for the middle and upper reaches of the Yellow River basin to enhance the ability of technological innovation and strengthen the innovation-driven effect on urban green development; Then, cities in the Yellow River Basin should break the “beggar thy neighbor” phenomenon, so as to strengthen the coordinated development in the Yellow River Basin and give play to the positive spillover effect among cities.
黄河流域工业生态效率空间分异特征与影响因素
DOI:10.11821/dlyj020200516
[本文引用: 1]
工业生态效率是人地系统耦合状态和水平的重要表征。以黄河流域八省区为实证区域,构建工业生态效率投入产出指标体系,采用Super-SBM模型对地市尺度2006—2016年工业生态效率进行测度,分析其空间分异特征;构建计量模型,从全流域和上中下游等不同尺度,考察工业生态效率的影响因素。结果表明:① 工业生态效率整体呈提升态势,空间上呈自下游向上游递减格局,山东整体最高,河南提升较快,甘肃整体最低;下游城市群和区域中心城市的工业生态效率整体更优。② 工业生态效率具有空间自相关特征,由高-高集聚类型演化为高-高、低-低两种局域集聚类型。2006年高-高集聚类型分布在陕晋蒙交界地区和山东半岛城市群,2016年高-高集聚类型分布于山东半岛城市群、中原城市群和陕西南部,低-低集聚类型集中分布在山西、甘肃。③ 经济发展水平、工业集聚强度、科技投入、经济外向度、环境规制和经济密度对工业生态效率存在正向促进作用,但与中上游相比,下游地区工业集聚强度的影响偏弱,而环境规制的作用更强。④ 提高黄河流域工业生态效率水平,需要进一步提高经济发展水平、工业集聚强度、科技投入和经济外向度,加强环境规制。但要根据上中下游实际采取差异化措施,中上游地区因生态环境脆弱,应将清洁产业的集聚作为发展方向,提升产业集聚正外部性,支持资源型城市的经济结构转型,强化环境规制的约束。
Spatio-temporal evolution characteristics and influencing factors of the industrial eco-efficiency in the Yellow River Basin
Industrial eco-efficiency can reflect the coupling state and level of Human-Earth System. Taking the eight provinces of the Yellow River Basin as the study region, this paper constructs the input-output index system of industrial eco-efficiency, and uses Super-SBM model to measure the industrial eco-efficiency at the city scale from 2006 to 2016, and analyzes its spatial differentiation. The econometric model is constructed to examine the influencing factors of industrial eco-efficiency from different scales such as the whole basin and the upper, middle and lower reaches. The results show that: (1) The overall industrial eco-efficiency is on the rise, and it is decreasing from the downstream to the upstream. On the whole, Henan develops faster, Shandong has the highest industrial eco-efficiency, while Gansu has the lowest. The industrial eco-efficiency of urban agglomerations and regional central cities in the lower reaches is overall better (2) Industrial ecoefficiency has spatial autocorrelation characteristics. From high-high agglomeration types evolve into high-high and low-low local agglomeration types. In 2006, High-high types are mainly distributed in Shanxi-Shaanxi-Inner Mongolia border area and Shandong Peninsula urban agglomeration. In 2016, High-high types are mainly distributed in Shandong Peninsula urban agglomeration, Central Plains urban agglomeration and southern Shaanxi, and low-low types are concentrated in Shanxi and Gansu. (3) The level of economic development, industrial agglomeration intensity, scientific and technological input, economic extroversion, environmental regulation and economic density have positive effects on industrial eco-efficiency. However, compared with the middle and upper reaches, the lower reaches is weaker in the impact of industrial agglomeration intensity, while stronger in the effect of environmental regulation. (4) To improve the level of industrial eco-efficiency in the Yellow River Basin, it is necessary to enhance tthe level of economic development, the intensity of industrial agglomeration, the investment in science and technology and the economic extroversion, and strengthen environmental regulation. However, differentiated measures should be taken according to the actual situation in the upper, middle and lower reaches. As the middle and upper reaches have more fragile eco-environment, we should agglomerate clean industries so as to improve the positive externality of industrial agglomeration, support the economic structure transformation of resource-based cities, and strengthen the constraints of environmental regulations.
黄河流域生态经济走廊绿色发展时空分异特征与影响因素识别
DOI:10.11821/dlxb202103016
[本文引用: 1]
基于绿色发展科学内涵,综合构建了黄河流域绿色发展的评价指标体系,并采用熵值法、空间自相关分析、地理探测器模型等多种计量方法研究了2005—2017年黄河流域生态经济走廊绿色发展时空分异特征与驱动因素,结果如下:① 黄河流域绿色发展主要来源于规模化扩张与总量增长的外部驱动作用,热衷于发展速度与规模,忽视质量与效率的内涵式提升势必导致内生驱动作用不足与不可持续性;② 研究时限内黄河流域绿色发展低水平区不断减少,较高水平区稍有增加,但低水平与中低水平区占比长期稳定在65%以上,说明黄河流域绿色发展质量有待于进一步提升;③ 2005—2017年间黄河流域61地级市整体存在较为明显的空间依存关系,且绿色发展水平具有相对明显的空间俱乐部收敛特征,流域内两极分化现象较为明显;④ 经济发展水平、科学技术与政府调控始终是黄河流域绿色发展的高作用力影响因子,因子交互作用后对黄河流域绿色发展解释力远超单因子,反映出黄河流域绿色发展的驱动因素具有复杂性特征。
Spatio-temporal differentiation characteristics and influencing factors of green development in the eco-economic corridor of the Yellow River Basin
Based on the scientific connotation of green development, a comprehensive evaluation index system for green development in the Yellow River Basin was constructed, and various measurement methods such as entropy method, spatial autocorrelation analysis, and geographical detector model were used to study the spatio-temporal differentiation characteristics and the influencing factors of the green development in the eco-economic corridor of the Yellow River Basin. The results are obtained as follows: (1) The green development in the Yellow River Basin mainly originates from the external driving effects of large-scale expansion and the growth of total volume. Focusing only on pursuing the speed and scale of development but ignoring the connotative improvement of quality and efficiency will inevitably lead to the insufficiency of internal driving effects and unsustainability. (2) The number of areas with lower level of green development in the study area decreased continuously while that with a higher-level of green development rose slightly during the limited study period. However, the proportion of the numbers of areas with the lower level and medium-low level of green development remained above 65% for a long time, indicating that the level of green development needs further improvement. (3) From 2005 to 2017, the 61 prefecture-level cities in the Yellow River Basin generally showed relatively obvious spatial dependencies, and the green development level displayed a relatively obvious characteristic of spatial club convergence. The phenomenon of polarization in the study area was obvious. (4) The economic development level, science and technology level and government regulation are still the leading factors influencing the green development, and the explanatory power of interactions between factors for the green development far exceeds that of a single factor. This reflects the driving factors for green development in the Yellow River Basin are complex.
中国绿色发展时空演变轨迹与影响机理研究
DOI:10.11821/dlyj020190057
[本文引用: 1]
绿色发展战略既是实现区域经济社会与资源环境耦合协调的重要内容,也是推进区域人地协调的重要路径。研究运用投影寻踪评价模型(PPM)以及基尼系数、变异系数、空间自相关和空间计量等方法分析中国30个省市区绿色发展时空演变轨迹与影响机理,得出以下结论:① 构建涵盖“绿色增长-绿色福利-绿色财富”三个维度的绿色发展系统,三个维度的协同一致和均衡发展是绿色发展的本质特征和内在要求;② 中国绿色发展指数呈逐年上升趋势,但增长速度较低,绿色发展虽然取得了显著成效,但问题与压力依然严峻。绿色增长和绿色福利指数均呈现增长趋势,年均增长率分别为5.77%、11.74%,绿色财富指数整体相对较低且增长缓慢,一定程度上反映了绿色财富指数增长的艰巨性和长期性;③ 绿色发展及其构成指数的区域差异呈逐渐缩小趋势,但差异程度依然较大,总体呈东部地区>东北地区>西部地区>中部地区的特征,绿色财富与绿色发展及其他构成指数空间分布错位,高高、低低空间集聚特征明显;④ 城镇化水平、产业结构、人口密度、科技创新、市场化、国际贸易是影响中国绿色发展的主要因素。研究从塑造生态文化理念、发展生态高效产业、提升资源环境承载能力和优化空间治理体系等方面提出对策建议,对中国生态文明建设和绿色发展推进具有一定的借鉴参考价值。
A comparative research of the spatial-temporal evolution track and influence mechanism of green development in China
生产性服务业集聚、空间溢出与城市绿色全要素生产率: 来自长三角城市群的经验证据
Productive services agglomeration, spatial spillover and urban green total factor productivity: Based on the empirical evidence from Yangtze River Delta
外资和生产性服务业集聚对城市环境污染的影响
Impact of agglomeration of foreign capital and producer services on urban environmental pollution
