
1978—2018年中国环境污染的时空特征——基于《人民日报》新闻报道
|
张学珍(1981-),男,山东济宁人,博士,研究员,主要从事气候与环境变化研究。 E-mail: xzzhang@igsnrr.ac.cn |
收稿日期: 2020-03-16
录用日期: 2020-09-03
网络出版日期: 2021-06-10
基金资助
中国科学院前沿科学重点研究项目(QYZDB-SSW-DQC005)
国家重点研发计划项目(2017YFA0603301)
中国科学院重点部署项目(ZDRW-ZS-2017-4)
版权
Spatio-temporal characteristics of environment pollutions of China from 1978 to 2018: A study using news reports from the People's Daily
Received date: 2020-03-16
Accepted date: 2020-09-03
Online published: 2021-06-10
Copyright
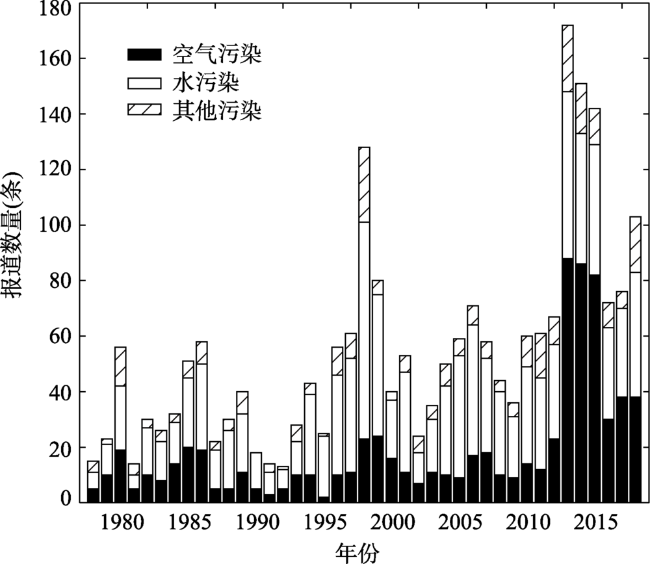
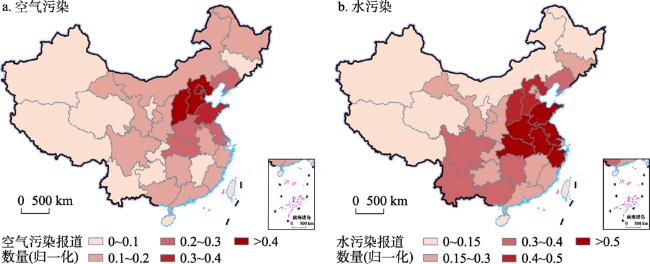
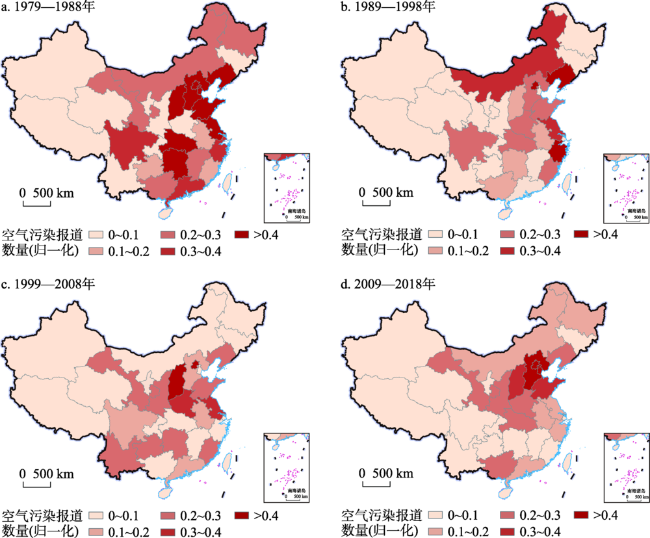
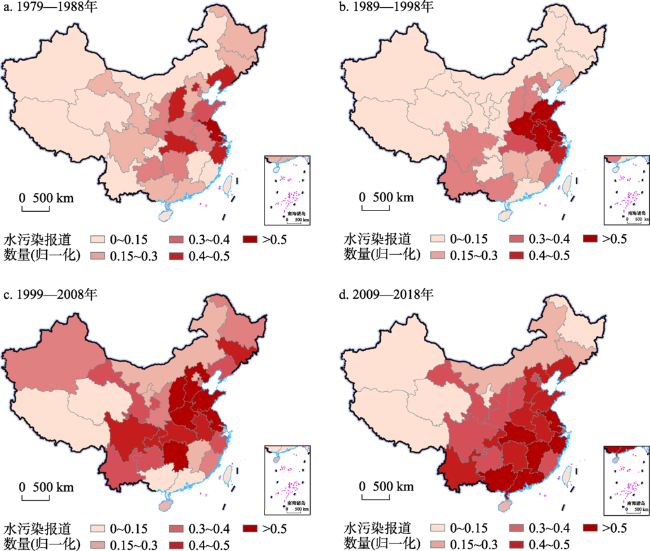
利用1978—2018年《人民日报》的2238条环境污染新闻报道,分析了改革开放40年间中国环境污染的时空特征,并初步探讨了其与社会经济发展的关系。通过人工判读,逐条提取新闻报道的环境污染类型、时间与地点,进而通过统计分析,研究发现:① 1978—2018年中国的环境污染报道经历了3个热点时期,其中前两个时期(20世纪80年代中后期、90年代中后期)关注重点是水污染问题,第三个时期(2015年前后)关注重点兼顾水污染与空气污染。② 环境污染新闻报道热点地区随时间而变,其中空气污染的热点地区由20世纪80年代的南、北双中心格局,演变成相对分散的格局,再进一步演变成21世纪最初10年以京津冀为中心的格局;水污染的热点地区分布由20世纪80年代相对分散的空间格局,演变成以沿淮四省为中心的格局,进一步变成东、西双中心的格局,至21世纪最初10年重新回归至相对分散的格局。③ 从新闻报道数量的空间分布与主要社会经济指标的相关分析结果,并结合新闻报道内容来看,20世纪80年代的环境污染主要是工业生产排放所致,之后逐渐演变成近年来工业生产排放与生活排放共同导致。
张学珍 , 王发浩 , 罗海江 . 1978—2018年中国环境污染的时空特征——基于《人民日报》新闻报道[J]. 地理研究, 2021 , 40(4) : 1134 -1145 . DOI: 10.11821/dlyj020200206
Using 2238 pieces of news for environment pollutions from the People's Daily, this study analyzed the spatio-temporal characteristics of environment pollutions of China since the reform and opening up policy started 40 years ago and explored the relationship between environment pollutions and socio-economic development. Based on these news reports, we extracted the categories, dates, and locations of environment pollution events. We found that there were three hotspot periods for the environment pollutions over the period of 1978-2018. During the first two periods (mid-late 1980s and mid-late-1990s, most of news reports focused on water pollution. During the third period (mid-2010s), the news reports paid attention to both water and air pollutions. The spatial distribution of environment pollution hotspots changes from period to period. In the 1980s, the hotspots of air pollution were mainly two centers, namely, south and north centers. In the 1990s and 2000s, the hotspots were scattered. In the 2010s, the hotspots concentrated in one region, i.e. Beijing-Tianjin-Hebei region. The hotspots of water pollution scattered in the 1980s. Then, they concentrated in the region along the Huaihe River in the 1990s and into two centers in the 2000s, which were east and west centers. In the 2010s, the hotspots scattered again. Based on the correlations between the number of news reports and macro-economy indicators as well as news reports content, the environment pollution in the 1980s was mainly derived from industrial emissions while in recent decades it was derived from both industrial and living emissions.
表1 空气污染、水污染报道数量与主要社会经济指标省级差异的相关系数Tab. 1 The correlation coefficient between the number of air pollution and water pollution reports and major socio-economic indicators |
| 类型 | 时期 | 公路里程 增长率 | 人均GDP 增长率 | 货运量 增长率 | 固定资产投资增长率 | 第二产业 占比 | 第二产业 产值增长率 |
|---|---|---|---|---|---|---|---|
| 空气 污染 | 1979—1988 | 0.073 | -0.113 | -0.136 | 0.395** | 0.469*** | 0.097 |
| 1989—1998 | 0.127 | 0.362** | -0.076 | 0.116 | 0.222 | 0.074 | |
| 1999—2008 | -0.002 | 0.107 | -0.264 | -0.021 | 0.139 | -0.059 | |
| 2009—2018 | -0.329* | -0.378** | -0.283 | -0.264 | -0.282 | -0.233 | |
| 水污染 | 1979—1988 | 0.181 | -0.017 | -0.076 | 0.536*** | 0.400** | 0.228 |
| 1989—1998 | 0.236 | 0.427** | -0.103 | 0.165 | 0.193 | 0.489*** | |
| 1999—2008 | 0.488*** | 0.195 | 0.105 | 0.319* | 0.330* | -0.043 | |
| 2009—2018 | -0.292 | 0.101 | 0.296 | -0.056 | 0.186 | 0.069 |
注:*、**、***分别表示0.1、0.05、0.01的显著性水平。 |
真诚感谢匿名评审专家在论文评审中所付出的时间和精力,评审专家对本文结论梳理方面的修改意见,使本文获益匪浅。
| [1] |
国家统计局. 中国统计年鉴. 北京: 中国统计出版社, 2019: 56.
[ National Bureau of Statistics of China. China Statistical Yearbook. Beijing: China Statistics Press, 2019: 56.]
|
| [2] |
|
| [3] |
曲格平. 中国环境保护四十年回顾及思考: 回顾篇. 环境保护, 2013,41(10):10-17.
[
|
| [4] |
王文兴, 柴发合, 任阵海, 等. 新中国成立70年来我国大气污染防治历程、成就与经验. 环境科学研究, 2019,32(10):1621-1635.
[
|
| [5] |
解振华. 中国改革开放40 年生态环境保护的历史变革: 从“三废”治理走向生态文明建设. 中国环境管理, 2019,11(4):5-10.
[
|
| [6] |
|
| [7] |
|
| [8] |
李名升, 张建辉, 张殷俊, 等. 近10年中国大气PM10污染时空格局演变. 地理学报, 2013,68(11):1504-1512.
[
|
| [9] |
陈祖海, 雷朱家华. 中国环境污染变动的时空特征及其经济驱动因素. 地理研究, 2015,34(11):2165-2178.
[
|
| [10] |
|
| [11] |
杨洁, 毕军, 张海燕, 等. 中国环境污染事故发生与经济发展的动态关系. 中国环境科学, 2010,30(04):571-576.
[
|
| [12] |
丁镭, 黄亚林, 刘云浪, 等. 1995-2012 年中国突发性环境污染事件时空演化特征及影响因素. 地理科学进展, 2015,34(6):749-760.
[
|
| [13] |
赵雪雁, 王蓉, 王晓琪, 等. 基于多尺度的中国环境污染事件时空分布及其影响因素. 地理科学, 2019,39(9):1361-1370.
[
|
| [14] |
许静, 王永桂, 陈岩, 等. 中国突发水污染事件时空分布特征. 中国环境科学, 2018,38(12):4566-4575.
[
|
| [15] |
王静爱, 史培军, 王平, 等. 1949—1990年中国自然灾害时空分异研究. 自然灾害学报, 1996, (1):1-7.
[
|
| [16] |
张丕远. 中国历史气候变化, 济南: 山东科学技术出版社, 1996: 215-226.
[
|
| [17] |
黄宗财, 仇培元, 陆锋, 等. 基于联合主题特征的网络新闻文本蕴含环境污染事件检测. 地球信息科学学报, 2019,21(10):1510-1517.
[
|
| [18] |
[ People's Daily. Introduction to People's Daily. http://www.people.com.cn/GB/50142/104580/index.html, 2020-3-5.]
|
| [19] |
王金南, 董战峰, 蒋洪强, 等. 中国环境保护战略政策70年历史变迁与改革方向. 环境科学研究, 2019,32(10):1636-1644.
[
|
| [20] |
陈昆仑, 郭宇琪, 刘小琼, 等. 长江经济带工业废水排放的时空格局演化及驱动因素. 地理科学, 2017,37(11):1668-1677.
[
|
| [21] |
|
| [22] |
周侃, 樊杰, 刘汉初. 环渤海地区水污染物排放的时空格局及其驱动因素. 地理科学进展, 2017,36(2):171-181.
[
|
/
| 〈 |
|
〉 |