
中国出境旅游安全事件集群:空间分异及组态致因
|
谢朝武(1975-),男,湖南武冈人,博士,教授,博士生导师,主要研究方向为旅游安全、风险与危机管理、文化遗产与旅游地管理。E-mail: xiecwu@126.com |
收稿日期: 2022-08-15
修回日期: 2023-01-10
网络出版日期: 2023-04-26
基金资助
国家自然科学基金项目(41971182)
China's outbound tourism safety incidents cluster: Spatial differentiation and configuration causes
Received date: 2022-08-15
Revised date: 2023-01-10
Online published: 2023-04-26
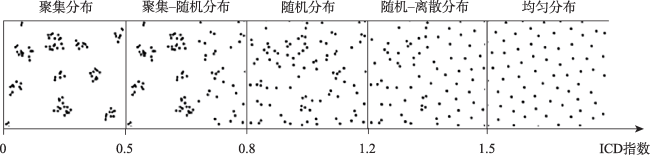
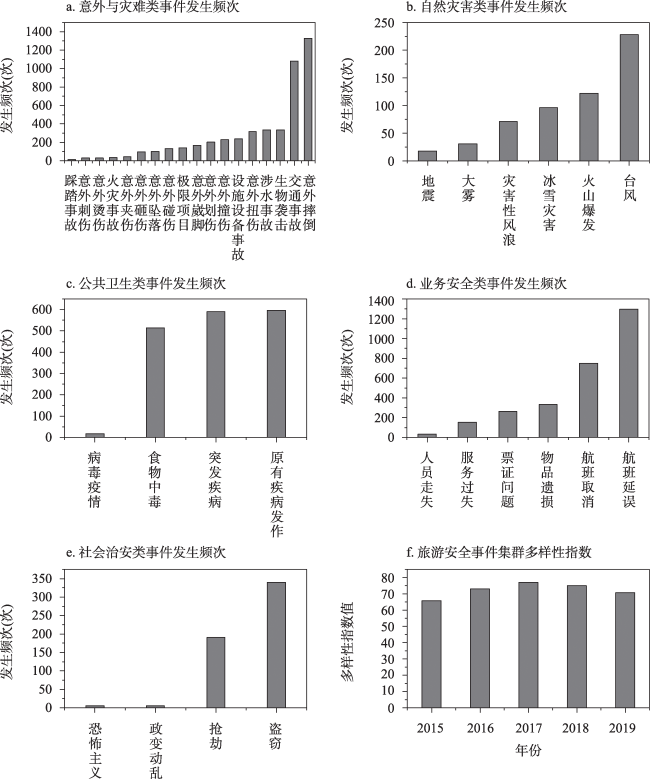
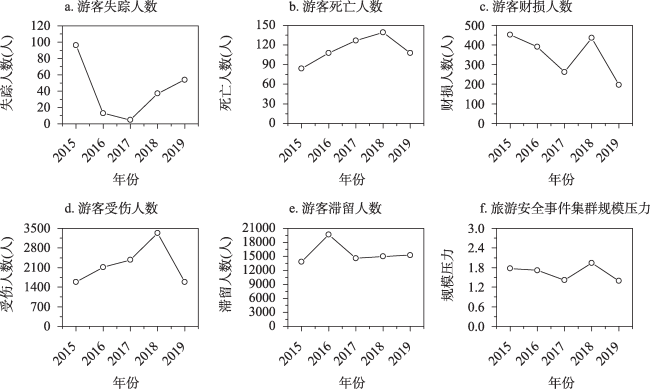
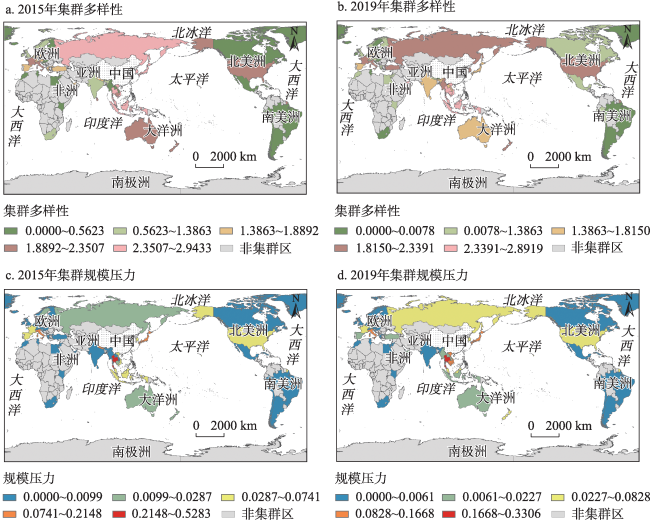
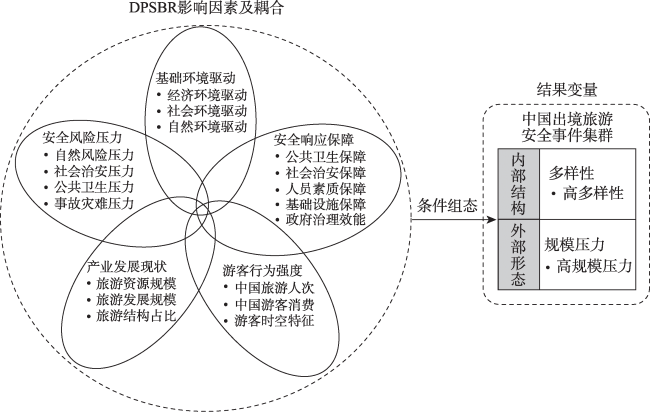
本文将出境旅游安全事件研究从个体视角推进到集群视角。基于2015—2019年17746起中国出境旅游安全事件,研究首先采用最邻近点指数识别中国出境旅游安全事件集群,并在此基础上利用多样性指数、熵值法、空间自相关等方法分别测度和剖析中国出境旅游安全事件集群的结构类型、规模压力及其空间分布特征,同时借助模糊集定性比较分析法(fsQCA)探讨集群产生的复杂组态致因。研究发现:① 2015—2019年全球共60个目的地存在中国出境旅游安全事件集群,集群内部类型结构复杂、外部规模压力形势较为严峻。② 中国出境旅游安全事件集群多样性和规模压力均存在空间相关性和非均衡分布特征,东南亚地区旅游安全事件集群的内部结构类型与规模压力强度更为突出。③ 中国出境旅游安全事件集群多样性和规模压力的区域异质性是DPSBR多重风险因素差异化耦合作用的结果。其中,高产业发展现状(S)、高游客行为强度(B)和低基础环境驱动(D)是导致各区域事件集群内部结构呈现高度复杂化的主要原因;高产业发展现状(S)和高游客行为强度(B)是导致高外部规模压力的主要原因。随时间推移,高安全风险压力(P)成为各区域形成高集群多样性和高规模压力的关键。
谢朝武 , 赖菲菲 , 黄锐 , 席建超 . 中国出境旅游安全事件集群:空间分异及组态致因[J]. 地理研究, 2023 , 42(5) : 1177 -1199 . DOI: 10.11821/dlyj020220866
With the expansion of the scale of China's outbound tourism safety incidents, the pattern of incidents is showing the characteristics of the cluster. Therefore, it is of great significance to identify China's outbound tourism safety incidents cluster and analyze their influencing factors. This study aims to identify the internal and external structural characteristics, spatial distribution, and contributing factors of China's outbound tourism safety incidents cluster. First, based on the 17746 safety incidents of China's outbound tourism from 2015 to 2019, this study uses the nearest neighbor index to identify China's outbound tourism safety incidents cluster. On this basis, using methods of diversity index, entropy, and spatial autocorrelation to measure and analyze the structure type, scale pressure, and spatial distribution characteristics of China's outbound tourism safety incidents cluster. At the same time, we use fuzzy-set qualitative comparative analysis (fsQCA) to discuss the causes of the complex configuration of a cluster. The findings are as follows: (1) A total of 60 destinations in the world have experienced clustered China's outbound tourism safety incidents from 2015 to 2019. Its type structure presents complex characteristics, including five incident categories and 38 incident subcategories, such as accident disaster, natural disaster, public health, social security, and business safety. Moreover, there are multiple consequences, such as personal injury, death, disappearance, detention, and property loss. The external pressure situation is serious. (2) The diversity and scale pressure of China's outbound tourism safety incidents cluster have obvious spatial correlation and unbalanced distribution characteristics. The internal structure type and scale pressure intensity of the tourism safety incidents cluster in Southeast Asia are more prominent. (3) The regional heterogeneity of diversity and scale pressure of China's outbound tourism safety incidents cluster is the result of the differential coupling of multiple risk factors of DPSBR. Among them, the higher industrial development status (S), higher the tourist behavior intensity (B), and lower basic environment drive (D) are the main reasons that lead to the higher complexity of the internal structure of each regional incident cluster. The higher industrial development status (S) and higher tourist behavior intensity (B) are the main reasons that lead to higher scale pressure. Over time, the higher security risk pressure (P) has become the key to form higher cluster diversity and higher scale pressure in various regions.
表1 目的地国家旅游安全事件集群密度判别Tab. 1 Discrimination of cluster density of tourism safety incidents in destination countries |
| 集聚程度 | 事件集群目的地国家 |
|---|---|
| 低集群密度 | 不丹 古巴 智利 摩洛哥 |
| 中低集群密度 | 巴西 芬兰 卡塔尔 肯尼亚 文莱 约旦 |
| 中集群密度 | 阿根廷 墨西哥 塞舌尔 突尼斯 以色列 |
| 中高集群密度 | 比利时 冰岛 斐济 秘鲁 南非 |
| 高集群密度 | 阿联酋 埃及 爱尔兰 奥地利 澳大利亚 丹麦 德国 俄罗斯 法国 菲律宾 韩国 荷兰 加拿大 柬埔寨 捷克 克罗地亚 老挝 马尔代夫 马来西亚 毛里求斯 美国 缅甸 尼泊尔 挪威 日本 瑞典 瑞士 斯里兰卡 泰国 土耳其 西班牙 希腊 新加坡 新西兰 匈牙利 意大利 印度 印度尼西亚 英国 越南 |
| ANOVA指标 | P=0.00;F=654.365;聚类:均方=0.355,df=4;误差:均方=0.001,df=55 |
表2 中国出境旅游安全事件集群的全局Moran's I估计值Tab. 2 Global Moran's I estimates of China's outbound tourism safety incidents cluster |
| 年份 | 中国出境旅游安全事件集群多样性 | 中国出境旅游安全事件集群规模压力 | |||||
|---|---|---|---|---|---|---|---|
| Moran's I | Z(I) | P 值 | Moran's I | Z(I) | P 值 | ||
| 2015 | 0.2494 | 4.1289 | 0.0020 | 0.0383 | 1.0849 | 0.0960 | |
| 2016 | 0.2530 | 4.1141 | 0.0020 | 0.0774 | 1.9256 | 0.0410 | |
| 2017 | 0.3366 | 5.5692 | 0.0010 | 0.2036 | 3.6946 | 0.0130 | |
| 2018 | 0.3208 | 5.2576 | 0.0010 | 0.0949 | 4.2624 | 0.0080 | |
| 2019 | 0.2733 | 4.4133 | 0.0020 | 0.2482 | 5.4841 | 0.0050 | |
表3 中国出境旅游安全事件集群致因评估指标构建Tab. 3 Construction of causation evaluation index of China's outbound tourism safety incidents cluster |
| 影响因素层 | 子维度层 | 指标操作层 | 数据来源 | 属性 | 2015年权重 | 2019年权重 |
|---|---|---|---|---|---|---|
| 基础环境驱动因素 | 经济环境驱动 | D1人均GDP | [68] | + | 0.275 | 0.300 |
| D2贸易占GDP比例 | [68] | + | 0.137 | 0.155 | ||
| 社会环境驱动 | D3总失业率 | [68] | - | 0.137 | 0.072 | |
| D4城镇化率 | [68] | + | 0.210 | 0.212 | ||
| D5贫困率 | [68] | - | 0.087 | 0.096 | ||
| 自然环境驱动 | D6气候变化/极端天气 | [68] | - | 0.105 | 0.110 | |
| D7温室气体排放总量 | [68] | - | 0.049 | 0.054 | ||
| 安全风险压力因素 | 自然风险压力 | P1自然受灾人数 | [69] | + | 0.100 | 0.101 |
| P2自然灾害死亡率 | [69] | + | 0.099 | 0.216 | ||
| 社会治安压力 | P3凶杀率 | [68] | + | 0.199 | 0.183 | |
| P4恐怖主义发生率 | [70] | + | 0.209 | 0.125 | ||
| 公共卫生压力 | P5意外中毒死亡率 | [68] | + | 0.129 | 0.131 | |
| 事故灾难压力 | P6道路交通死亡率 | [68] | + | 0.263 | 0.244 | |
| 产业发展现状因素 | 旅游资源规模 | S1旅游资源禀赋 | [71] | + | 0.357 | 0.369 |
| 旅游发展规模 | S2国际旅游收入 | [68] | + | 0.155 | 0.153 | |
| S3国际旅游人次 | [68] | + | 0.271 | 0.248 | ||
| 旅游结构占比 | S4国际旅游收入占出口总额的比例 | [68] | + | 0.217 | 0.230 | |
| 游客行为强度因素 | 中国旅游人次 | B1中国赴目的地旅游人次 | [72] | + | 0.163 | 0.151 |
| B2中国游客占入境游客比例 | [72] | + | 0.179 | 0.232 | ||
| 中国游客消费 | B3中国出境旅游消费 | [72] | + | 0.120 | 0.106 | |
| B4中国游客消费占入境旅游收入比例 | [72] | + | 0.172 | 0.241 | ||
| 游客时空特征 | B5中国游客平均移动距离 | [73] | + | 0.169 | 0.150 | |
| B6中国游客平均停留时间 | [74] | + | 0.198 | 0.120 | ||
| 安全响应保障因素 | 公共卫生保障 | R1卫生支出占国内生产总值的比例 | [68] | + | 0.129 | 0.130 |
| 社会治安保障 | R2警察服务可靠性 | [75] | + | 0.179 | 0.142 | |
| 人员素质保障 | R3员工培训水平 | [75] | + | 0.118 | 0.155 | |
| 基础设施保障 | R4航空载客量 | [68] | + | 0.065 | 0.072 | |
| R5互联网普及程度 | [68] | + | 0.156 | 0.147 | ||
| R6电力供应占比 | [68] | + | 0.047 | 0.062 | ||
| 政府治理效能 | R7政府效能水平 | [76] | + | 0.141 | 0.150 | |
| R8政府监管质量 | [76] | + | 0.166 | 0.143 |
表4 条件和结果变量校准信息Tab. 4 Calibration information of condition and outcome variables |
| 条件和结果变量 | 校准 | ||||||
|---|---|---|---|---|---|---|---|
| 完全不隶属于 | 交叉点 | 完全隶属 | |||||
| 2015年 | 集群多样性 | 0.000 | 1.099 | 2.573 | |||
| 集群规模压力 | 0.000 | 0.003 | 0.162 | ||||
| 基础环境驱动 | 0.287 | 0.534 | 0.750 | ||||
| 安全风险压力 | 0.151 | 0.280 | 0.456 | ||||
| 产业发展现状 | 0.038 | 0.104 | 0.467 | ||||
| 游客行为强度 | 0.064 | 0.124 | 0.356 | ||||
| 安全响应保障 | 0.194 | 0.472 | 0.784 | ||||
| 2019年 | 集群多样性 | 0.000 | 1.126 | 2.686 | |||
| 集群规模压力 | 0.000 | 0.002 | 0.123 | ||||
| 基础环境驱动 | 0.265 | 0.536 | 0.765 | ||||
| 安全风险压力 | 0.133 | 0.201 | 0.437 | ||||
| 产业发展现状 | 0.038 | 0.116 | 0.492 | ||||
| 游客行为强度 | 0.067 | 0.143 | 0.469 | ||||
| 安全响应保障 | 0.230 | 0.480 | 0.781 | ||||
表5 DPSBR风险因素必要条件分析Tab. 5 Necessary condition analysis of DPSBR risk factors |
| 前因条件变量 | 事件集群多样性 | 事件集群规模压力 | ||||
|---|---|---|---|---|---|---|
| 一致性 | 覆盖度 | 一致性 | 覆盖度 | |||
| 2015年 | 基础环境驱动 | 0.641923 | 0.576508 | 0.683983 | 0.501587 | |
| 基础环境驱动 | 0.540827 | 0.536842 | 0.638961 | 0.517895 | ||
| 安全风险压力 | 0.546483 | 0.503911 | 0.629004 | 0.473599 | ||
| 安全风险压力 | 0.669141 | 0.645634 | 0.705628 | 0.555935 | ||
| 产业发展现状 | 0.633439 | 0.649746 | 0.758009 | 0.634880 | ||
| 产业发展现状 | 0.588547 | 0.513572 | 0.673160 | 0.479642 | ||
| 游客行为强度 | 0.765288 | 0.778777 | 0.815152 | 0.677338 | ||
| 游客行为强度 | 0.496289 | 0.436025 | 0.589611 | 0.422982 | ||
| 安全响应保障 | 0.674797 | 0.591571 | 0.693074 | 0.496126 | ||
| 安全响应保障 | 0.494875 | 0.504869 | 0.573593 | 0.477822 | ||
| 2019年 | 基础环境驱动 | 0.602921 | 0.586389 | 0.651731 | 0.528576 | |
| 基础环境驱动 | 0.645041 | 0.638749 | 0.671283 | 0.554322 | ||
| 安全风险压力 | 0.605299 | 0.618321 | 0.635845 | 0.541638 | ||
| 安全风险压力 | 0.610734 | 0.576652 | 0.639104 | 0.503207 | ||
| 产业发展现状 | 0.659987 | 0.700685 | 0.714053 | 0.632167 | ||
| 产业发展现状 | 0.630774 | 0.575457 | 0.683503 | 0.519988 | ||
| 游客行为强度 | 0.698370 | 0.763461 | 0.791446 | 0.721500 | ||
| 游客行为强度 | 0.578804 | 0.515271 | 0.617515 | 0.458422 | ||
| 安全响应保障 | 0.627717 | 0.575880 | 0.662322 | 0.506700 | ||
| 安全响应保障 | 0.569294 | 0.600502 | 0.586966 | 0.516303 | ||
注:斜体字表示逻辑运算的“非”。 |
表6 2015年和2019年中国出境旅游安全事件集群多样性组态致因构型Tab. 6 Cause configuration of diversity configuration of China's outbound tourism safety incidents cluster in 2015 and 2019 |
| 构型 | 原始覆盖度 | 唯一覆盖度 | 一致性 | 典型国家 | |
|---|---|---|---|---|---|
| 2015年 | M1: 基础环境驱动*安全风险压力*产业发展现状*游客行为强度 | 0.288795 | 0.070342 | 0.852818 | 马尔代夫 希腊 |
| M2: 基础环境驱动*产业发展现状*游客行为强度*安全响应保障 | 0.404737 | 0.186285 | 0.850037 | 越南 泰国 | |
| 总体一致性:0.851711 | 总体覆盖度:0.47508 | ||||
| 2019年 | M3: 基础环境驱动*产业发展现状*游客行为强度*安全响应保障 | 0.309103 | 0.119565 | 0.819082 | 马尔代夫 泰国 |
| M4: 基础环境驱动*安全风险压力*游客行为强度*安全响应保障 | 0.285326 | 0.032609 | 0.834161 | 美国 新西兰 | |
| M5: 基础环境驱动*安全风险压力*游客行为强度*安全响应保障 | 0.355299 | 0.083899 | 0.870216 | 菲律宾 印度尼西亚 | |
| 总体一致性:0.805391 | 总体覆盖度:0.50747 | ||||
注:M1~M5分别表示作用路径1~5;“*”表示逻辑“和”;斜体字表示逻辑“非”;黑体字表示“核心条件”。 |
表7 2015年和2019年中国出境旅游安全事件集群规模压力组态致因构型Tab. 7 Cause configuration of scale pressure configuration of China's outbound tourism safety incidents cluster in 2015 and 2019 |
| 构型 | 原始覆盖度 | 唯一覆盖度 | 一致性 | 典型国家 | |
|---|---|---|---|---|---|
| 2015年 | H1: 安全风险压力*产业发展现状*游客行为强度*安全响应保障 | 0.446753 | 0.015584 | 0.828251 | 澳大利亚、法国 |
| H2: 基础环境驱动*产业发展现状*游客行为强度*安全响应保障 | 0.479654 | 0.048484 | 0.822569 | 日本、韩国 | |
| 总体一致性:0.813078 | 总体覆盖度:0.49524 | ||||
| 2019年 | H3: 基础环境驱动*安全风险压力*游客行为强度*安全响应保障 | 0.336049 | 0.042362 | 0.819265 | 马来西亚、新西兰 |
| H4: 基础环境驱动*产业发展现状*游客行为强度*安全响应保障 | 0.410591 | 0.116904 | 0.838602 | 日本、韩国 | |
| 总体一致性:0.805214 | 总体覆盖度:0.45295 | ||||
注:H1~H4分别表示作用路径1~4;“*”表示逻辑“和”;斜体字表示逻辑“非”;黑体字表示“核心条件”。 |
真诚感谢匿名评审专家在论文评审中所付出的时间和精力,评审专家对本文文献综述、指标选取、图文展示、研究讨论方面的修改意见,使本文获益匪浅。
| [1] |
殷杰, 郑向敏, 李实. 合作态势与权力角色: “一带一路”沿线国家旅游合作网络解构. 经济地理, 2019, 39(7): 216-224.
[
|
| [2] |
蒋依依, 温晓金, 刘焱序.2001-2015 年中国出境旅游流位序规模演化特征. 地理学报, 2018, 73(12): 2468-2480.
[
|
| [3] |
|
| [4] |
|
| [5] |
|
| [6] |
|
| [7] |
|
| [8] |
|
| [9] |
|
| [10] |
|
| [11] |
|
| [12] |
李月调, 谢朝武. 赴泰中国游客安全事故时空分布研究. 中国安全科学学报, 2016, 26(6): 169-174.
[
|
| [13] |
黄锐, 谢朝武. 中国赴东盟地区旅游安全事故风险因子的组态影响探测: 基于HEVP框架的模糊集定性比较分析. 经济地理, 2021, 41(7): 202-212.
[
|
| [14] |
朱尧, 邹永广. 中国游客赴欧洲旅游安全感知事件空间特征研究. 地域研究与开发, 2019, 38(6):74-79.
[
|
| [15] |
刘浩龙, 葛全胜, 席建超. 区域旅游资源的灾害风险评估: 以内蒙古克什克腾旗为例. 资源科学, 2007, 29(1): 118-125.
[
|
| [16] |
方雪, 谢朝武, 黄锐. 扎根理论下国内漂流旅游安全事故成因机制. 中国安全科学学报, 2022, 32(4): 23-29.
[
|
| [17] |
邹永广. 旅游安全评价: 研究现状与述评. 旅游学刊, 2020, 35(7): 133-146.
[
|
| [18] |
|
| [19] |
肖爱连, 吴孝政. 事故因果连锁、PSR框架与旅游安全评价. 求索, 2009, 29(5): 77-79.
[
|
| [20] |
谢朝武, 黄锐, 陈岩英. “一带一路”倡议下中国出境游客的安全保障: 需求、困境与体系建构研究. 旅游学刊, 2019, 34(3): 41-56.
[
|
| [21] |
黄锐, 谢朝武, 赖菲菲. 中国游客赴东盟地区旅游安全风险: 特征、成因及治理路径. 广西社会科学, 2022, 38(5): 70-80.
[
|
| [22] |
邹雅真, 谢朝武. 大陆游客赴台旅游安全事件结果特征及其引致因素研究. 旅游学刊, 2016, 31(8): 81-89.
[
|
| [23] |
黄锐, 谢朝武. 中国出境旅游安全事故时空分布格局及形成机制. 人文地理, 2019, 34(6): 120-128.
[
|
| [24] |
谢朝武, 黄锐. 目的地旅游安全事件集群: 概念框架与测度体系研究. 旅游学刊, 2022.
[
|
| [25] |
罗冬晖. 关于旅游保险发展的思考. 云南财经大学学报, 2008, 23(5): 112-116.
[
|
| [26] |
|
| [27] |
孟斌, 王劲峰, 张文忠, 等. 基于空间分析方法的中国区域差异研究. 地理科学, 2005, 25(4):11-18.
[
|
| [28] |
林兰. 重化工业集群式创新机制与空间响应研究. 地理学报, 2016, 71(8): 1400-1415.
[
|
| [29] |
申庆喜, 李诚固, 周国磊, 等. 2002-2012年长春市城市功能空间耦合研究. 地理研究, 2015, 34(10): 1897-1910.
[
|
| [30] |
李航, 李雪铭, 田深圳, 等. 城市人居环境的时空分异特征及其机制研究: 以辽宁省为例. 地理研究, 2017, 36(7):1323-1338.
[
|
| [31] |
|
| [32] |
周磊, 黄麒, 魏玖长. 基于组态视角的突发事件应急信息传播效果研究: 以“安徽疾控”为例. 公共管理与政策评论, 2021, 10(6): 79-92.
[
|
| [33] |
张明, 杜运周. 组织与管理研究中QCA方法的应用: 定位、策略和方向. 管理学报, 2019, 16(9): 1312-1323.
[
|
| [34] |
张明, 陈伟宏, 蓝海林. 中国企业“凭什么”完全并购境外高新技术企业: 基于94个案例的模糊集定性比较分析(fsQCA). 中国工业经济, 2019, 36(4): 117-135.
[
|
| [35] |
张子昂, 保继刚. 多重距离对中国入境与出境旅游流的影响: 基于组态的视角. 地理科学, 2021, 41(1): 13-21.
[
|
| [36] |
|
| [37] |
潘竟虎, 李俊峰. 中国A级旅游景点空间结构的计量地理分析. 经济地理, 2013, 33(9): 154-160.
[
|
| [38] |
谢朝武, 张俊, 陈岩英. 中国出境旅游安全风险的区域分布研究. 中国安全科学学报, 2018, 28(1): 155-160.
[
|
| [39] |
高恩新. 特大生产安全事故的归因与行政问责: 基于65份调查报告的分析. 公共管理学报, 2015, 12(4): 58-70.
[
|
| [40] |
仝川. 环境指标研究进展与分析. 环境科学研究, 2000, 13(4): 53-55.
[
|
| [41] |
|
| [42] |
|
| [43] |
张家其, 吴宜进, 葛咏, 等. 基于灰色关联模型的贫困地区生态安全综合评价: 以恩施贫困地区为例. 地理研究, 2014, 33(8): 1457-1466.
[
|
| [44] |
|
| [45] |
朱传波, 汪政. 非常规突发事件应急管理中的情景分析框架与方法研究. 科技管理研究, 2013, 33(22): 225-227.
[
|
| [46] |
彭建, 吴健生, 潘雅婧, 等. 基于PSR模型的区域生态持续性评价概念框架. 地理科学进展, 2012, 31(7):933-940.
[
|
| [47] |
王国萍, 闵庆文, 丁陆彬, 等. 基于PSR模型的国家公园综合灾害风险评估指标体系构建. 生态学报, 2019, 39(22):8232-8244.
[
|
| [48] |
杨海峰, 翟国方. 灾害风险视角下的城市安全评估及其驱动机制分析: 以滁州市中心城区为例. 自然资源学报, 2021, 36(9): 2368-2381.
[
|
| [49] |
左伟, 王桥, 王文杰, 等. 区域生态安全评价指标与标准研究. 地理学与国土研究, 2002, 18(1): 67-71.
[
|
| [50] |
崔馨月, 方雷, 王祥荣, 等. 基于DPSIR模型的长三角城市群生态安全评价研究. 生态学报, 2021, 41(1): 302-319.
[
|
| [51] |
王群, 杨万明, 朱跃, 等. 贫困区旅游地社会-生态系统恢复力时空分异研究: 以安徽境内大别山区12个贫困县(市)为例. 地理科学, 2021, 41(6): 1030-1038.
[
|
| [52] |
|
| [53] |
|
| [54] |
|
| [55] |
|
| [56] |
|
| [57] |
李宁, 张正涛, 陈曦, 等. 论自然灾害经济损失评估研究的重要性. 地理科学进展, 2017, 36(2): 256-263.
[
|
| [58] |
杨钦钦, 谢朝武. 游客微-宏观安全感知与出游意愿的互动效应: 基于巴黎恐袭的案例研究. 旅游学刊, 2018, 33(5):68-78.
[
|
| [59] |
席建超, 刘浩龙, 齐晓波, 等. 旅游地安全风险评估模式研究: 以国内10条重点探险旅游线路为例. 山地学报, 2007, 25(3): 370-375.
[
|
| [60] |
|
| [61] |
周露, 孙根年. 20年来中日韩三国出入境旅游互动关系分析. 干旱区资源与环境, 2014, 28(1): 175-182.
[
|
| [62] |
|
| [63] |
方叶林, 黄震方, 段忠贤, 等. 中国旅游业发展与生态环境耦合协调研究. 经济地理, 2013, 33(12): 195-201.
[
|
| [64] |
许晖, 许守任, 王睿智. 消费者旅游感知风险维度识别及差异分析. 旅游学刊, 2013, 28(12): 71-80.
[
|
| [65] |
|
| [66] |
张西林. 旅游安全事故成因机制初探. 经济地理, 2003, 23(4): 542-546.
[
|
| [67] |
|
| [68] |
世界银行(IBRD).2015年和2019年全球发展指数. https://databank.worldbank.org/2022-05-29.
[International Bank for Reconstruction and Development. World development indicators in 2015 and 2019. https://databank.worldbank.org/2022-05-29.]
|
| [69] |
健康指标与评估研究所(IHME). 2015年和2019年全球自然受灾人数、自然受灾死亡率. https://www.healthdata.org/2022-05-30.
[Institute for Health Metrics and Evaluation. Global number of people affected by natural disasters and deaths from natural disasters in 2015 and 2019. https://www.healthdata.org/2022-05-30.]
|
| [70] |
全球恐怖主义数据库(GTD). 2015年和2019年全球恐怖主义发生率. https://www.start.umd.edu/data-tools/global-terrorism-database-gtd2022-05-30.
[Global Terrorism Database. Global incidence of terrorism in 2015 and 2019. https://www.start.umd.edu/data-tools/global-terrorism-database-gtd2022-05-30.]
|
| [71] |
联合国教科文组织(UNESCO). 2015年和2019年全球旅游资源状况. https://www.unesco.org/en2022-05-30.
[United Nations Educational, Scientific, and Cultural Organization. The state of global tourism resources in 2015 and 2019. https://www.unesco.org/en2022-05-30.]
|
| [72] |
欧睿国际数据库(EI). 2015年和2019年中国出境旅游人数和消费. https://www.euromonitor.com/2022-05-30.
[
|
| [73] |
法国国际展望与信息研究中心(CEPII). 两个国家间的地理距离数据. http://www.cepii.fr/CEPII/en/welcome.asp2022-05-30.
[Centre détudes prospectives et d'informations internationals. Geographic distance data between two countries. http://www.cepii.fr/CEPII/en/welcome.asp2022-05-30.]
|
| [74] |
旅行社责任保险统保示范项目. 2015年和2019年中国出境旅游意外保险. https://www.chinatourins.com/#/home2022-05-30.
[Unified Insurance Demonstration Project of Travel Agency Liability Insurance. Accident insurance for Chinese outbound travel in 2015 and 2019. https://www.chinatourins.com/#/home2022-05-30.]
|
| [75] |
世界经济论坛(WEF). 2015年和2019年旅游竞争力报告. https://www.weforum.org/2022-05-30.
[World Economic Forum. The travel & tourism competitiveness report 2015 and the travel & tourism competitiveness report 2019. https://www.weforum.org/2022-05-30.]
|
| [76] |
世界银行(IBRD). 2015年和2019年全球治理指数. https://databank.worldbank.org/2022-05-29.
[International Bank for Reconstruction and Development. Worldwide governance indicators in 2015 and 2019. https://databank.worldbank.org/2022-05-29.]
|
| [77] |
牛晓晨, 邢源源, 孟凡臣. 跨国技术并购因素组态与创新绩效因果关系研究: 基于模糊集定性比较分析. 中国软科学, 2020, 35(8):20-35.
[
|
| [78] |
|
| [79] |
杜运周, 贾良定. 组态视角与定性比较分析(QCA): 管理学研究的一条新道路. 管理世界, 2017, 33(6): 155-167.
[
|
| [80] |
|
| [81] |
黄锐, 谢朝武. 压力、状态与响应: 疫情危机下酒店员工职业前景认知的组态影响研究. 旅游学刊, 2021, 36(9): 103-119.
[
|
| [82] |
殷杰, 郑向敏. 高聚集游客群系统的结构解析与运行机理: 理论与实践双重视角的研究. 经济管理, 2018, 40(8): 120-134.
[
|
/
| 〈 |
|
〉 |