
围垦后滨海湿地水土盐度对土地利用时空演变的响应
|
贾悦(1999-),女,山东威海人,硕士研究生,主要从事滨海湿地景观生态应用研究。 E-mail: jiayuee0626@163.com |
收稿日期: 2022-08-17
录用日期: 2023-03-06
网络出版日期: 2023-07-04
基金资助
国家自然科学基金项目(41871188)
国家自然科学基金项目(31971547)
国家自然科学基金项目(42006183)
Response of soil and water salinity to land use evolution in reclaimed coastal wetland
Received date: 2022-08-17
Accepted date: 2023-03-06
Online published: 2023-07-04
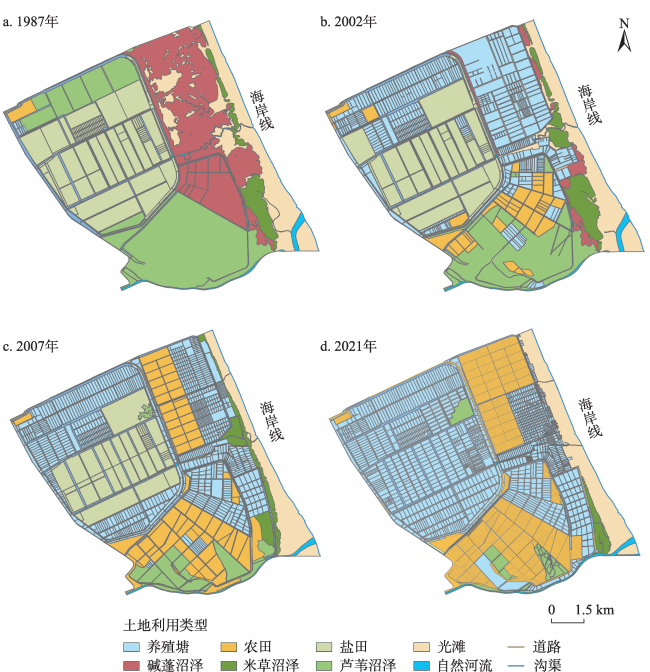
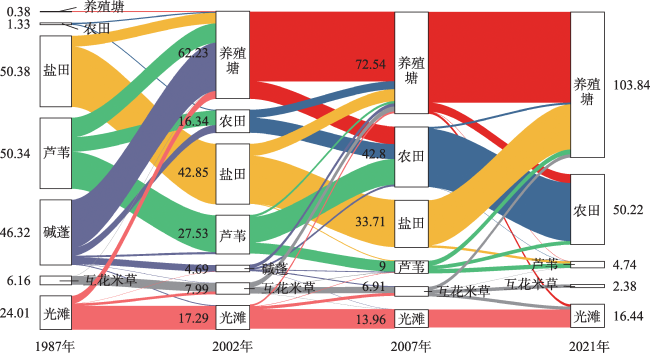
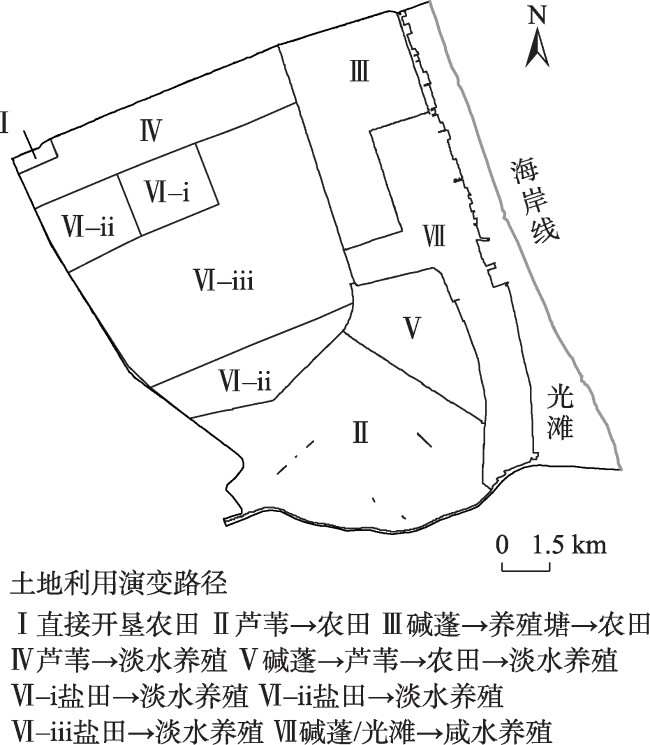
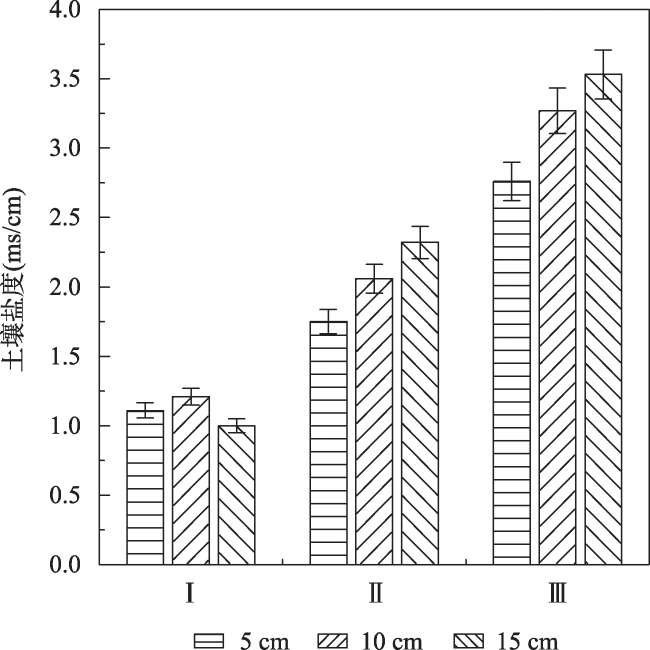
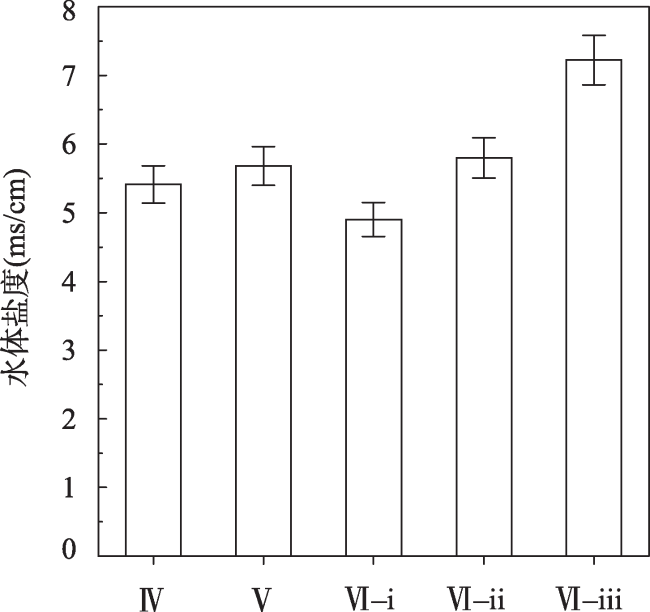
滨海湿地水盐关系复杂,盐度空间梯度是影响土壤、水体指标和生物生长的关键因子。本文选取1987—2021年遥感影像,分析江苏盐城国家级珍禽自然保护区北部土地利用时空演变规律与盐度变化之间的关系。结果表明:① 按照围垦目标(农田、淡水养殖、咸水养殖)与围垦时间,将1987—2021年土地利用演变路径划分为七大类。② 随着围垦历时的延长和土地利用变化,土壤与水体盐度均逐渐降低;土壤盐度波动趋于平稳且剖面层呈现聚集—波动均匀—均匀的分布特征。③ 农田围垦目标路径下,土壤盐度由低到高依次为Ⅰ(直接农田型)<Ⅱ(芦苇→农田型)<Ⅲ(碱蓬→养殖塘→农田型);从土壤盐度剖面类型来看,Ⅱ路径是聚集型,Ⅰ与Ⅲ路径均是波动均匀型。④ 养殖塘演变路径下,水体盐度由低到高依次是Ⅳ(芦苇→淡水养殖型)<Ⅴ(碱蓬→芦苇→农田→淡水养殖型)<Ⅵ(盐田→淡水养殖型)<Ⅶ(碱蓬/光滩→咸水养殖型)。本文可为围垦后的滨海湿地滩涂实现高效率土地利用和可持续发展提供参考。
贾悦 , 李玉凤 , 张玥 , 王雨青 , 周诗薇 , 刘红玉 . 围垦后滨海湿地水土盐度对土地利用时空演变的响应[J]. 地理研究, 2023 , 42(7) : 1892 -1903 . DOI: 10.11821/dlyj020220873
The relationship between water and salt in coastal wetlands was complex, and the spatial gradient of salinity was the key factor which affected soil, water indicators and biological growth. In this study, remote sensing images were selected to analyze the relationship between land use evolution and salinity change from 1987 to 2021. The results indicated that: (1) Based on the spatial land use change and land use transfer matrix from 1987 to 2021, and according to the goals and years of reclamation, the study area was divided into seven paths of the land use evolution, respectively I (direct farmland type), II (reed → farmland type), III (alkali → breeding pond → farmland type), IV (reed →freshwater aquaculture type), V (Suaeda → reed→ farmland →fresh-water aquaculture type), VI (salt pan → freshwater aquaculture type) and VII (Suaeda/light beach → saltwater aquaculture type). Further, due to different periods of evolution, VI paths are divided into VI-i (salt pan →freshwater aquaculture 24 years type), VI-ii (salt pan →freshwater aquaculture16 years type), and VI-iii (salt pan →freshwater aquaculture 10 years type). (2) With the increase of distance from the sea, the extension of the reclamation period and land use changes, the salinity of soil and water gradually decreased. The fluctuation of soil salinity tended to be stable normally, and the profile layer of soil salinity showed the aggregation-fluctuation-uniform distribution. (3) Under the target path of farmland reclamation, the soil salinity from low to high was I, II and III paths. The profile type II of soil salinity profile was clustered, and the I and III paths were fluctuating uniform. (4) Under the evolution path of the aquaculture pond, the salinity of the water from low to high was IV, V, VI and VII paths, and the causes were more evident in the evolution of land use by human intervention, in addition to the distance from the sea. The influence mechanism of salinity spatial distribution in coastal wetlands mainly included natural background factors and human activity factors. In the exploration of the background factors, we found that the distance of the sea determined the salinity distribution. This study revealed the relationship between the evolution of land use and soil and water salinity in reclaimed coastal wetlands to provide a reference for ecological restoration and sustainable development of coastal wetlands.
Key words: land use evolution; salinity changes; reclamation period; coastal wetland
表1 各期遥感影像数据来源Tab. 1 Remote sensing image data sources by period |
| 序号 | 卫星平台 | 传感器 | 轨道号 | 成像时间(年/月/日) |
|---|---|---|---|---|
| 1 | Landsat 5 | TM | 119037 | 1987/04/23 |
| 2 | Landsat 5 | TM | 119037 | 2002/09/23 |
| 3 | Landsat 7 | ETM | 119037 | 2007/05/08 |
| 4 | Landsat 8 | OLI | 119037 | 2021/10/13 |
表2 盐度剖面类型划分Tab. 2 Salinity profile type classification |
| 类型 | 表聚系数与底聚系数之差 | 变异系数 |
|---|---|---|
| 聚集型 | ≥0.12 | ≥0.30 |
| 波动聚集型 | 0.10~0.15 | 0.0~0.80 |
| 临界聚集型 | 0.05~0.10 | 0.30~0.50 |
| 震荡型 | ≤0.10 | ≥0.40 |
| 均匀型 | ≤0.05 | ≤0.25 |
| 波动均匀型 | ≤0.06 | 0.15~0.40 |
表3 1987—2021年土地利用演变路径与距海距离Tab. 3 Land use evolution path and distance from sea from 1987 to 2021 |
| 围垦目标 | 土地利用演变路径 | 围垦年限(年) | 质心法距海 距离(km) | 最小距离法距海 距离(km) |
|---|---|---|---|---|
| 农田 | Ⅰ 直接开垦农田 | 1981—2021年(40) | 12.4 | 12.0 |
| Ⅱ 芦苇→农田 | 1987—2021年(34) | 5.6 | 1.6 | |
| Ⅲ 碱蓬→养殖塘→农田 | 1998—2021年(23) | 2.4 | 0.9 | |
| 淡水养殖 | Ⅳ 芦苇→淡水养殖 | 1981—2021年(40) | 8.3 | 4.2 |
| Ⅴ 碱蓬→芦苇→农田→淡水养殖 | 1987—2021年(34) | 2.8 | 1.3 | |
| Ⅵ-i 盐田→淡水养殖 | 1981—2021年(40) | 7.6 | 7.0 | |
| Ⅵ-ii 盐田→淡水养殖 | 1981—2021年(40) | 9.0 | 4.5 | |
| Ⅵ-iii 盐田→淡水养殖 | 1981—2021年(40) | 8.7 | 4.2 | |
| 咸水养殖 | Ⅶ 碱蓬/光滩→咸水养殖 | 1998—2021年(23) | 1.1 | 0.1 |
表4 养殖目标下不同围垦年限下水体盐度统计值Tab. 4 Statistical values of salinity of water bodies in different years of reclamation under aquaculture goals |
| 围垦年限(年) | 最大值 (ms/cm) | 最小值 (ms/cm) | 平均值 (ms/cm) | 标准差 | 变异系数 |
|---|---|---|---|---|---|
| 1998—2021年(23) | 24.60 | 22.40 | 23.60 | 0.89 | 0.04 |
| 1987—2021年(34) | 5.88 | 5.44 | 5.67 | 0.23 | 0.04 |
| 1981—2021年(40) | 5.67 | 4.95 | 5.31 | 0.37 | 0.07 |
表5 农田目标下不同围垦年限下土壤盐度统计值Tab. 5 Statistical values of soil salinity in different years of reclamation under farmland goals |
| 围垦年限(年) | 最大值(ms/cm) | 最小值(ms/cm) | 平均值 (ms/cm) | 标准差 | 变异系数 | 表聚系数 | 底聚系数 | 剖面类型 |
|---|---|---|---|---|---|---|---|---|
| 1998—2021年(23) | 4.12 | 1.11 | 2.67 | 0.79 | 0.30 | 0.40 | 0.59 | 聚集 |
| 1987—2021年(34) | 3.33 | 0.87 | 1.56 | 0.54 | 0.34 | 0.29 | 0.37 | 波动均匀 |
| 1981—2021年(40) | 1.34 | 0.91 | 1.11 | 0.13 | 0.11 | 0.33 | 0.30 | 均匀 |
图5 农田不同演变路径下土壤盐度随深度变化差异Fig. 5 Differences in soil salinity of farm land with depth under different evolution paths |
表6 不同围垦转移路径下采样点土壤盐度统计值Tab. 6 Statistical values of soil salinity at sampling points under different reclamation transfer path |
| 演变路径 | 最大值(ms/cm) | 最小值(ms/cm) | 平均值(ms/cm) | 标准差 | 变异系数 | 表聚系数 | 底聚系数 | 剖面类型 |
|---|---|---|---|---|---|---|---|---|
| Ⅰ | 1.35 | 0.87 | 1.11 | 0.18 | 0.16 | 0.49 | 0.43 | 波动均匀 |
| Ⅱ | 3.33 | 1.37 | 2.04 | 0.62 | 0.30 | 0.40 | 0.61 | 聚集型 |
| Ⅲ | 4.12 | 2.40 | 3.07 | 0.45 | 0.15 | 0.41 | 0.59 | 波动均匀 |
真诚感谢匿名审稿专家在论文评审中付出的时间和精力,评审专家对本文研究综述、逻辑结构、语法表达等方面提出的诸多具体建议,使本文获益匪浅。
| [1] |
|
| [2] |
王磊, 何冬梅, 江浩, 等. 江苏滨海湿地生态系统服务功能价值评估. 生态科学, 2016, 35(5): 169-175.
[
|
| [3] |
|
| [4] |
张晓祥, 严长清, 徐盼, 等. 近代以来江苏沿海滩涂围垦历史演变研究. 地理学报, 2013, 68(11): 1549-1558.
[
|
| [5] |
许艳, 濮励杰, 张润森, 等. 江苏沿海滩涂围垦耕地质量演变趋势分析. 地理学报, 2017, 72(11): 2032-2046.
[
|
| [6] |
张长宽, 陈君, 林康, 等. 江苏沿海滩涂围垦空间布局研究. 河海大学学报(自然科学版), 2011, 39(2): 206-212.
[
|
| [7] |
|
| [8] |
|
| [9] |
|
| [10] |
|
| [11] |
|
| [12] |
|
| [13] |
|
| [14] |
方仁建, 沈永明, 时海东. 基于围垦特征的海滨地区景观格局变化研究: 以盐城海岸为例. 生态学报, 2015, 35(3): 641-651.
[
|
| [15] |
刘奕琳. 盐城海滨湿地生态系统的研究. 南京: 南京林业大学硕士学位论文, 2006: 39-40.
[
|
| [16] |
宫宁, 牛振国, 齐伟, 等. 中国湿地变化的驱动力分析. 遥感学报, 2016, 20(2): 172-183.
[
|
| [17] |
严长清, 孙伟, 陆效平, 等. 江苏省沿海滩涂土地利用与生态保护研究. 生态科学, 2007, 26(3): 263-268.
[
|
| [18] |
姜群鸥, 孙驷阳, 邓祥征, 等. 土地利用动态变化定量模拟方法的适用性评价. 应用基础与工程科学学报, 2019, 27(2): 295-311.
[
|
| [19] |
王力, 牛铮, 尹君, 等. 基于遥感技术的小城镇土地利用变化分析: 以黄骅镇为例. 资源科学, 2006, 28(5): 68-75.
[
|
| [20] |
刘瑞, 朱道林. 基于转移矩阵的土地利用变化信息挖掘方法探讨. 资源科学, 2010, 32(8): 1544-1550.
[
|
| [21] |
李鹏, 濮励杰, 朱明, 等. 江苏沿海不同时期滩涂围垦区土壤剖面盐分特征分析: 以江苏省如东县为例. 资源科学, 2013, 35(4): 764-772.
[
|
| [22] |
|
| [23] |
李红丽, 丁国栋, 董智, 等. 中捷农场滨海盐碱地立地类型划分及其植被恢复技术. 中国水土保持科学, 2010, 8(5): 86-91.
[
|
| [24] |
张华兵, 刘红玉, 李玉凤, 等. 自然条件下盐城海滨湿地土壤水分/盐度空间分异及其与植被关系研究. 环境科学, 2013, 34(2): 540-546.
[
|
| [25] |
姚荣江, 杨劲松, 刘广明, 等. 黄河三角洲地区典型地块土壤盐分空间变异特征研究. 农业工程学报, 2006, 22(6): 61-66.
[
|
| [26] |
|
| [27] |
解雪峰, 濮励杰, 朱明, 等. 基于典范对应分析的滨海滩涂围垦区景观格局与土壤盐渍化关系. 地理研究, 2017, 36(3): 495-505.
[
|
| [28] |
|
| [29] |
|
| [30] |
|
| [31] |
|
| [32] |
邹晓霞, 王维华, 王建林, 等. 垦殖与自然条件下黄河三角洲土壤盐分的时空演化特征研究. 水土保持学报, 2017, 31(2): 309-316.
[
|
| [33] |
景宇鹏, 连海飞, 李跃进, 等. 河套盐碱地不同利用方式土壤盐碱化特征差异分析. 水土保持学报, 2020, 34(4): 354-363.
[
|
/
| 〈 |
|
〉 |