
长江上游地区生态恢复程度及植被恢复潜力空间差异分析
|
张雄一(1995-),男,河南泌阳人,博士研究生,研究方向为GIS应用与生态环境评估。E-mail: zhangxy.20b@igsnrr.ac.cn |
收稿日期: 2022-09-27
录用日期: 2023-02-02
网络出版日期: 2023-07-04
基金资助
国家社会科学基金重大项目(20&ZD096)
Spatial difference analysis of ecological restoration degree and vegetation restoration potential in the upper reaches of the Yangtze River
Received date: 2022-09-27
Accepted date: 2023-02-02
Online published: 2023-07-04
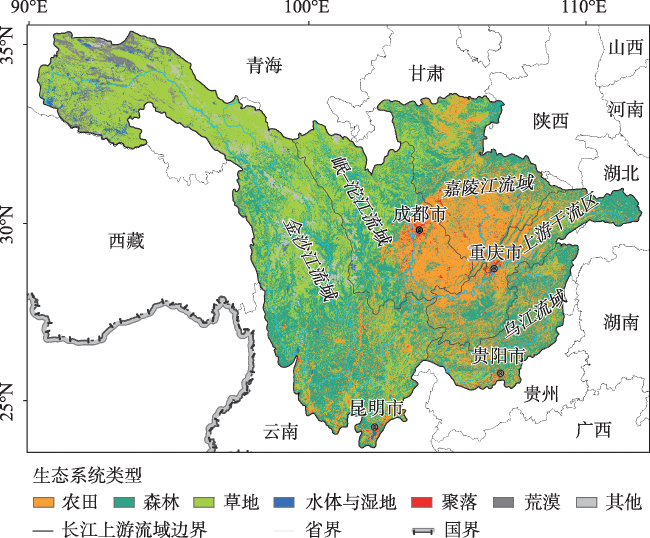
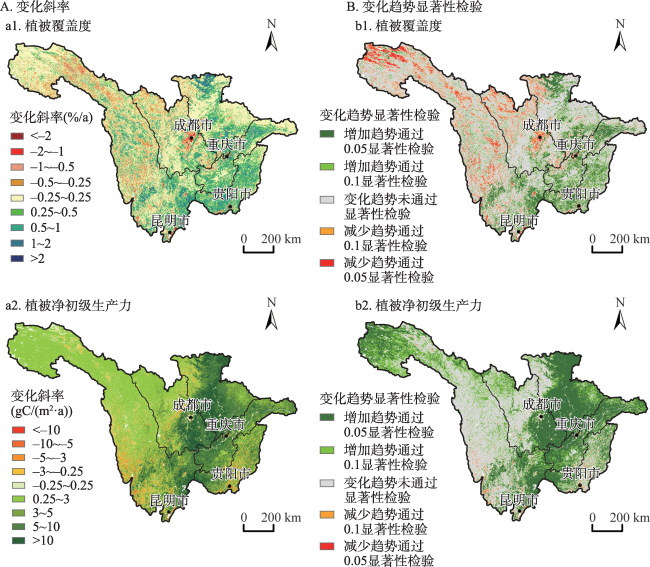
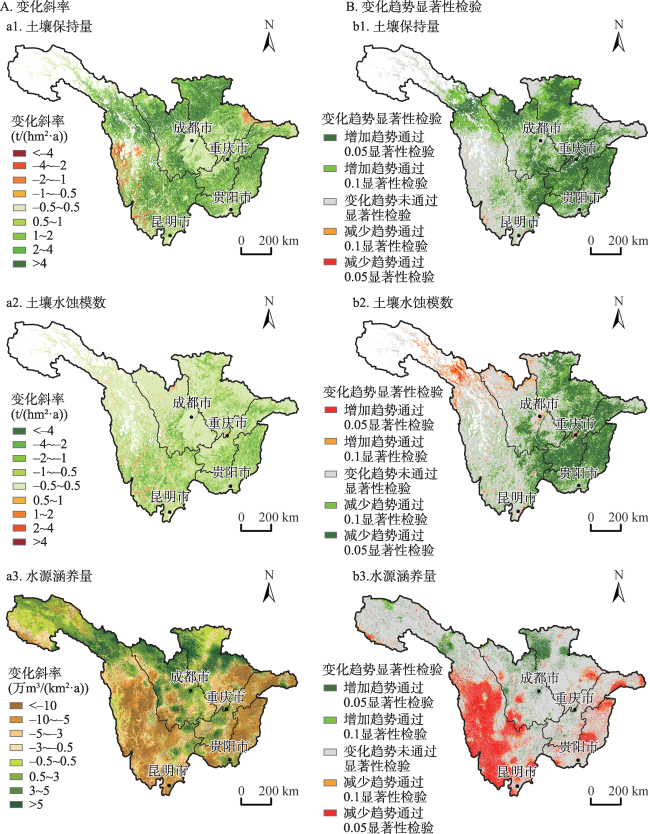
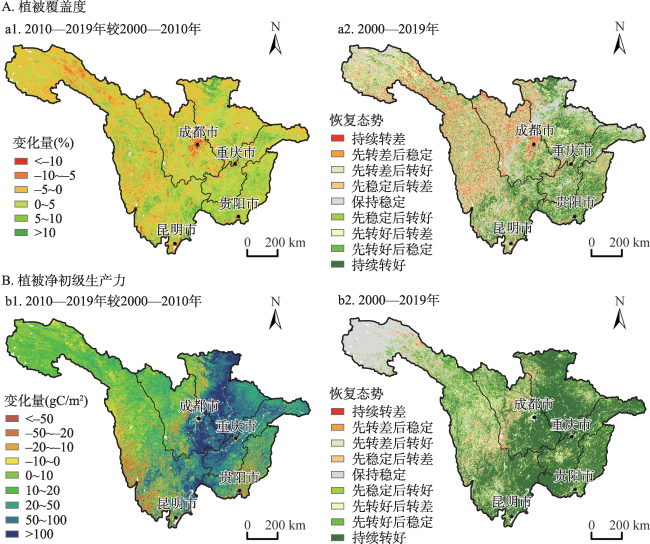
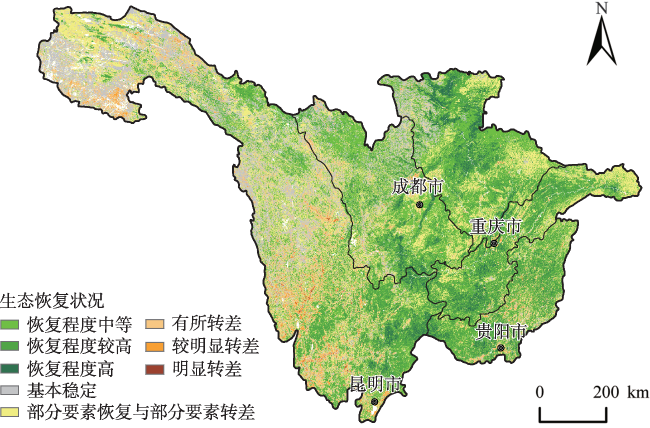
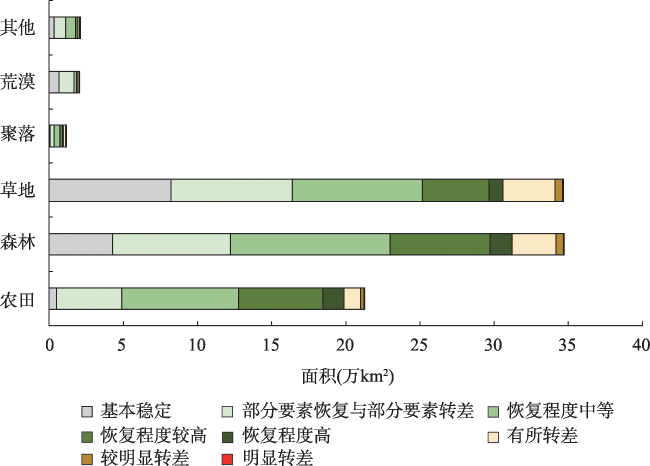
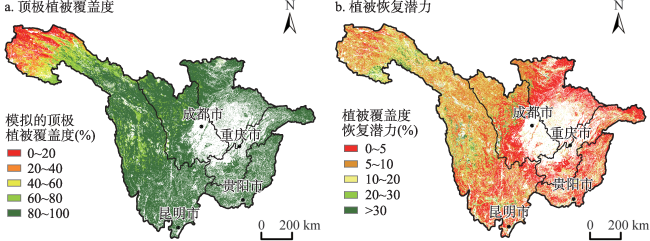
长江上游地区是长江流域生态安全屏障关键区,是长江流域土壤保持和水源涵养的重要功能区,对中国西部地区和长江经济带的发展起着重要作用,定量分析长江上游地区生态恢复程度及植被恢复潜力,对于保障国家生态安全具有重要意义。本文基于气象、土壤、遥感等多源数据,结合模型模拟从生态系统质量和生态系统服务两方面量化了2000—2019年长江上游地区生态恢复程度及空间差异,厘定了气候要素与人类活动对长江上游地区生态系统变化的贡献程度,并探究了植被恢复潜力,结果表明:① 长江上游地区生态系统质量整体向好发展,植被覆盖度和植被净初级生产力均呈稳定增加态势,增速分别为0.15 %/a、3.77 gC/(m2·a);生态系统服务增减有所差异,土壤保持量呈逐年增加趋势,增速为2.72 t/(hm2·a),水源涵养量呈逐年下降趋势,年均减少2.37万m3/km2。② 生态系统整体呈恢复转好态势,但仍存在面积占9.76%的区域生态系统状况变差。生态恢复程度较高的区域主要分布在长江上游地区的东部和南部金沙江流域与乌江流域交界区域。较明显转差区域主要分布在西部的金沙江流域。③ 气候要素是影响长江上游地区生态系统变化的主要因素,气候要素和人类活动对生态系统变化的贡献率分别为78.78%和21.22%。④ 长江上游地区森林、草地、荒漠生态系统仍有8.73%的恢复潜力,位于金沙江流域和岷-沱江流域的青藏高原部分区域恢复潜力较大。本研究通过定量化评估生态恢复状况及植被恢复潜力,可为长江上游地区的生态环境建设和管理提供决策参考。
张雄一 , 邵全琴 , 宁佳 , 刘树超 , 牛丽楠 , 杨雪清 , 黄海波 . 长江上游地区生态恢复程度及植被恢复潜力空间差异分析[J]. 地理研究, 2023 , 42(7) : 1904 -1920 . DOI: 10.11821/dlyj020221028
The upper reaches of the Yangtze River are important functional areas for soil and water conservation and play a crucial role in the development of western China and the Yangtze River Economic Belt. Therefore, it is necessary to conduct quantitative analyses of ecological restoration degree and vegetation restoration potential for national ecological security. Based on meteorological, soil, remote sensing and other multi-source data, combined with model simulations, this study quantified the degree of ecological restoration and spatial differences from 2000 to 2019 from the perspectives of ecosystem quality and ecosystem services, determined the contribution rate of climatic factors and human activities to ecosystem changes, and explored the potential of vegetation restoration. The research results showed that: (1) The quality of the ecosystem has been improving in the upper reaches of the Yangtze River, and the vegetation coverage and net primary productivity of vegetation increased steadily, with growth rates of 0.15%/a and 3.77 g C/m²/a. There were differences in the increase and decrease of ecosystem services. Soil conservation increased, with a growth rate of 2.72 t/hm²/a, and water conservation decreased year by year, with an annual reduction of 23,700 m³/km². (2) The ecosystem as a whole was recovering and improving, but there was still a deterioration of the ecosystem, which accounted for 9.76% of the study area. The areas with higher ecological degree recovery were mainly distributed in the eastern and southern parts (the junction of the Jinsha River Basin and the Wujiang River Basin) of the study area, while the areas with obvious deterioration were mainly in the Jinsha River Basin in the west. (3) Climate was the main factor affecting ecosystem changes in this region. The contribution rates of climate factors and human activities to ecosystem changes were 78.78% and 21.22%, respectively. (4) The forest, grassland, and desert ecosystems still had 8.73% of restoration potential, and the areas with greater restoration potential were mainly concentrated in the Jinsha River Basin and the Minjiang-Tuojiang River Basin located in parts of the Qinghai-Tibet Plateau. This study can provide a decision-making reference for ecological environment construction and management in the upper reaches of the Yangtze River by quantitatively evaluating the ecological restoration status and vegetation restoration potential.
表1 生态恢复态势判断依据表Tab. 1 Judging basis of ecological recovery situation |
| 判断标准 | ||
|---|---|---|
| 2000—2010年 | 2010—2019年 | |
| 持续转好 | ∂ > 0.05 | ∂ > 0.05 |
| 先转好后稳定 | ∂ > 0.05 | -0.05 ≤ ∂ ≤ 0.05 |
| 先转好后转差 | ∂ > 0.05 | ∂ < -0.05 |
| 先稳定后转好 | -0.05 ≤ ∂ ≤ 0.05 | ∂ > 0.05 |
| 持续稳定 | -0.05 ≤ ∂ ≤ 0.05 | -0.05 ≤ ∂ ≤ 0.05 |
| 先稳定后转差 | -0.05 ≤ ∂ ≤0.05 | ∂ < -0.05 |
| 先转差后转好 | ∂ < -0.05 | ∂ > 0.05 |
| 先转差后稳定 | ∂ < -0.05 | -0.05 ≤ ∂ ≤ 0.05 |
| 持续转差 | ∂ < -0.05 | ∂ < -0.05 |
表2 生态恢复程度判断依据表Tab. 2 Judging basis of ecological restoration degree |
| 序号 | 判断条件 | 生态恢复程度 |
|---|---|---|
| 1 | Si ≥ 3 | 基本稳定 |
| 2 | Si < 3 and Wi = 2 | 有所转差 |
| 3 | Si < 3 and Wi = 3 | 较明显转差 |
| 4 | Si < 3 and Wi = 4 | 明显转差 |
| 5 | Bi = 4 | 恢复程度高 |
| 6 | Bi = 3 | 恢复程度较高 |
| 7 | Si < 3 and Wi < 2 and Bi = 2 | 恢复程度中等 |
| 8 | Si < 3 and Wi < 2 and Bi = 1 | 部分要素恢复与部分要素转差 |
注:Wi表示转差的指标个数,Bi表示转好的指标个数,Si表示基本稳定的指标个数,i ≤ 4。 |
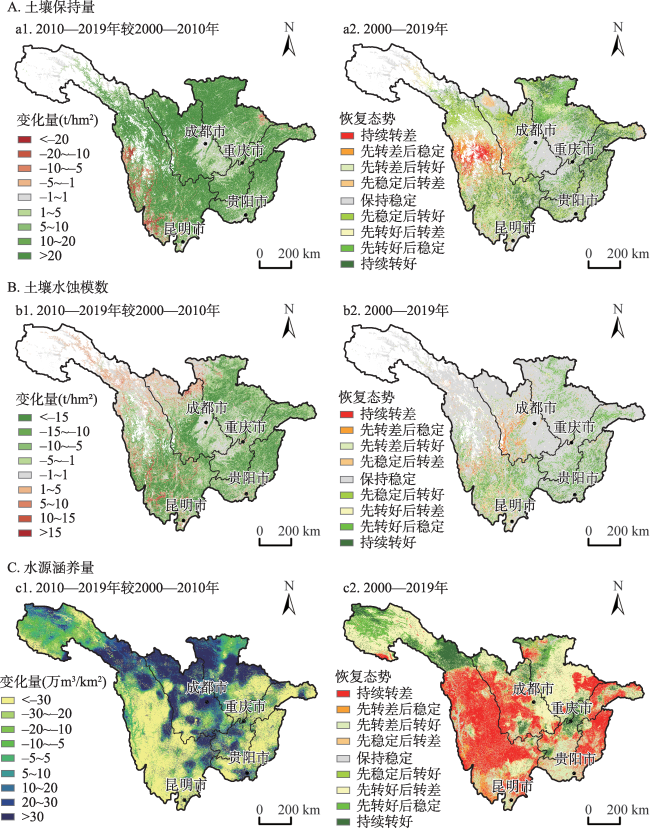
图5 2010—2019年较2000—2010年土壤保持、土壤水蚀模数和水源涵养变化量及恢复态势空间分布注:该图基于自然资源部地图技术审查中心标准地图(审图号为GS(2020)4619号)绘制,底图边界无修改。 Fig. 5 Spatial distribution of changes and recovery trends in soil conservation, soil water erosion modulus, and water source conservation from 2010 to 2019 compared with 2000 to 2010 |
表3 2000—2019年人类活动与气候因素对植被恢复贡献率Tab. 3 Contribution rate of human activities and climate to change of vegetation restoration from 2000 to 2019 |
| 区域 | 人类活动贡献率(%) | 气候贡献率(%) |
|---|---|---|
| 长江上游地区 | 21.22 | 78.78 |
| 金沙江流域 | 15.11 | 84.89 |
| 岷-沱江流域 | 31.85 | 68.15 |
| 嘉陵江流域 | 26.01 | 73.99 |
| 上游干流区 | 27.68 | 72.32 |
| 乌江流域 | 18.33 | 81.67 |
真诚感谢二位匿名评审专家在论文评审中所付出的宝贵时间和精力,两位专家对本文摘要、方法、讨论等部分的修改意见使本文受益匪浅。
| [1] |
方一平, 朱冉. 推进长江经济带上游地区高质量发展的战略思考. 中国科学院院刊, 2020, 35(8): 988-999.
[
|
| [2] |
汤宏波, 段磊, 王峰. 长江流域洪水相关因素及对策. 长江科学院院报, 2012, 29(3): 18-23, 34.
[
|
| [3] |
刘冬, 杨悦, 邹长新. 长江经济带大保护战略下长江上游生态屏障建设的思考. 环境保护, 2019, 47(18): 22-25.
[
|
| [4] |
|
| [5] |
张毅茜, 冯晓明, 王晓峰, 等. 重点脆弱生态区生态恢复的综合效益评估. 生态学报, 2019, 39(20): 7367-7381.
[
|
| [6] |
邵全琴, 樊江文, 刘纪远, 等. 重大生态工程生态效益监测与评估研究. 地球科学进展, 2017, 32(11): 1174-1182.
[
|
| [7] |
国家发展和改革委员会, 自然资源部. 全国重要生态系统保护和修复重大工程总体规划(2021-2035年). http://gi.mnr.gov.cn/202006/t20200611_2525741.html, 2022-10-11.
[National Development and Reform Commission, Ministry of Natural Resources of the People's Republic of China. National master plan for major ecosystem protection and restoration projects (2021-2035). http://gi.mnr.gov.cn/202006/t20200611_2525741.html, 2022-10-11.]
|
| [8] |
刘俊国, 崔文惠, 田展, 等. 渐进式生态修复理论. 科学通报, 2021, 66(9): 1014-1025.
[
|
| [9] |
张骞, 马丽, 张中华, 等. 青藏高寒区退化草地生态恢复: 退化现状、恢复措施、效应与展望. 生态学报, 2019, 39(20): 7441-7451.
[
|
| [10] |
王聪, 伍星, 傅伯杰, 等. 重点脆弱生态区生态恢复模式现状与发展方向. 生态学报, 2019, 39(20): 7333-7343.
[
|
| [11] |
查金, 贾宇锋, 刘政洋, 等. 市政污泥堆肥对矿山废弃地生态恢复影响的研究进展. 环境科学研究, 2020, 33(8): 1901-1910.
[
|
| [12] |
何念鹏, 徐丽, 何洪林. 生态系统质量评估方法: 理想参照系和关键指标. 生态学报, 2020, 40(6): 1877-1886.
[
|
| [13] |
丁肇慰, 肖能文, 高晓奇, 等. 长江流域2000-2015年生态系统质量及服务变化特征. 环境科学研究, 2020, 33(5): 1308-1314.
[
|
| [14] |
张梦宇, 张黎, 何洪林, 等. 基于参照系的中国陆地生态系统质量变化研究. 生态学报, 2021, 41(18): 7100-7113.
[
|
| [15] |
李冠稳, 高晓奇, 肖能文. 基于关键指标的黄河流域近20年生态系统质量的时空变化. 环境科学研究, 2021, 34(12): 2945-2953.
[
|
| [16] |
吕振涛, 李生宇, 范敬龙, 等. 蒙古国植被自然恢复潜力. 中国沙漠, 2021, 41(5): 192-201.
[
|
| [17] |
胡金娇, 周青平, 吕一河, 等. 青藏高原东缘半湿润沙地典型生态恢复模式的效果比较研究. 生态学报, 2020, 40(20): 7410-7418.
[
|
| [18] |
赵广举, 穆兴民, 田鹏, 等. 黄土高原植被变化与恢复潜力预测. 水土保持学报, 2021, 35(1): 205-212.
[
|
| [19] |
高海东, 庞国伟, 李占斌, 等. 黄土高原植被恢复潜力研究. 地理学报, 2017, 72(5): 863-874.
[
|
| [20] |
|
| [21] |
李冠稳, 肖能文, 李俊生. 基于理想参照系-关键指标的赤水河流域生态系统质量变化趋势分析. 生态学报, 2021, 41(18): 7114-7124.
[
|
| [22] |
伍星, 沈珍瑶, 刘瑞民, 等. 土地利用变化对长江上游生态系统服务价值的影响. 农业工程学报, 2009, 25(8): 236-241.
[
|
| [23] |
|
| [24] |
|
| [25] |
胡春宏, 张双虎. 论长江开发与保护策略. 人民长江, 2020, 51(1): 1-5.
[
|
| [26] |
邵全琴, 刘树超, 宁佳, 等. 2000-2019年中国重大生态工程生态效益遥感评估. 地理学报, 2022, 77(9): 2133-2153.
[
|
| [27] |
张雄一, 邵全琴, 宁佳, 等. 三北工程区植被恢复对土壤风蚀的影响及植被恢复潜力研究. 地球信息科学学报, 2022, 24(11): 2153-2170.
[
|
| [28] |
张彪, 王爽, 李庆旭, 等. 京津风沙源治理工程区水源涵养功能时空变化分析. 生态学报, 2021, 41(19): 7530-7541.
[
|
| [29] |
|
| [30] |
陈朝良, 赵广举, 穆兴民, 等. 基于RUSLE模型的湟水流域土壤侵蚀时空变化. 水土保持学报, 2021, 35(4): 73-79.
[
|
| [31] |
孙文义, 邵全琴, 刘纪远. 黄土高原不同生态系统水土保持服务功能评价. 自然资源学报, 2014, 29(3): 365-376.
[
|
| [32] |
|
| [33] |
|
| [34] |
蔡崇法, 丁树文, 史志华, 等. 应用USLE模型与地理信息系统IDRISI预测小流域土壤侵蚀量的研究. 水土保持学报, 2000, 14(2): 19-24.
[
|
| [35] |
|
| [36] |
郑度. 中国生态地理区域系统研究. 北京: 商务印书馆, 2008.
[
|
/
| 〈 |
|
〉 |