
中国建设用地扩张未来情景模拟及其对景观格局演化的影响
|
支俊俊(1987-),男,安徽怀远人,博士,副教授,博士生导师,主要研究方向为遥感与GIS应用、土地利用模拟。E-mail: zhijunjun@ahnu.edu.cn |
收稿日期: 2022-10-31
录用日期: 2023-04-23
网络出版日期: 2024-04-12
基金资助
国家自然科学基金项目(42271060)
安徽省自然科学基金项目(2208085MD91)
教育部人文社会科学研究基金项目(21YJCZH243)
安徽省自然资源科技项目(2023-K-5)
安徽省自然资源科技项目(2021-K-5)
Future construction land expansion under multiple simulation development scenarios and its impacts on landscape pattern evolution in China
Received date: 2022-10-31
Accepted date: 2023-04-23
Online published: 2024-04-12
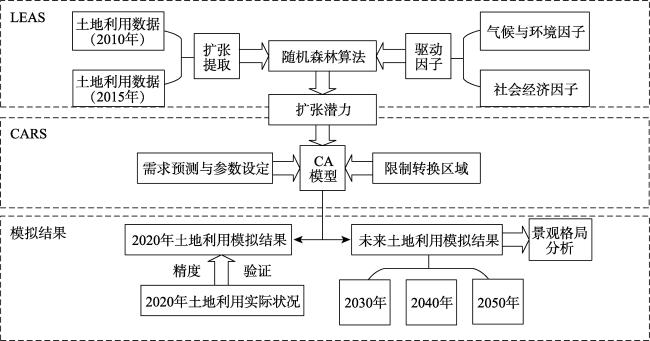
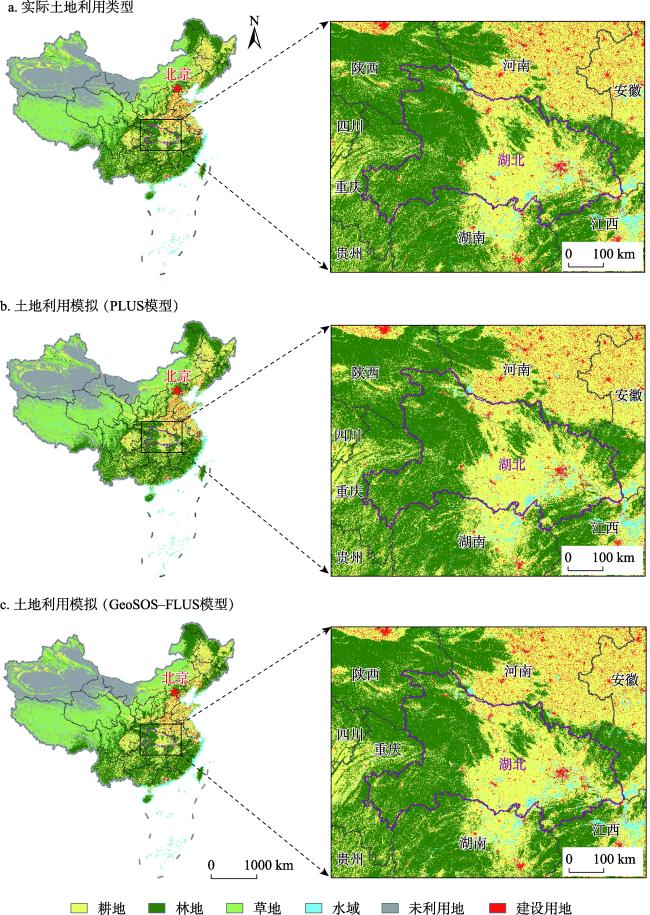
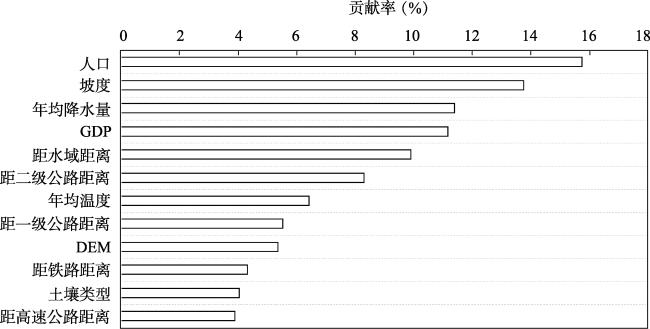
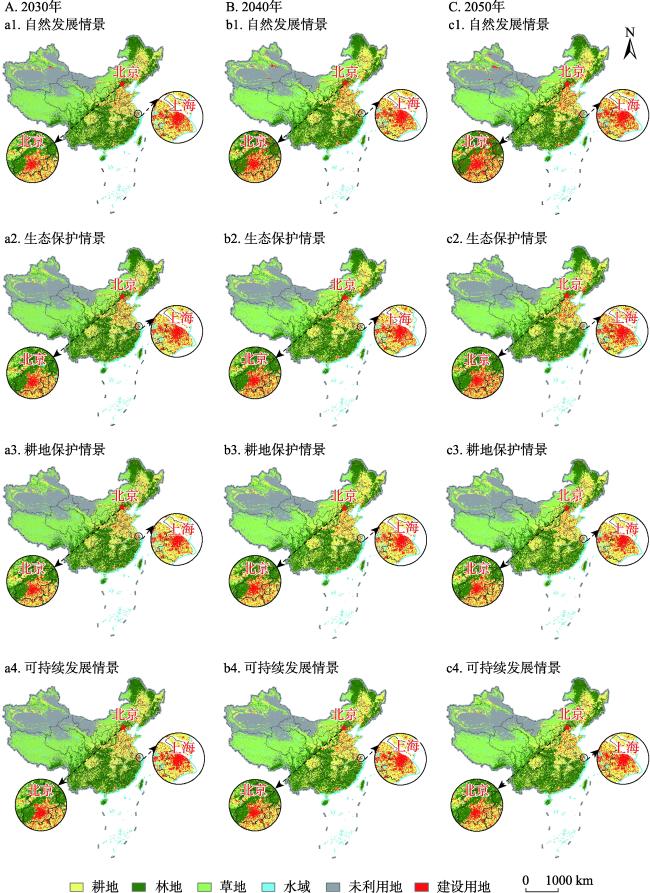
对中国建设用地的未来扩张趋势及时空格局进行模拟预测,可为科学编制国土空间规划和合理调控城乡发展提供科学依据。本研究对未来30年中国建设用地扩张进行多情景模拟预测,并分析不同区域建设用地扩张的时空演化特征及其对景观格局演化的影响。研究结果表明:① 基于斑块生成土地利用模拟模型(Patch-generating Land Use Simulation,PLUS)可以获得较高的模拟精度,各分区Kappa系数均高于0.92,总体精度均高于95%,FoM值均高于0.40,表明PLUS模型适用于全国尺度和大区域尺度的土地利用模拟。② 影响中国建设用地扩张最主要的因素为人口、坡度和年均降水量,存在区域性差异。③ 自然发展、耕地保护、生态保护和可持续发展四种情景下模拟预测的未来土地利用的结构和特征具有明显差异,在可持续发展情景下建设用地扩张主要占用非重点保护的耕地和生态用地以及未利用地,可满足经济发展对于建设用地指标的刚性需求,有助于实现可持续高质量发展。④ 建设用地扩张对景观格局产生显著影响,在可持续发展情景下,与2020年相比,2030年、2040年和2050年建设用地预计增长分别为-0.72%、-0.51%和1.19%,中部和东部地区的优势景观面积占比持续下降,景观多样性不断上升;西部地区的景观聚集度显著下降,破碎度持续上升。本研究通过建设用地扩张的情景模拟及其对景观格局的影响分析,尝试为制定区域差别化政策提供参考,对实现经济发展、耕地保护和生态保护三者之间的均衡协调可持续发展具有重要意义。
支俊俊 , 韩陈勖 , 王雪婷 , 张立康 , 褚超群 . 中国建设用地扩张未来情景模拟及其对景观格局演化的影响[J]. 地理研究, 2024 , 43(4) : 843 -860 . DOI: 10.11821/dlyj020221191
The simulation of future construction land expansion and the analysis of its impacts on landscape pattern evolution in China help to provide scientific basis for the formulation of territorial space planning and the regulation of urban & rural development. This study aims to simulate the expansion of construction land in China in the next three decades under multiple development scenarios and to analyze the spatiotemporal evolution characteristics of construction land expansion in different regions and its impacts on landscape pattern evolution. The results show that: (1) The simulation results of the Patch-generating Land Use Simulation (PLUS) model have higher accuracy compared with GeoSOS-FLUS model, indicating that the PLUS model has certain applicability to national and large-scale regional land use simulations; (2) The main influencing factors of China's construction land expansion are determined as population, slope, and annual precipitation, but difference exists among different regions; (3) The structure and characteristics of future land use predicted under the four scenarios of natural development, cultivated land protection, ecological protection, and sustainable development are obviously different. The increase of construction land under the sustainable development scenario is mainly derived from normal cultivated land, ecological land, and unused land. Such a scenario could meet the rigid demand of economic development and helps to realize a sustainable development; (4) The rapid expansion of construction land has significant impacts on landscape patterns. The expansion areas of construction land are predicted to increase by -0.72% for 2030, -0.51% for 2040, and 1.19% for 2050 compared with 2020. The proportion of dominant landscape area in central and eastern regions of China decreases continuously and the landscape diversity increases continuously, while the degree of landscape aggregation decreases significantly and the degree of fragmentation increases continuously in the western region. Through the simulations of construction land expansion under multiple development scenarios and the analysis of their impacts on landscape pattern evolution in China, this study attempts to provide a reference for the formulation of regional differentiated policies on a national scale, which is of great significance for the efficient use of land resources and for achieving the balanced, coordinated, and sustainable development among economic development, cultivated land protection, and ecological protection.
表1 指标说明及数据来源Tab. 1 Indicator description and data source |
| 一级指标 | 二级指标 | 数据说明 | 数据来源 |
|---|---|---|---|
| 土地利用 | 土地利用数据 | 2010年、2015年、2020年三期,30 m分辨率 | Google Earth Engine遥感云平台(https://code.earthengine.google.com) |
| 气候与环境 因子 | 距水域距离 | 到河流、湖泊、水库等水体的距离 | 提取自2020年土地利用数据(https://code.earthengine.google.com) |
| DEM | 栅格数据,1 km分辨率 | 中国科学院资源环境科学与数据中心数据平台(http://www.resdc.cn) | |
| 坡度 | 基于DEM提取 | ||
| 土壤类型 | 栅格数据,1 km分辨率 | ||
| 年均气温 | 2010—2020年逐年年平均气温,1 km分辨率 | ||
| 年均降水量 | 2010—2020年逐年年平均降水量,1 km分辨率 | ||
| 社会经济 因子 | 人口 | 2010年、2015年、2019年人口空间分布图,1 km分辨率 | |
| GDP | 2010年、2015年、2019年GDP空间分布图,1 km分辨率 | ||
| 距铁路距离 | 到铁路轨道的距离 | OpenStreetMap矢量数据(https://www.openstreetmap.org) | |
| 距高速公路距离 | 到高速公路的距离 | ||
| 距一级道路距离 | 距2021年中国路网数据中一级道路的距离 | ||
| 距二级道路距离 | 距2021年中国路网数据中二级道路的距离 | ||
| 限制因素 | 自然保护区数据 | 2021年矢量数据 |
表2 景观指数说明Tab. 2 Description of landscape indexes used in the study |
| 景观指数 | 取值范围 | 生态学意义 |
|---|---|---|
| 斑块密度指数(PD) | PD>0 | 单位面积斑块数量,比值越大,景观破碎化程度愈高 |
| 景观面积比例指数(PLAND) | 0<PLAND≤100 | 景观中某一斑块类型的面积占比 |
| 最大斑块指数(LPI) | 0<LPI≤100 | 景观或某一类型中最大斑块的面积占比 |
| 聚集度指数(AI) | 0<AI≤100 | 反映景观破碎度,取值大表明整个景观倾向于由较少的大斑块组成,取值小表明景观类型分散分布,由许多小斑块组成 |
| 香农多样性指数(SHDI) | SHDI≥0 | 反映景观水平的复杂程度,值越大则斑块丰富度越大或不同斑块面积分布越均匀 |
表3 2020年PLUS模型和GeoSOS-FLUS模型的各情景土地利用模拟精度评价Tab. 3 Accuracy assessment of land use simulations using PLUS and GeoSOS-FLUS models under different development scenarios in 2020 |
| 情景 | PLUS模型 | GeoSOS-FLUS模型 | |||||||||||
|---|---|---|---|---|---|---|---|---|---|---|---|---|---|
| 整体模拟精度 | 建设用地模拟精度 (%) | 整体模拟精度 | 建设用地模拟精度 (%) | ||||||||||
| Kappa | OA(%) | FoM | 生产者 精度 | 用户 精度 | Kappa | OA(%) | FoM | 生产者 精度 | 用户 精度 | ||||
| 自然发展 | 0.9373 | 95.22 | 0.4131 | 91.15 | 89.05 | 0.9335 | 94.93 | 0.3940 | 84.01 | 96.38 | |||
| 生态保护 | 0.9349 | 95.05 | 0.4043 | 91.41 | 92.19 | 0.9330 | 94.89 | 0.3940 | 83.88 | 96.12 | |||
| 耕地保护 | 0.9370 | 95.20 | 0.4115 | 91.18 | 95.29 | 0.9351 | 95.05 | 0.4049 | 91.08 | 92.99 | |||
| 可持续发展 | 0.9424 | 95.61 | 0.4302 | 90.46 | 99.35 | 0.9382 | 94.59 | 0.4152 | 83.73 | 96.33 | |||
表4 2020年可持续情景下PLUS模型模拟各分区土地利用的精度评价Tab. 4 Accuracy assessment of land use simulation for each region using PLUS model under the sustainable development scenario in 2020 |
| 区域 | 整体模拟精度 | 建设用地模拟精度 | ||||
|---|---|---|---|---|---|---|
| Kappa | OA(%) | FoM | 生产者精度(%) | 用户精度(%) | ||
| 东北地区 | 0.9415 | 96.62 | 0.4776 | 92.74 | 99.15 | |
| 东部地区 | 0.9349 | 95.79 | 0.4912 | 91.97 | 99.54 | |
| 中部地区 | 0.9300 | 95.66 | 0.4740 | 91.17 | 99.50 | |
| 西部地区 | 0.9247 | 94.69 | 0.3699 | 79.52 | 99.04 | |
| 全国 | 0.9421 | 95.59 | 0.4294 | 90.90 | 99.48 | |
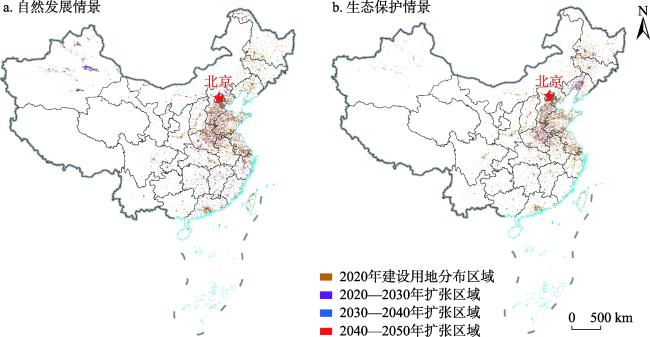
图5 2020—2050年期间自然发展、生态保护情景下建设用地扩张区域分布注: 基于自然资源部地图技术审查中心标准地图服务网站的标准地图(审图号:GS(2020)4619号)绘制,底图边界无修改。 Fig. 5 Distribution of construction land expansion areas under the natural development scenario and the ecological protection scenario during the period 2020-2050 |
表5 2020—2050年中国整体景观格局指数变化统计Tab. 5 Change statistics of China's overall landscape pattern index from 2020 to 2050 |
| 斑块密度指数 PD(个/km2) | 最大斑块指数 LPI(%) | 聚集度指数 AI(%) | 香农多样性指数 SHDI | |
|---|---|---|---|---|
| 2020年 | 0.0393 | 22.9198 | 79.7541 | 1.5146 |
| 2030年 | 0.0386 | 22.8222 | 79.6830 | 1.5124 |
| 2040年 | 0.0389 | 22.6955 | 79.4780 | 1.5138 |
| 2050年 | 0.0392 | 22.5959 | 79.2520 | 1.5156 |
表6 中国各土地利用类型聚集度指数(AI)和景观面积比例指数(PLAND)的变化统计Tab. 6 Change statistics of aggregation index (AI) and percentage of landscape (PLAND) for land use types in China from 2020 to 2050 |
| 指数 | 用地类型 | 2020年 | 2030年 | 2040年 | 2050年 |
|---|---|---|---|---|---|
| 聚集度指数AI | 耕地 | 68.0731 | 68.1892 | 68.0630 | 68.0582 |
| 林地 | 81.0828 | 80.9779 | 80.6412 | 80.3968 | |
| 草地 | 83.8658 | 83.7596 | 83.7769 | 83.5741 | |
| 水域 | 57.3059 | 58.5320 | 58.6022 | 59.0742 | |
| 未利用地 | 89.9695 | 89.7499 | 89.5292 | 89.1720 | |
| 建设用地 | 33.0871 | 33.3461 | 33.8185 | 34.8502 | |
| 景观面积比例指数 PLAND | 耕地 | 19.2524 | 19.4229 | 19.6785 | 19.8062 |
| 林地 | 24.9670 | 24.8781 | 24.8632 | 24.8909 | |
| 草地 | 29.9387 | 29.9293 | 29.7499 | 29.6372 | |
| 水域 | 1.5601 | 1.4290 | 1.4155 | 1.3952 | |
| 未利用地 | 21.7429 | 21.7581 | 21.6607 | 21.5624 | |
| 建设用地 | 2.5388 | 2.5826 | 2.635 | 2.7152 |
真诚感谢匿名评审专家在论文评审中所付出的时间和精力,专家对本文研究综述、情景模拟、讨论分析、结论梳理,以及文字表述等方面的修改意见,使本文的结构更加科学,逻辑更加清晰,表达更加准确,获益匪浅。
| [1] |
|
| [2] |
李少英, 刘小平, 黎夏, 等. 土地利用变化模拟模型及应用研究进展. 遥感学报, 2017, 21(3): 329-340.
[
|
| [3] |
赵林峰, 刘小平, 刘鹏华, 等. 基于地理分区与FLUS模型的城市扩张模拟与预警. 地球信息科学学报, 2020, 22(3): 517-530.
[
|
| [4] |
顾朝林, 管卫华, 刘合林. 中国城镇化2050: SD模型与过程模拟. 中国科学: 地球学, 2017, 47(7): 818-832.
[
|
| [5] |
|
| [6] |
|
| [7] |
曹帅, 金晓斌, 杨绪红, 等. 耦合MOP与GeoSOS-FLUS模型的县级土地利用结构与布局复合优化. 自然资源学报, 2019, 34(6): 1171-1185.
[
|
| [8] |
|
| [9] |
王保盛, 廖江福, 祝薇, 等. 基于历史情景的 FLUS 模型邻域权重设置: 以闽三角城市2030年土地利用模拟为例. 生态学报, 2019, 39(12): 4284-4298.
[
|
| [10] |
|
| [11] |
|
| [12] |
|
| [13] |
|
| [14] |
李广东, 戚伟. 中国建设用地扩张对景观格局演化的影响. 地理学报, 2019, 74(12): 2572-2591.
[
|
| [15] |
|
| [16] |
|
| [17] |
|
| [18] |
|
| [19] |
|
| [20] |
|
| [21] |
刘沁萍, 朱闯, 田洪阵, 等. 2001—2017年中国建设用地时空分异特征. 长江流域资源与环境, 2020, 29(10): 2113-2123.
[
|
| [22] |
|
| [23] |
|
| [24] |
叶高斌, 苏伟忠, 孙小祥. 基于Dyna-CLUE模型的太湖流域建设用地空间扩张模拟. 长江流域资源与环境, 2018, 27(4): 725-734.
[
|
| [25] |
|
| [26] |
|
| [27] |
|
| [28] |
梁保平, 雷艳, 覃业努, 等. 快速城市化背景下广西典型城市景观空间格局动态比较研究. 生态学报, 2018, 38(12): 4526-4536.
[
|
| [29] |
|
| [30] |
|
| [31] |
|
| [32] |
邓华, 邵景安, 王金亮, 等. 多因素耦合下三峡库区土地利用未来情景模拟. 地理学报, 2016, 71(11): 1979-1997.
[
|
| [33] |
魏乐, 周亮, 孙东琪, 等. 黄河流域城市群扩张的时空格局演化及情景模拟: 以呼包鄂榆城市群为例. 地理研究, 2022, 41(6): 1610-1622.
[
|
| [34] |
|
/
| 〈 |
|
〉 |