
中国区域人口收缩对经济增长的影响及形成机理
|
刘振(1990-),男,山东滨州人,博士,副研究员,硕士生导师,研究方向为城市地理与人口地理。E-mail: lzhgeog@sina.cn |
收稿日期: 2023-07-28
录用日期: 2024-01-12
网络出版日期: 2024-04-12
基金资助
国家自然科学基金项目(42001166)
国家自然科学基金项目(42271246)
Effects of regional population shrinkage on economic growth and the underlying mechanism
Received date: 2023-07-28
Accepted date: 2024-01-12
Online published: 2024-04-12
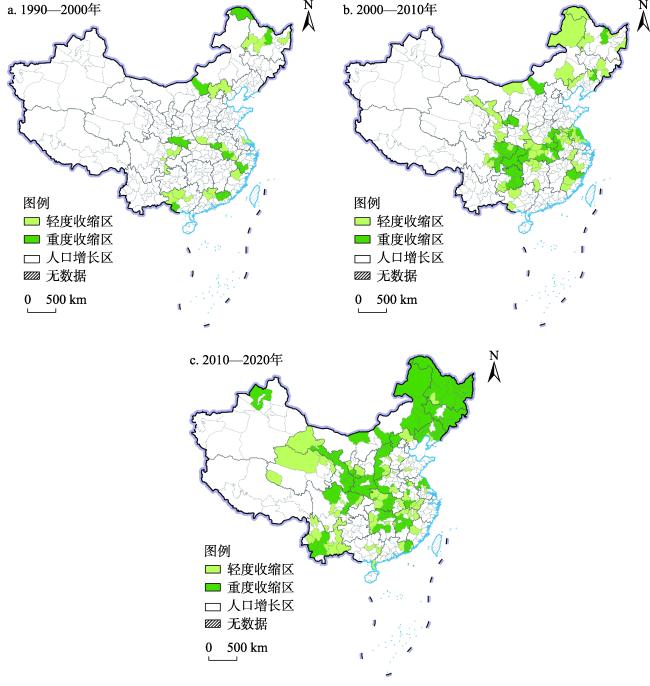
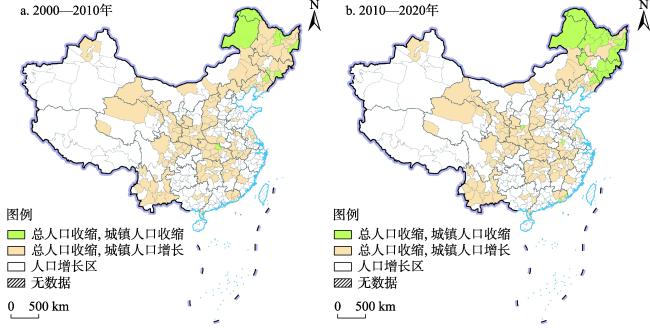
近年来中国区域尺度的人口收缩不断蔓延,然而区域人口收缩对经济发展会产生怎样的影响尚缺乏探讨。利用1990—2020年4个普查时点地级尺度的人口普查数据,分析地级单元常住人口变化,识别人口收缩区,建立人口收缩经济效应测度模型,分析人口收缩对经济增长的影响及其空间分异特征,并探讨人口收缩经济效应的形成机理。研究发现:① 1990—2020年,人口收缩区呈快速扩张趋势,2020年人口收缩的地级单元占比已超过40%。② 研究时期内,人口收缩并未对区域经济增长产生负向影响,反而能够促进区域人均产出水平的提高。③ 人口收缩对区域经济增长的影响存在一定的空间分异,东部和中西部地区人口收缩能够促进经济增长,但东北地区不显著。④ 在解释机理上,这主要与现阶段绝大多数人口收缩区以农村人口外流引起的收缩为主,而城镇人口仍保持增长这一特征密切相关;东北地区城镇人口收缩持续蔓延,是东北地区与其它地区人口收缩经济效应存在差异的重要原因。建议避免单纯从负面角度看待区域常住人口收缩现象,但必须重视城镇人口收缩区域的经济可持续发展问题。
刘振 , 李伟 , 刘盛和 . 中国区域人口收缩对经济增长的影响及形成机理[J]. 地理研究, 2024 , 43(4) : 949 -965 . DOI: 10.11821/dlyj020230622
In recent years, the phenomenon of population shrinkage has been observed at the regional level. However, the key issue of whether population shrinkage affects regional economic development is still lacking discussion. This study uses the fourth (1990), fifth (2000), sixth (2010), and seventh (2020) population census data in China at the prefecture level, and employs the change of total resident population as the index to identify population shrinkage areas. Subsequently, a population-economic growth model is established to analyze the impacts of population shrinkage on regional economic growth and the possible spatial differentiation characteristics, as well as to discuss the underlying mechanisms. The main findings of this study are as follows: Firstly, population shrinkage areas rapidly expanded from 1990 to 2020, forming large-scale concentration areas in the central and western regions and the northeast region, and the eastern region has also shown a characteristic of local centralized distribution, such as the northern part of Jiangsu province. Secondly, the empirical models show that population shrinkage did not produced a negative impact on regional economic growth during the research period. Instead, it promoted the improvement of the per capita output level. Thirdly, there were spatial differences in the impacts of population shrinkage on regional economic development. Population shrinkage has a significant positive impact on regional economic growth in the eastern and central-western regions, while population shrinkage has insignificant impacts on regional economic growth in the northeast region. Fourthly, in terms of the underlying mechanisms, population shrinkage in most areas is mainly caused by rural population outflow, while the urban population still maintains rapid growth. Given urban areas are the core of regional economic development, population shrinkage may not cause the problems of insufficient regional labor supply and low growth of human capital. Instead, the decline of rural surplus labor can help improve labor productivity. In contrast, the emergence of urban population shrinkage in many research units in the northeast region may have been a severe challenge for labor supply, regional innovation capability, and economic agglomeration, which becomes an important reason for the insignificant economic effect of population shrinkage. Based on the above findings, this study suggests avoiding a one-sided negative perspective on the phenomenon of population shrinkage, but it is suggested to pay attention to the sustainable development of population and economy in urban population shrinkage areas.
Key words: population shrinkage; migration; economic effects; urbanization; China
表1 变量设置及指标选取说明Tab. 1 The descriptions of the independent variables |
| 变量名称 | 指标名称 | 指标类型 | 指标代码 | 指标说明 | |
|---|---|---|---|---|---|
| 核心 变量 | 人口变化因素 | 人口高速增长 | 虚拟变量 | PG_high | 人口高速增长=1;否=0 |
| 人口低速增长 | 虚拟变量 | PG_low | 人口低速增长=1;否=0 | ||
| 人口轻度收缩 | 虚拟变量 | PS_slight | 人口轻度收缩=1;否=0 | ||
| 人口重度收缩 | 虚拟变量 | PS_severe | 人口重度收缩=1;否=0 | ||
| 控制 变量 | 经济发展水平 | 初始劳动力人均 产出 | 连续变量 | PerGDP | 国内生产总值与15-64岁劳动力人口的比值 |
| 产业结构 | 二产从业人员占比 | 连续变量 | Jobsec | 二产从业人员占从业人员总数的比例 | |
| 三次从业人员占比 | 连续变量 | Jobserv | 三产从业人员占从业人员总数的比例 | ||
| 人力资本水平 | 平均受教育年限 | 连续变量 | Pedu | 按照现行学制为受教育年数计算的15岁及以上人口平均受教育年限 | |
| 基础设施水平 | 交通路网密度 | 连续变量 | Traffic | 高等级公路(高速公路、国道、省道)总长度与区域总面积的比值 | |
| 城镇人口密度 | 城镇人口密度 | 连续变量 | Density | 初期城镇人口规模与城镇建设用地规模的比值 |
表2 地级尺度分时期人口收缩区数量特征Tab. 2 The number of population shrinkage units at the prefecture level in different periods |
| 1990—2000年 | 2000—2010年 | 2010—2020年 | |
|---|---|---|---|
| 轻度收缩区 | 21(6.2%) | 55(16.1%) | 53(15.6%) |
| 重度收缩区 | 13(3.8%) | 38(11.2%) | 96(28.2%) |
| 总计 | 34(10.0%) | 93(27.3%) | 149(43.8%) |
表3 人口收缩经济效应面板模型回归结果Tab. 3 The regression results of the effects of population shrinkage on economic growth in China |
| 全国(1) | 东部地区(2) | 中西部地区(3) | 东北地区(4) | |
|---|---|---|---|---|
| PG_low | 0.012* | 0.011* | 0.014* | 0.004 |
| PS_slight | 0.030** | 0.029* | 0.022** | 0.072 |
| PS_severe | 0.028** | 0.033* | 0.036** | 0.048 |
| PerGDP | -0.440** | -0.448** | -0.481** | -0.530** |
| Jobsec | 0.659** | 0.911** | 0.321** | -0.111 |
| Jobserv | 0.670** | 0.172** | 1.359** | 1.087** |
| Pedu | 3.219** | 5.012** | 0.350 | 4.024 |
| Traffic | 0.162** | 0.167** | 0.115** | 0.059 |
| Density | 0.061** | 0.072** | 0.032* | 0.026* |
| P0010 | 0.781** | 0.561** | 0.869** | 1.114** |
| P1020 | 0.972** | 0.681** | 1.181** | 1.126** |
| 常数项 | -0.318** | -0.189** | -0.488** | 0.265* |
| Adjust R2 | 0.57 | 0.43 | 0.48 | 0.44 |
| 样本量 | 1020 | 267 | 645 | 108 |
注:**表示在99%的置信水平下显著,*表示在95%的置信水平下显著。面板模型中,Hausman检验结果拒绝原假设,宜采用固定效应模型;另外,除控制个体固定效应外,本文进一步加入时间虚拟变量(1990—2000作为参照组),以控制不同时期经济增长差异的影响。 |
表4 两阶段最小二乘法稳健估计结果Tab. 4 The regression results based on the two-stage least squares method |
| 全国(5) | 东部地区(6) | 中西部地区(7) | 东北地区(8) | |
|---|---|---|---|---|
| PG_low | 0.010* | 0.016* | 0.021* | 0.006 |
| PS_slight | 0.028** | 0.019* | 0.024** | 0.042 |
| PS_severe | 0.035** | 0.029* | 0.040** | 0.049 |
| PerGDP | -0.314** | -0.411** | -0.488** | -0.540** |
| Jobsec | 0.441** | 0.906** | 0.282** | -0.168 |
| Jobserv | 0.590** | 0.145** | 1.028** | 1.012** |
| Pedu | 1.471* | 4.976** | 0.299 | -3.967 |
| Traffic | 0.199** | 0.166** | 0.118** | -0.047 |
| Density | 0.038** | 0.050** | 0.042* | 0.030* |
| P1020 | 0.006 | -0.080 | 0.048 | 0.035 |
| 常数项 | 0.341** | -0.163** | -0.536** | 0.349* |
| Adjust R2 | 0.49 | 0.46 | 0.48 | 0.45 |
| 样本量 | 680 | 178 | 430 | 72 |
注:**表示在99%的置信水平下显著;*表示在95%的置信水平下显著。时间虚拟变量中,2000—2010年为参照组。 |
表5 人口收缩区城镇人口变化差异对经济增长影响分析Tab. 5 The regression results of the effects of urban population shrinkage on economic growth in China |
| 截面回归(OLS) | 两阶段回归(2SLS) | ||||
|---|---|---|---|---|---|
| 全国(9) | 东北地区(10) | 全国(11) | 东北地区(12) | ||
| UPS | -0.059* | -0.090* | -0.048* | -0.086* | |
| RPS | 0.068* | 0.011* | 0.062* | 0.010* | |
| PerGDP | -0.324** | -0.528** | -0.337** | -0.489** | |
| Jobsec | 0.567** | -0.111 | 0.512** | -0.089 | |
| Jobserv | 1.089** | 1.083** | 1.039** | 1.010** | |
| Pedu | -1.063 | -4.129 | -1.068 | -3.891 | |
| Traffic | 0.159* | -0.056 | 0.129* | -0.035 | |
| Density | 0.036** | 0.048** | 0.030* | 0.026* | |
| Northeast | -0.280** | -0.241** | |||
| Midwest | 0.061 | 0.058 | |||
| 常数项 | 0.398** | 0.278* | 0.321** | 0.232* | |
| Adjust R2 | 0.45 | 0.50 | 0.44 | 0.48 | |
| 样本量 | 340 | 36 | 340 | 36 | |
注:**表示在99%的置信水平下显著;*表示在95%的置信水平下显著。东部地区和中西部地区城镇人口收缩的单元极少,未进行回归分析。 |
真诚感谢匿名评审专家在论文评审中所付出的时间和精力,评审专家对本文理论分析、模型方法、指标选取与解释、机理解释等方面的修改意见,使本文获益匪浅。
| [1] |
|
| [2] |
|
| [3] |
|
| [4] |
|
| [5] |
杨舸. 日、韩、印人口结构变动趋势及给中国的启示. 北京社会科学, 2013, (4): 147-153.
[
|
| [6] |
刘振, 戚伟, 齐宏纲, 等. 1990—2015年中国县市尺度人口收缩的演变特征及影响因素. 地理研究, 2020, 39(7): 1565-1579.
[
|
| [7] |
中华人民共和国国务院.国家人口发展规划(2016—2030年). https://www.gov.cn/gongbao/content/2017/content_5171324.htm. 2016-12-30.
[ The State Council of the People's Republic of China. National Population Development Plan (2016—2030). 2016-12-30.]
|
| [8] |
杨强, 李丽, 王运动, 等. 1935—2010年中国人口分布空间格局及其演变特征. 地理研究, 2016, 35 (8): 1547-1560.
[
|
| [9] |
王露, 封志明, 杨艳昭, 等. 2000—2010年中国不同地区人口密度变化及其影响因素. 地理学报, 2014, 69(12): 1790-1798.
[
|
| [10] |
龚胜生, 陈丹阳, 张涛. 1982—2010年湖北省人口分布格局变迁及其影响因素. 长江流域资源与环境, 2015, 24(5): 728-734.
[
|
| [11] |
刘志敏, 修春亮, 魏冶, 等. 1990—2010年东北地区人口变化的空间格局及影响因素. 西北人口, 2017, 38(5): 19-26.
[
|
| [12] |
|
| [13] |
张国俊, 黄婉玲, 周春山, 等. 城市群视角下中国人口分布演变特征. 地理学报, 2018, 73(8): 1513-1525.
[
|
| [14] |
刘振, 戚伟, 齐宏纲, 等. 多时期演变视角下中国人口收缩区的识别、空间特征与成因类型分析. 地理科学进展, 2021, 40(3): 357-369.
[
|
| [15] |
潘士远, 史晋川. 内生经济增长理论: 一个文献综述. 经济学(季刊), 2002, (3): 753-786.
[
|
| [16] |
|
| [17] |
|
| [18] |
|
| [19] |
|
| [20] |
|
| [21] |
|
| [22] |
|
| [23] |
|
| [24] |
|
| [25] |
刘振, 戚伟, 刘盛和. 中国人口收缩的城乡分异特征及形成机理. 地理科学, 2021, 41(7): 1116-1128.
[
|
| [26] |
刘涛, 卓云霞, 彭荣熙, 等. 基于城乡人口变动视角的中国城镇化地域类型时空演变. 地理学报, 2022, 77(12): 3006-3022.
[
|
| [27] |
杨玲, 张新平. 人口年龄结构、人口迁移与东北经济增长. 中国人口·资源与环境, 2016, 26(9): 28-35.
[
|
| [28] |
于婷婷, 宋玉祥, 浩飞龙, 等. 东北地区人口结构对经济增长的影响. 经济地理, 2016, 36(10): 26-32.
[
|
| [29] |
韩增林, 赵启行, 赵东霞, 等. 2000—2015年东北地区县域人口与经济耦合协调演变及空间差异: 以辽宁省为例. 地理研究, 2019, 38(12): 3025-3037.
[
|
| [30] |
陆旸, 蔡昉. 人口结构变化对潜在增长率的影响: 中国和日本的比较. 世界经济, 2014, 37(1): 3-29.
[
|
| [31] |
刘穷志, 何奇. 人口老龄化、经济增长与财政政策. 经济学(季刊), 2013, 12 (1): 119-134.
[
|
| [32] |
齐明珠. 中国人口变动对经济增长影响的量化研究. 人口与经济, 2013, (6): 10-18.
[
|
| [33] |
刘新荣. 东北地区人口变动及对经济发展的影响. 长春: 吉林大学博士学位论文, 2011: 133-139.
[
|
| [34] |
魏洪英. 东北地区人口流出及其对经济发展的影响研究. 长春: 吉林大学博士学位论文, 2018: 95-99.
[
|
| [35] |
刘振, 戚伟, 王雪芹, 等. 国内外人口收缩研究进展综述. 世界地理研究, 2019, 28(1): 13-23.
[
|
| [36] |
|
| [37] |
|
| [38] |
|
| [39] |
|
| [40] |
|
| [41] |
陈乐, 李郇, 姚尧, 等. 人口集聚对中国城市经济增长的影响分析. 地理学报, 2018, 73(6): 1107-1120.
[
|
| [42] |
于斌斌. 产业结构调整与生产率提升的经济增长效应: 基于中国城市动态空间面板模型的分析. 中国工业经济, 2015, (12): 83-98.
[
|
| [43] |
贺灿飞, 潘峰华. 中国城市产业增长研究: 基于动态外部性与经济转型视角. 地理研究, 2009, 28(3): 726-737.
[
|
| [44] |
|
| [45] |
李晶晶, 苗长虹. 长江经济带人口流动对区域经济差异的影响. 地理学报, 2017, 72(2): 197-212.
[
|
| [46] |
盛彦文, 骆华松, 宋金平, 等. 中国东部沿海五大城市群创新效率、影响因素及空间溢出效应. 地理研究, 2020, 39(2):257-271.
[
|
| [47] |
林雄斌, 杨家文, 陶卓霖, 等. 交通投资、经济空间集聚与多样化路径: 空间面板回归与结构方程模型视角. 地理学报, 2018, 73(10): 1970-1984.
[
|
| [48] |
胡鞍钢, 刘生龙, 马振国. 人口老龄化、人口增长与经济增长: 来自中国省际面板数据的实证证据. 人口研究, 2012, 36(3): 14-26.
[
|
| [49] |
毕秀晶, 宁越敏. 长三角大都市区空间溢出与城市群集聚扩散的空间计量分析. 经济地理, 2013, 33(1): 46-53.
[
|
| [50] |
盛科荣, 张杰, 张红霞. 上市公司500强企业网络嵌入对中国城市经济增长的影响. 地理学报, 2021, 76(4): 818-834.
[
|
| [51] |
|
| [52] |
高梦滔, 姚洋. 农户收入差距的微观基础:物质资本还是人力资本?. 经济研究, 2006, 41(12): 10.
[
|
| [53] |
|
| [54] |
罗小龙, 曹姝君, 顾宗倪. 回流城镇化: 中部地区城镇化开启新路径. 地理科学, 2020, 40(5): 685-690.
[
|
| [55] |
孙平军, 王柯文. 中国东北三省城市收缩的识别及其类型划分. 地理学报, 2021, 76(6): 1366-1379.
[
|
| [56] |
杜志威, 李郇. 珠三角快速城镇化地区发展的增长与收缩新现象. 地理学报, 2017, 72(10): 1800-1811.
[
|
| [57] |
柳如眉, 刘淑娜, 柳清瑞. 人口变动对东北地区经济增长的影响研究. 中国人口科学, 2021, (5): 63-76, 127.
[
|
| [58] |
杨振山, 杨航. 多尺度人力资本空间测度: 格局分析与尺度关联. 地理研究, 2022, 41(10): 2663-2679.
[
|
/
| 〈 |
|
〉 |